San Francisco Municipal Transportation Agency is planning to restore more bus service in early 2022, and wants residents’ thoughts about what the priorities should be in doing that. While SFMTA has laid out the outlines of the options in its story map, this piece of ours gives you a deeper dive into the three alternatives, and especially their consequences for riders, potential riders, and for many other goals that the city cares about. I hope you’ll share this with every San Franciscan you know, because there are some difficult choices to be made, and everyone’s opinion matters. Once you review this, please take SFMTA’s Survey, before October 1, using the link at the end of the post.
NOTE: Some graphics in this post may be too small to read. Click any graphic to enlarge it.
This post is long but easy to navigate.
- Part 1 provides an overview of the alternatives.
- Part 2 provides neighborhood-level detail on each alternative, and
- Part 3 presents detailed data about the plan’s impacts, by location, by demographic group, and for the whole city.
___________________________________
Table of Contents
- What is this all about?
- How did we get here?
- So what’s this about?
- Why not just put service back the way it was?
- So what is SFMTA proposing?
- Does this affect the whole city?
- What are the alternatives?
- What do the alternatives all have in common?
- What’s great about the Familiar Alternative?
- What’s great about the Frequent Alternative? Access!
- Sounds like you already like the Frequent Alternative …
- The Alternatives
- Hayes Valley, the Haight, Western Addition (Lines 5, 6, 7, 21)
- The Haight, Parnassus, Golden Gate Heights (Lines 6, 7, 52, 66)
- Post, Sutter, Clement, and Jackson Streets (Lines 2, 3, 12)
- South of Market, Market St., Financial District (Lines 47, 49, 28, 10/12, 30)
- The Presidio, the Marina, Fisherman’s Wharf, Chinatown, North Beach (Lines 22, 28, 30, 43, 47, 49)
- The Mission, Excelsior, City College (Lines 22, 49)
- Benefits and Tradeoffs
___________________________________
1. What is this all about?
How did we get here?
During the COVID-19 pandemic, Muni initially reduced service, creating a Muni Core Service Network to serve essential trips during the early days of the pandemic. Since then, Muni has been gradually restoring service. They’ve put back many lines that existed before, but they have also added service in busy corridors and created new lines. These restorations have focused especially on neighborhoods with high concentrations of low-income people, referred to as Muni Equity Strategy neighborhoods.
So what’s this about?
SFMTA is planning to increase service in early 2022, bringing us back to about the same quantity of all-day (not rush hour) bus service that they had before the pandemic.
As they add more service back, should they put back the routes just the way they were? Or can they do other things that will make it better than it was? That’s what they need your help to figure out.
This is not the last word in service improvement! In fact, as soon as these changes for early 2022 are set. We’ll be working with SFMTA on a more ambitious growth plan.
Why not just put service back the way it was?
That’s one of the options, but there are good reasons to stop and make sure that makes sense.
San Francisco has changed, and so have its transit needs.
- The Muni network was designed to focus on the Financial District, but today offices sit mostly empty as remote-eligible employees work from home. As a result, there are far more neighborhood-to-neighborhood trips and fewer trips downtown. Maybe service should focus more of our service on the trips people are making now.
- Businesses and other destinations have closed, relocated, or changed how they operate. This means that people may be traveling to different places to do the things they did before.
- We can’t assume that everyone still wants to make the trips that they made in 2019. Many people have changed jobs and rearranged their lives. Their travel needs may be very different.
- The old network had lots of problems that could be fixed. In particular, many lines didn’t come often enough. SFMTA has a goal of five-minute all day frequency on major lines all over the city. It might be appropriate to pursue that.
So what is SFMTA proposing?
SFMTA is not proposing anything. They want your help to figure it out.
We helped SFMTA lay out three alternatives to show some options. Each alternative has advantages and disadvantages. That’s why SFMTA doesn’t want to decide for themselves, without your help.
Once they have heard from you about your reactions to the alternatives, they’ll know better how to put together the early 2022 service. Then they’ll have a proposal, but that will happen later this year.
Does this affect the whole city?
No. There are six all-day route segments that used to run all day, but where all day hasn’t been restored yet. They are shown on this map:
This map shows the line segments not yet restored. Some of these segments are also served by other lines.
This map shows the areas closely affected by service changes in the Alternatives. This includes all areas within 3/4 mi of routes which differ between the Alternatives.
In an alternative that doesn’t restore these services, it makes sense to make other improvements that benefit the same general area.
So the alternatives we’re looking at mostly affect the same areas where these lines run. This is generally the northern and eastern part of the city
The rest of the city is important too, but Muni has already restored all of the 2019 all-day routes there. Next year, they’ll look at a larger expansion, and that will benefit the whole city.
Even now, SFMTA values the opinion of everyone in San Francisco, even if you don’t travel in the affected area, because a good public transit system benefits everyone, and it produce other benefits, such as reduced emissions and access to opportunity, that matter to many people in the city, even those who don’t ride themselves.
What are the alternatives?
The three alternatives illustrate different paths the agency might take:
- Familiar: This concept restores all of the all-day routes that existed before the pandemic.
- Frequent: This concept invests in frequency improvements and some new routing patterns to create a service pattern that helps people get to more places, sooner.
- Hybrid: A possible midpoint between Familiar and Frequent concepts.
What do the alternatives all have in common?
- They retain all-day service within ¼ mile of all stops that had all-day service before the pandemic. Nobody loses all access to service.
- They do not reduce or eliminate any services that are operating now.
- Except at rush hour, they do not eliminate any services that were running just before Covid-19.
In particular:
- 10 Townsend is restored in each scenario, but with different options in each scenario for what it does downtown.
- 43 Masonic is extended in each scenario, but with different options
- 28R 19th Avenue Rapid returns at a 10 minute frequency
What’s great about the Familiar Alternative?
It’s familiar! If you were riding Muni before the pandemic, this alternative puts back all of the all-day routes that you were used to. There are reasons to do this:
- It responds to public demands for service restoration that SFMTA has heard from some parts of the community.
- It helps riders who were using Muni before the pandemic return to their previous patterns of travel.
- For some people, it requires less walking than the other alternatives.
- It recognizes the long history of these lines, and the fact that the people have sometimes chosen where to live, or where to locate businesses, based on where they are.
- It requires relatively little effort to implement.
What’s great about the Frequent Alternative? Access!
The city’s travel patterns have changed and are still changing, so maybe Muni should just try to expand where people can go, so that they can do whatever they need to do. The Frequent concept does this more than any of the others. ![]()
This goal is called expanding access.
When we talk about access in this article, we mean your ability to go to more places so that you can do more things, in a limited amount of time. If we expand where you can get to in a reasonable amount of time, that means you have more options in your life: more places you could work, study, shop, play, run errands, and so on.
In this report, we’ll show you how various alternatives change what destinations you could reach in 30 minutes. Obviously, 30 minutes travel time is arbitrary but the results are similar if we use 45 minutes. The point is to show how many more useful places you can get to, in an amount of time you’re likely to have in your day.
You can read more about access, and how we measure it, here.
Why does access matter?
Expanding access to opportunities is a good thing in itself. It means people are more likely to be able to get to the things they need. For many people, for example, transportation can sometimes be a barrier to holding a job or going to school, so improving access reduces these barriers.
But when we expand access, we also get a lot of benefits that meet goals that are important to the people of San Francisco, and to SFMTA.
- The service is more likely to be useful to new riders or even existing riders wanting to make different trips than they made before. For example, if you look up how to make a trip to a new destination, you’re more likely to find that the travel time is reasonable.
- Because the service becomes more useful, the long-term ridership potential is higher, which helps address SF’s goals around congestion, livability, and reducing emissions that cause climate change.
- Access is also part of freedom. If people can do more things using Muni, they gain more options in their lives.
- Expanding access also means that many existing riders will have faster trips.
How much do the alternatives expand access?
In a travel time of 30 minutes, the average San Franciscan can get to about:
- 4000 more jobs or educational opportunities in the Frequent alternative.
- 1000 more jobs and opportunities in the Hybrid alternative.
In 45 minutes, the average San Franciscan can get to about:
- 9000 more jobs or educational opportunities in the Frequent alternative
- 2500 more jobs and opportunities in the Hybrid alternative.
Both of these are comparisons to the Familiar alternative.
Your own access is especially likely to get better if you live near one of the all-day bus lines that has not been restored.
In part 3, there’s a lot more information about how your access might change, depending on:
- where you start your trip from
- what kind of destination you need to go to (jobs, medical, groceries, etc.)
Does everyone get more access?
No, with the money they have, SFMTA can’t make access better for everyone, but they can make it better for most people. In this report we’ll show you how the alternatives affect your access to destinations, based on:
… where you live
… what kind of destination you might be going to (jobs, schools, food, medical, etc)
We’ll also show you how the access changes, on average, for everyone, and for various groups of equity concern (low-income residents, senior citizens, and each of the major racial groups).
How do we calculate access?
In this report, we figure out how many destinations you can get to from each point in the city in a fixed amount of time, such as 30 or 45 minutes. Then we show how the different alternatives make that better or worse. You’ll see maps of these results showing, for every point, whether the number of destinations you can reach in a fixed amount of time has gotten better or worse.
When we figure how far you can go in that time, we count all three parts of travel time: the walk, the wait, and the ride. The wait includes waiting to transfer, if you need to do that.
To do this, we have to make an assumption about how fast people can walk or roll. Everyone’s speed is different. We’ve assumed 2.5 mph, but the vast majority of people, even many senior citizens, are faster than that. Many transportation studies assume that people walk or roll 3 mph, but we’re accounting for San Francisco’s hills and some time for crossing the street. For comparison, the top speed of a motorized wheelchair is typically about 5 mph.
So if you walk or roll faster than 2.5 mph your access will be better than what you’ve calculated. If you go more slowly, it may be worse.
How does the Frequent Alternative Expand Access? The Five-Minute Network
To expand access, the Frequent Alternative focuses on increasing frequencies, so that you spend less time waiting for the next bus. In particular, this alternative expands the Five-Minute Network, which consists of major lines extending across the city that are scheduled to come every 5 minutes, all day, seven days a week. As always, you can click this image to enlarge it!
 Because frequency requires concentrating service, there is a tradeoff between running major lines frequently and running all the lines we used to run. In general, the Frequent Alternative asks some people to walk further (almost always less than ¼ mile) to frequent service. As you’ll see, many of these people get where they’re going just as soon.
How many people benefit from the Frequent Network in each alternative? We explain that at the end of Part 3.
Sounds like you already like the Frequent Alternative …
You may have noticed that we talk a lot more about the Frequent Alternative than we do about the Familiar Alternative. So it may seem to you that we like the Frequent Alternative more.
But the reason we’re talking so much about the Frequent Alternative is different: It’s new, so it needs to be explained. The Familiar Alternative doesn’t need much explaining because it’s a pattern of service people already know.
So we aren’t trying to “sell” you the Frequent Alternative, but we do want you to understand it.
2. The Alternatives
Now, let’s look at the details of the alternatives, and how they’re different in each part of the city.
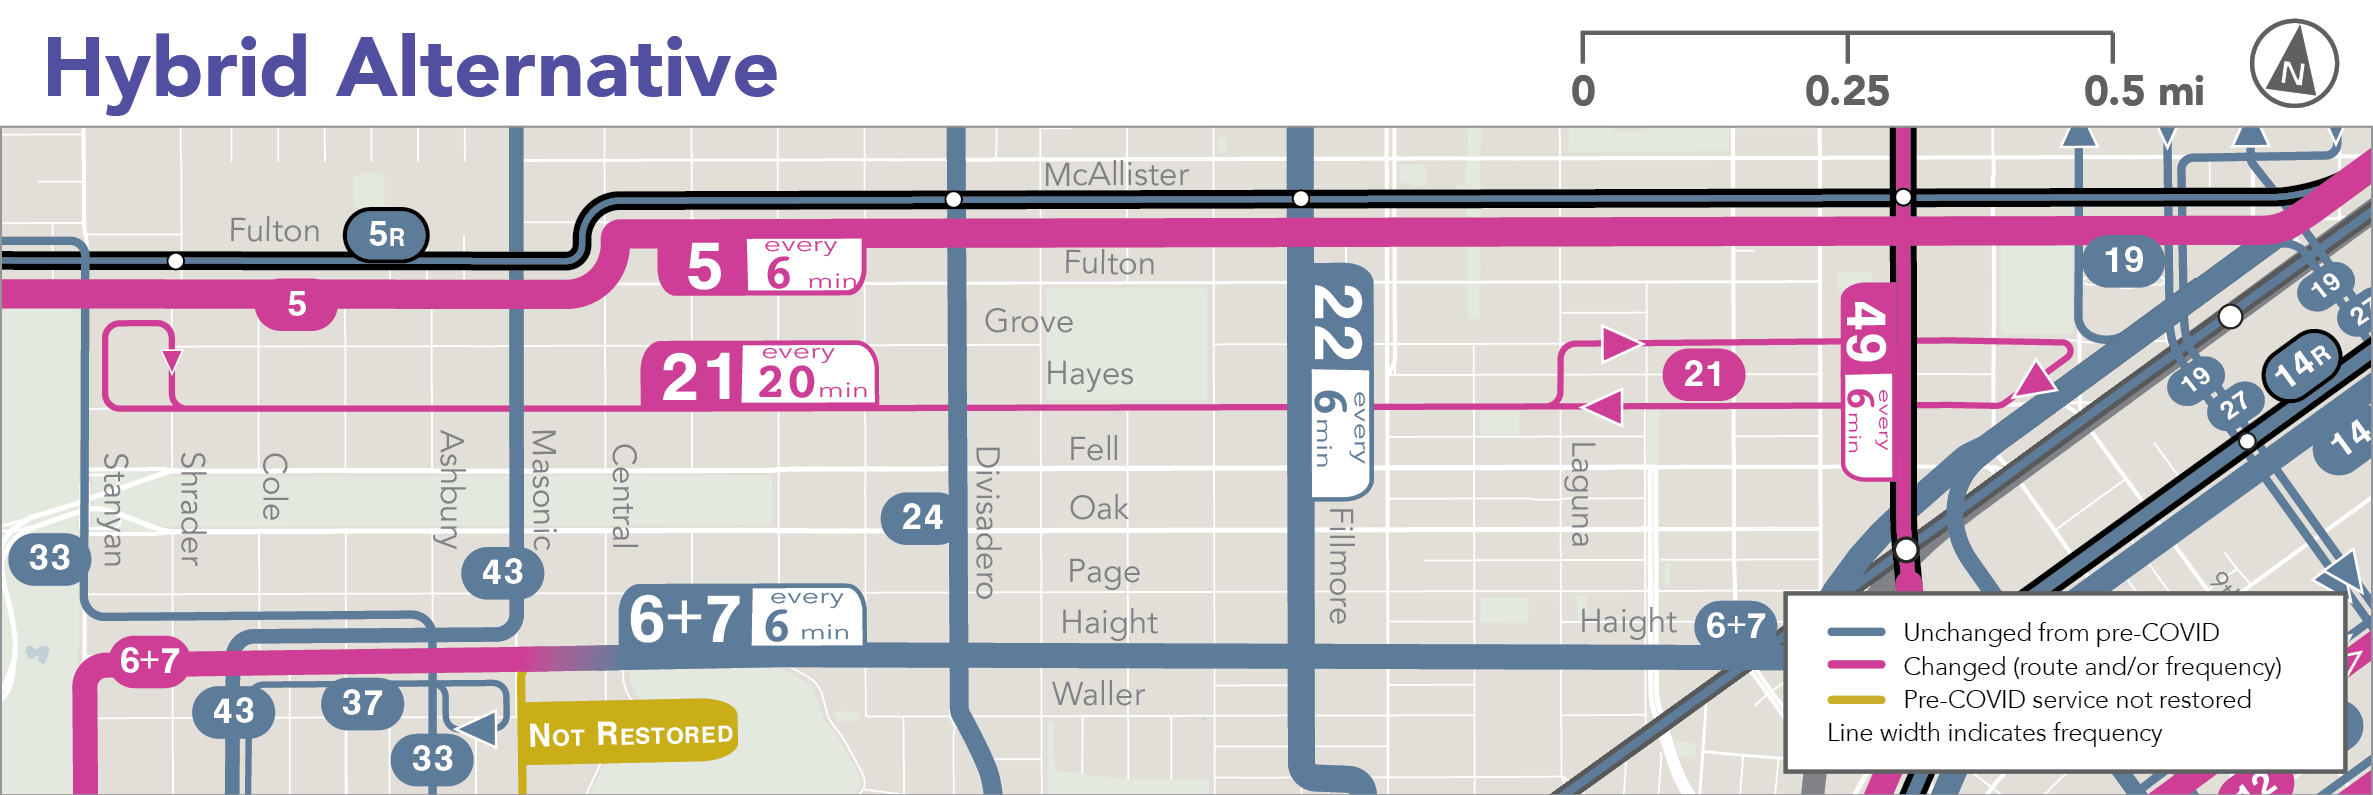
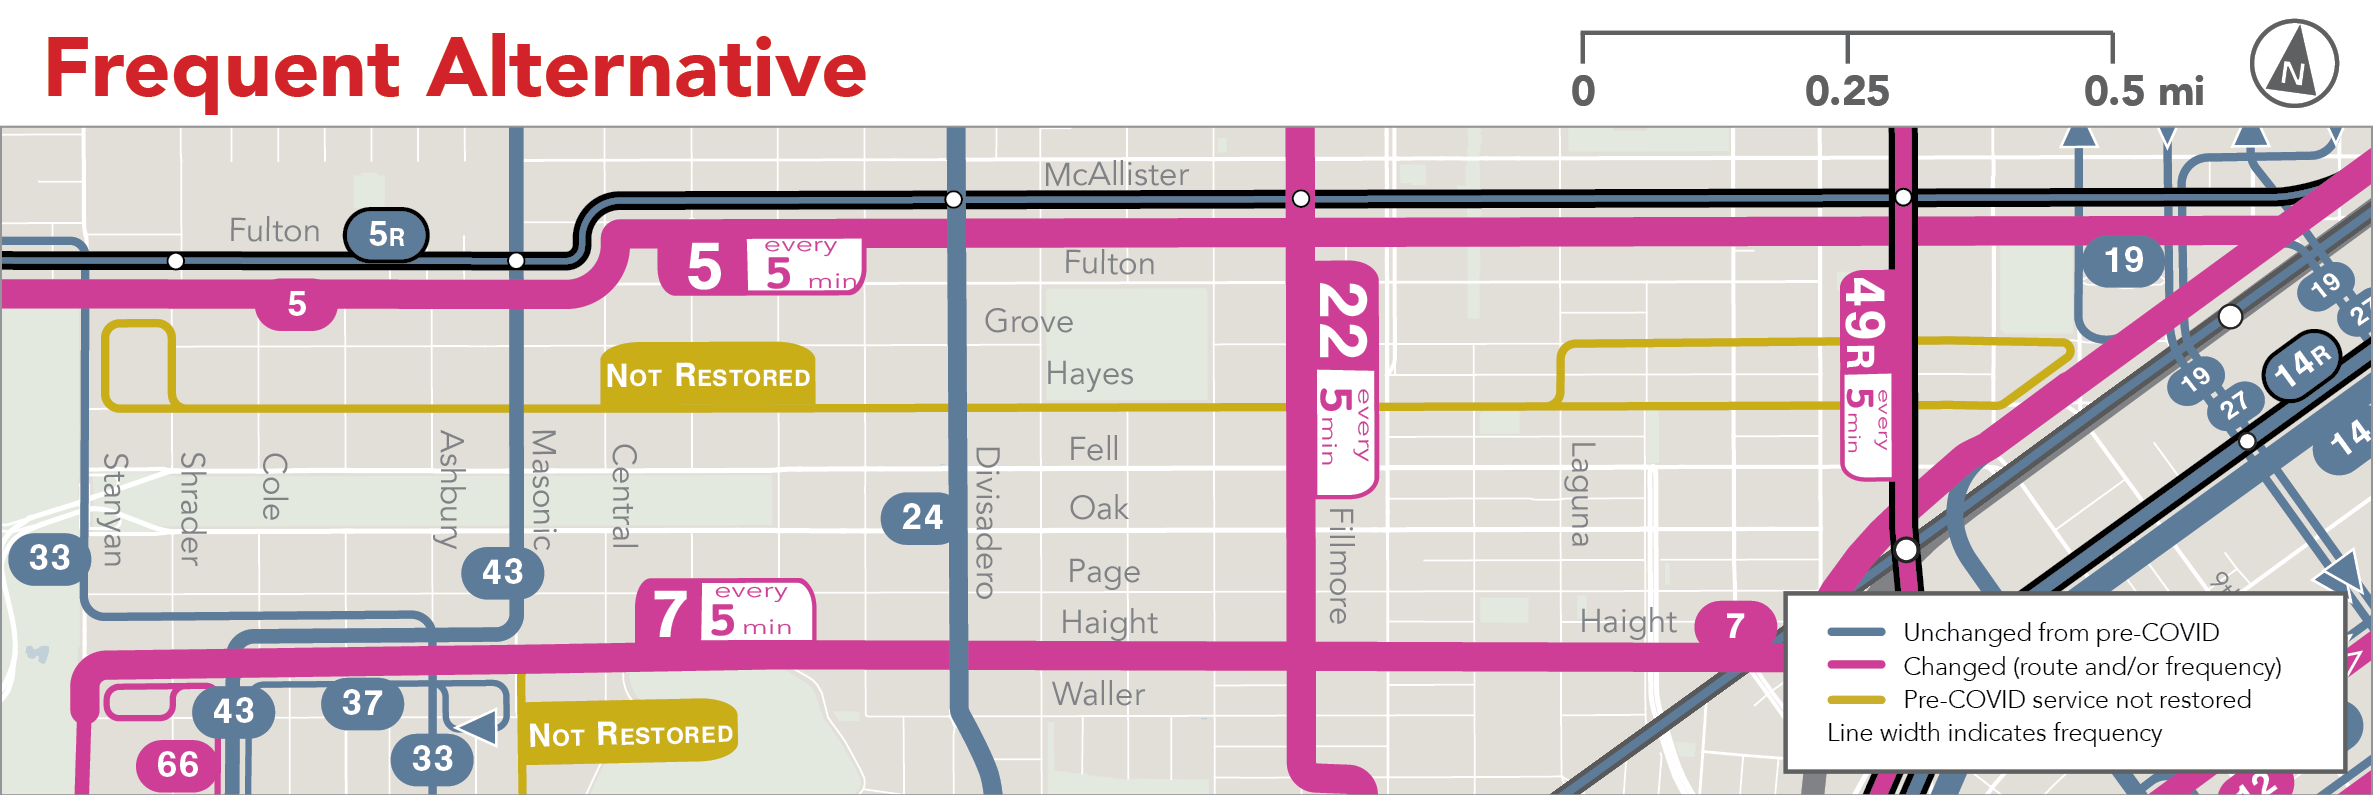
Hayes Valley, the Haight, Western Addition (Lines 5, 6, 7, 21)
So far, Muni has not restored Line 21 Hayes. That’s because 21 Hayes is just ¼ mile from more frequent service on both Haight (Lines 6 and 7) and McAllister (Line 5 Fulton).
Should Muni restore the 21 Hayes as it was? Here are three options:
| Familiar Alt. | Hybrid Alt. | Frequent Alt. | |
| 21 Hayes | Restored as it was, every 12 minutes. | Restored as it was from Stanyan to Civic Center, but does not continue down Market beyond Civic Center. Every 15 min. | Not restored. See Lines 5 and 7 below. |
| 5 Fulton (local) | Every 10 minutes | Increased to every 6 minutes | Increased to every 5 minutes |
| 5R Fulton Rapid | Every 10 minutes | Every 10 minutes | Every 10 minutes |
| 7 Haight (including 6 Parnassus) | Line 6 Parnassus restored. West of Ashbury, Haight has service every 12 minutes (Line 7) East of Ashbury, Haight has service every 6 min (Lines 6 and 7 combined) | Service on all of Haight increased to every 6 minutes. (Lines 6 and 7 combined)Line 6 stays on Haight west to Stanyan, instead of turning off at Ashbury. [see next section] | Service along all of Haight increased to every 5 minutes. This service is provided by 7 Haight only The 6 Parnassus is removed. [see next section for details south of Haight] |
| 22 Fillmore | No change (every 6 minutes) | No change (every 6 minutes) | Increased to every 5 minutes. |
How do the Hybrid and Frequent alternatives change where you could get to in 30 minutes, compared to the Familiar alternative? This table shows the average increase for the area of the map, and also for three locations within the area. Negative numbers indicate a decrease.

What are the tradeoffs here?
- Reducing or eliminating the 21 Hayes creates the resources to improve the 5 Fulton and 7 Haight, helping to build the Five Minute Network.
- In that case, you’re right on Hayes, it’s a walk of 3-4 blocks to the 5 or 7.
- Of course, this part of the City is hilly, so walks to or from the 5 or 7 may be uphill.. That might be one reason not to like the Frequent Alternative here.
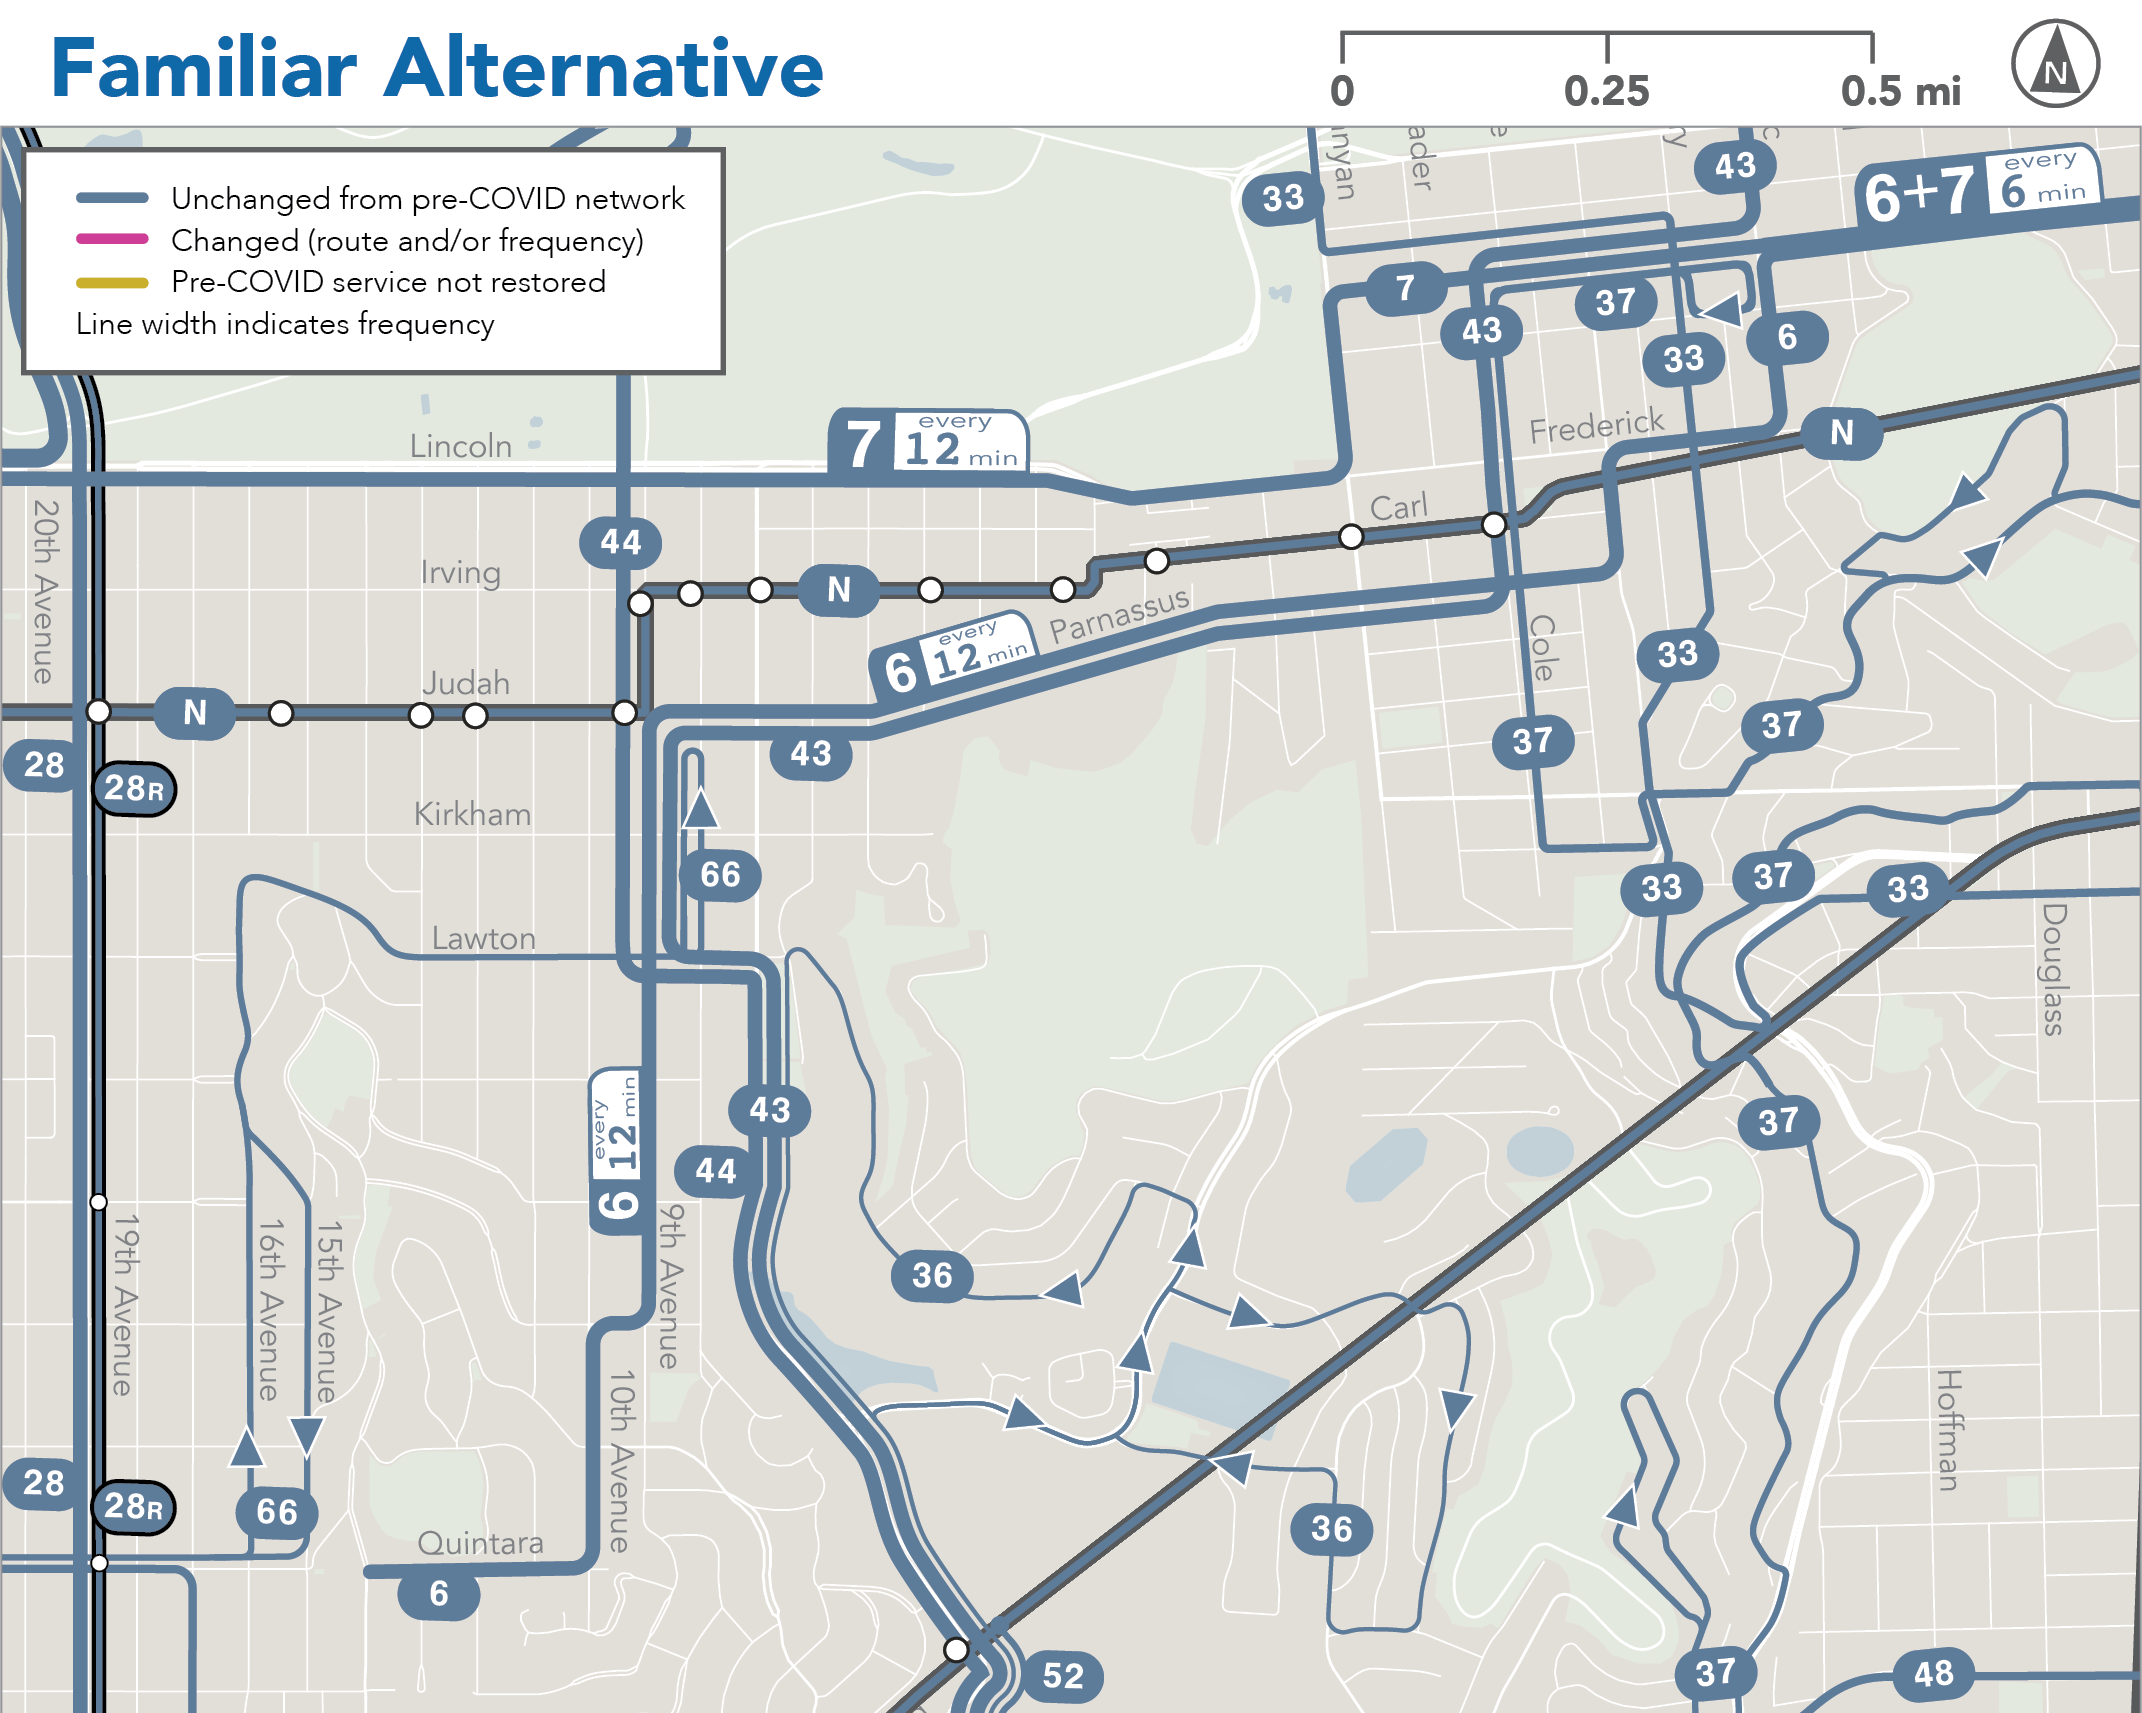
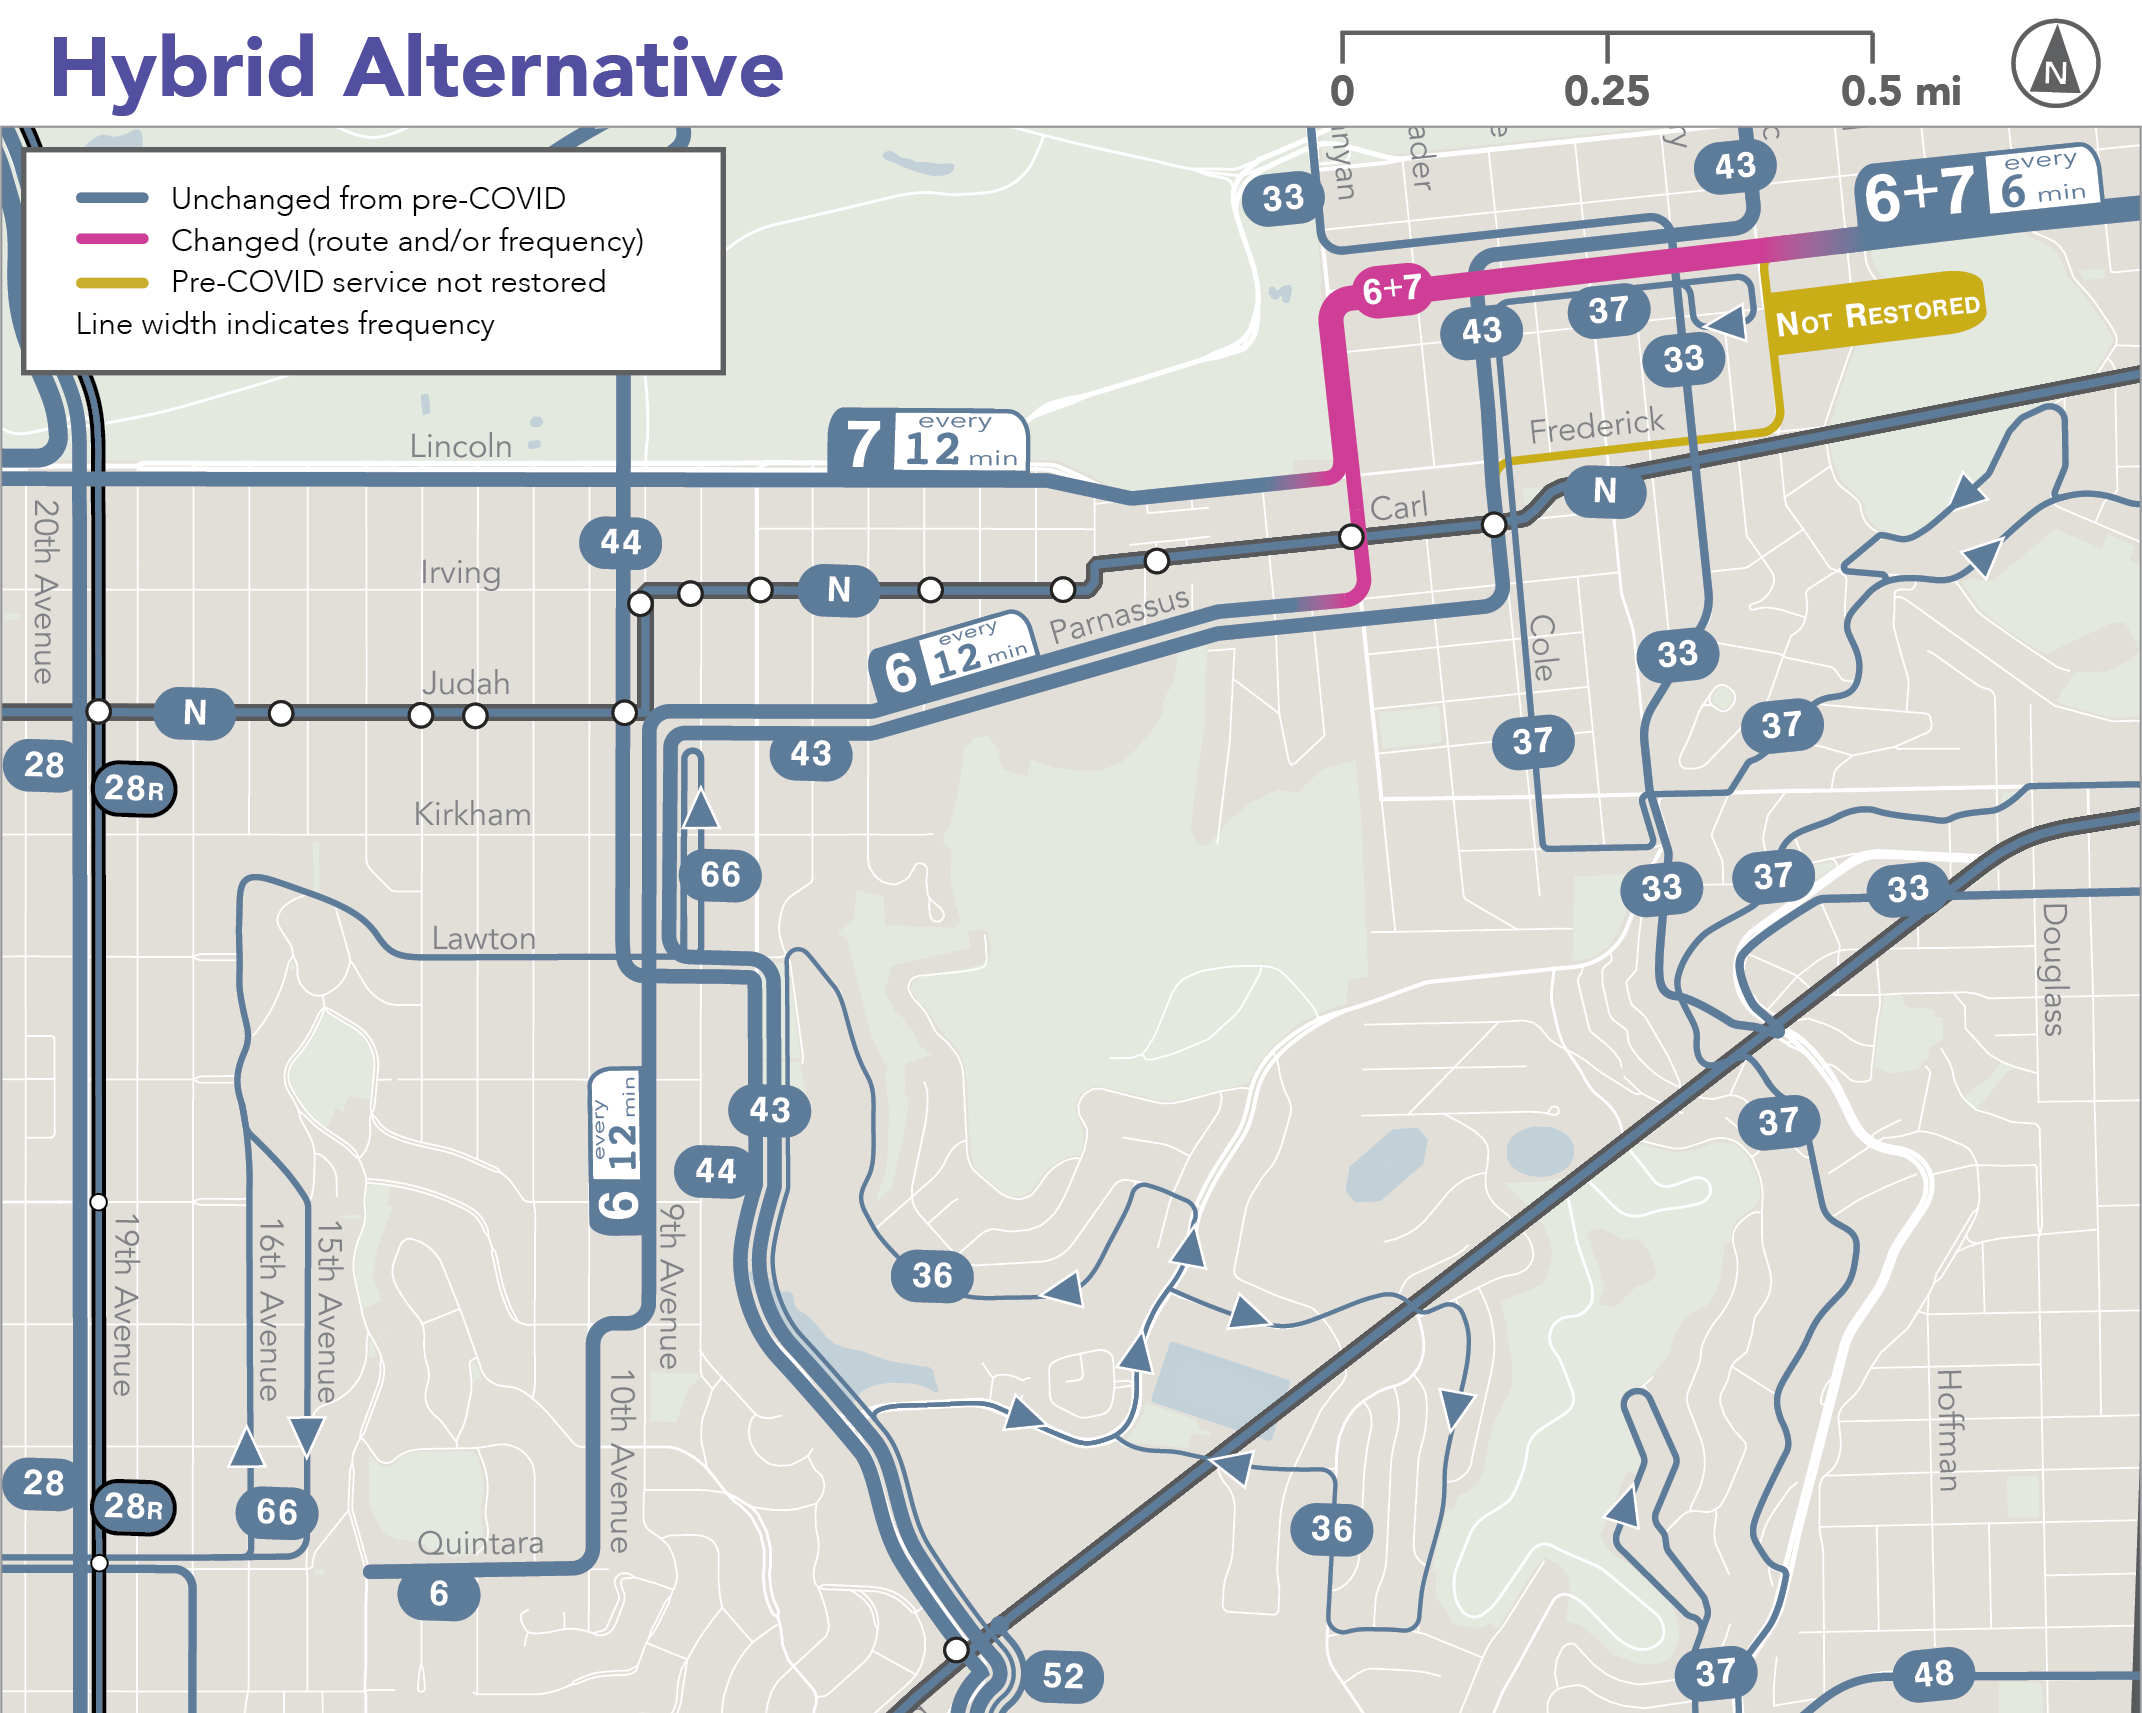
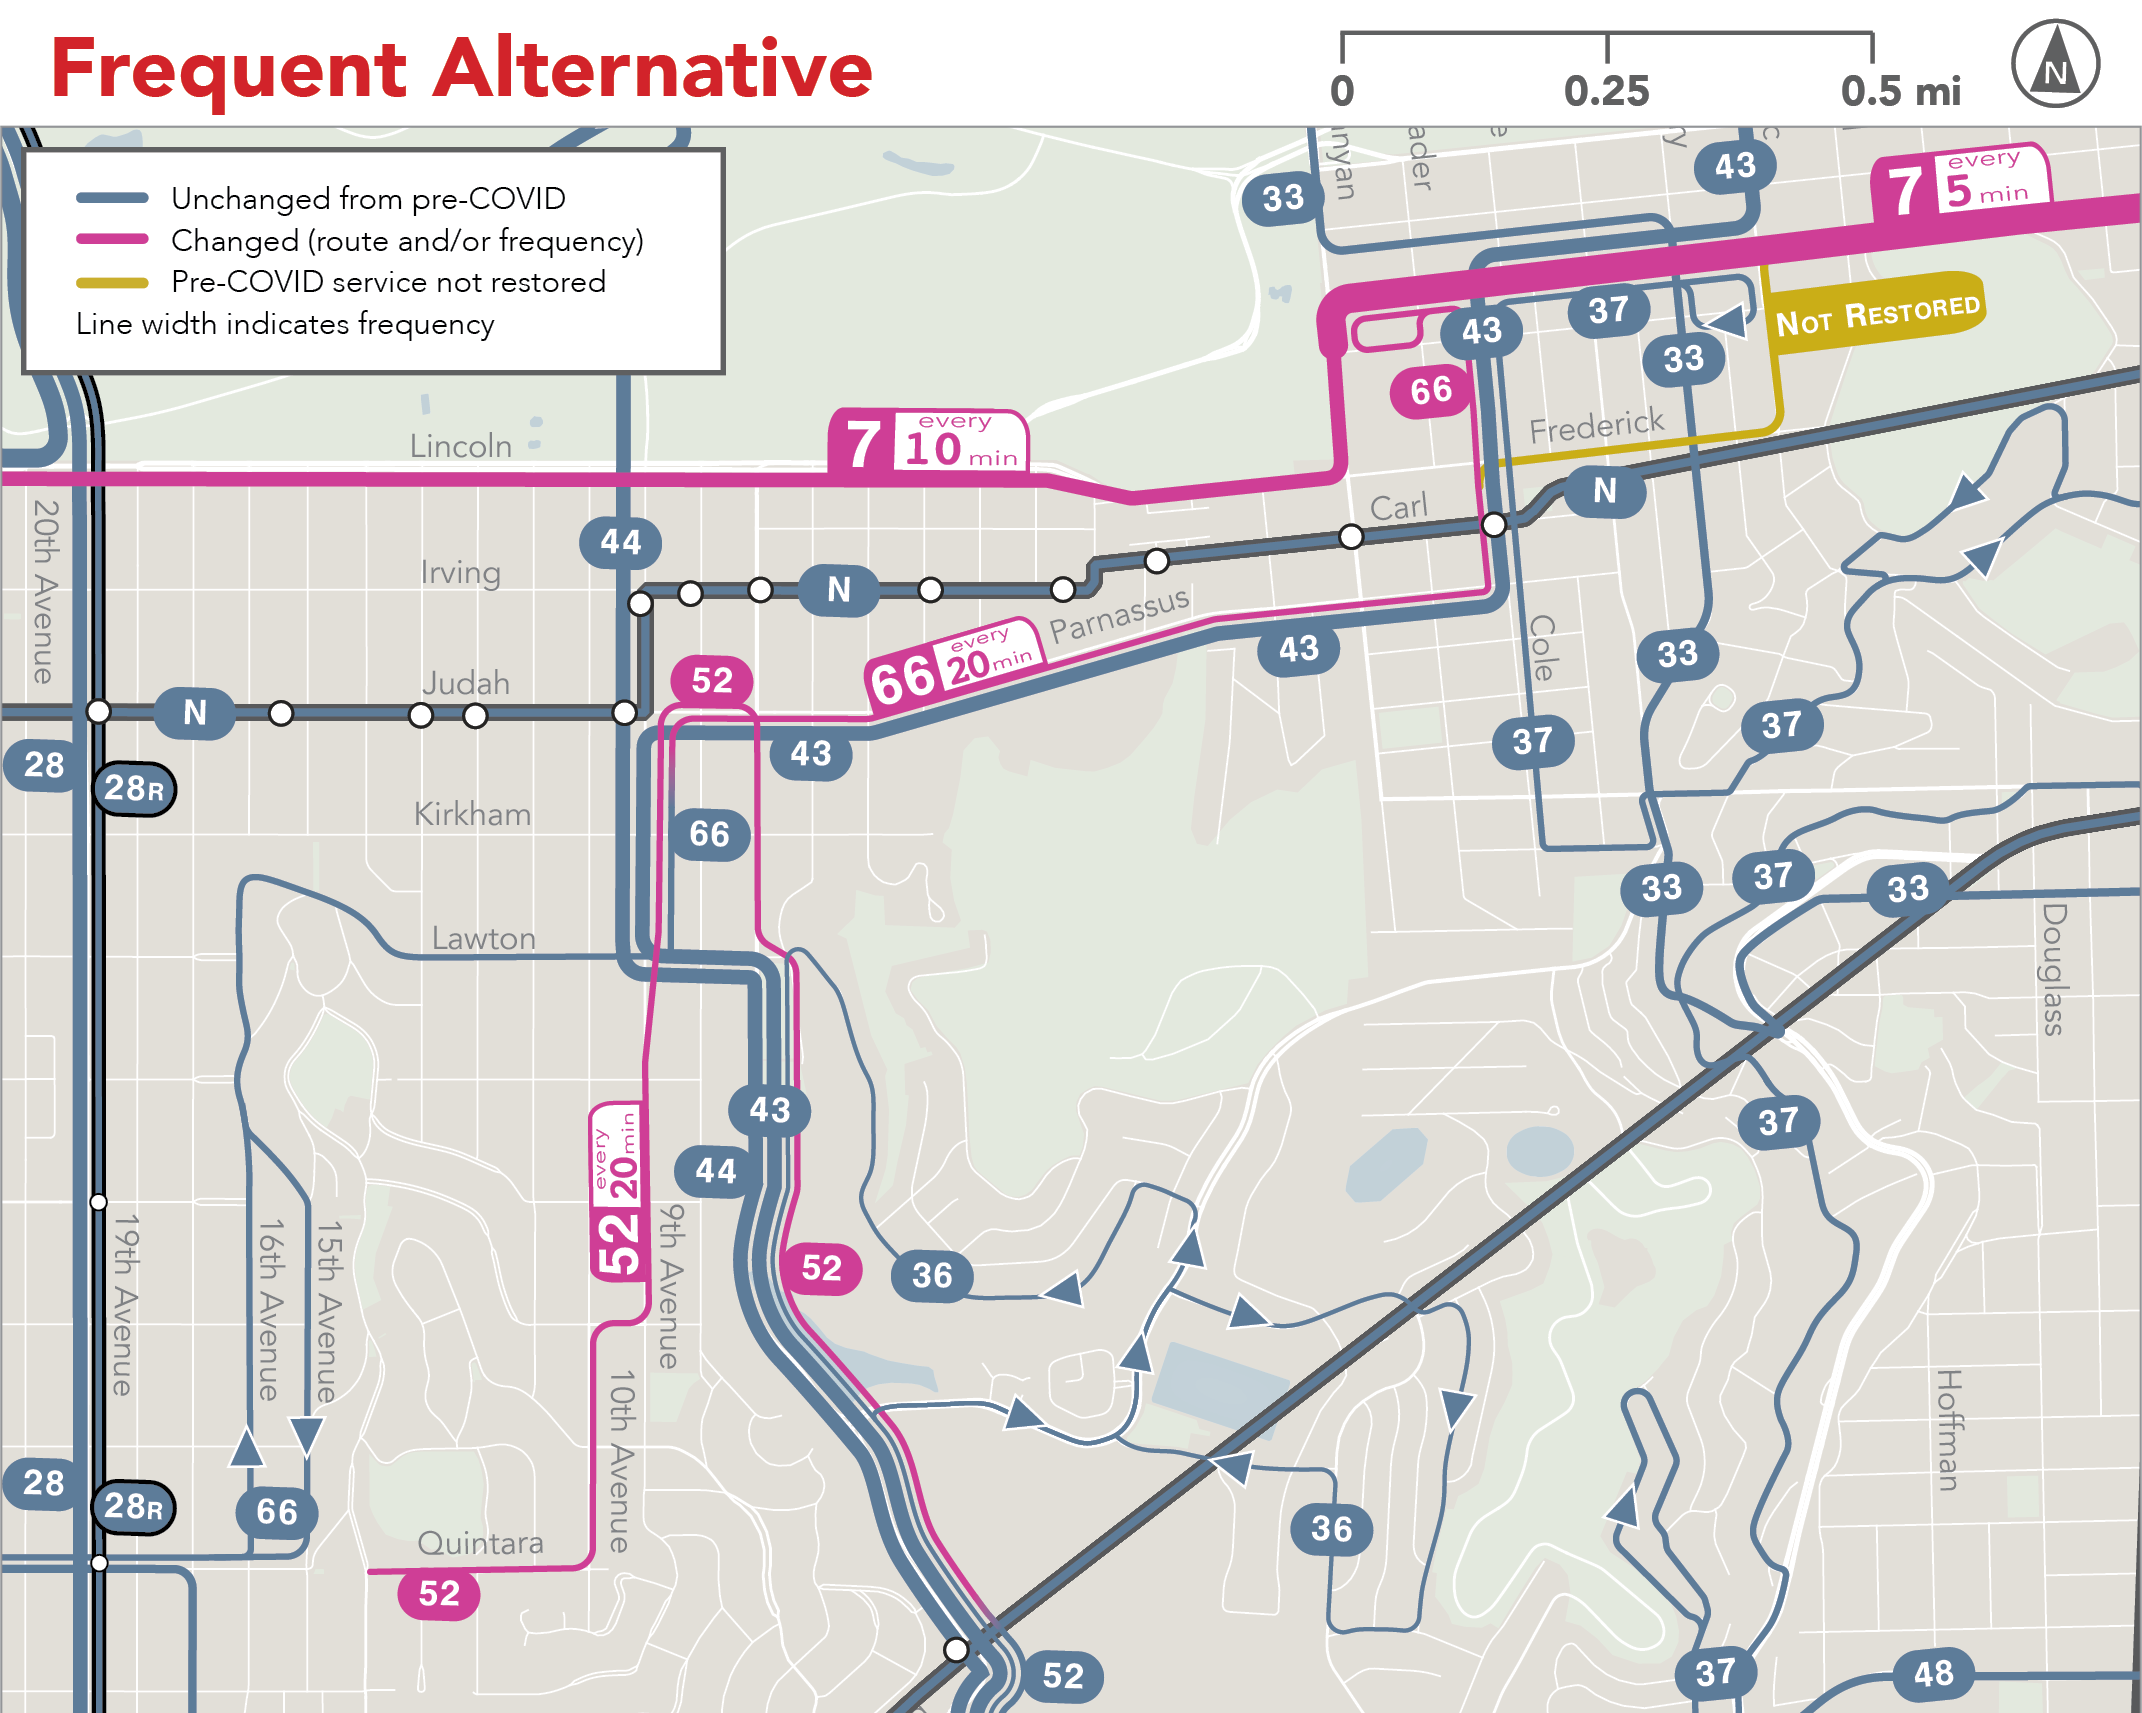
The Haight, Parnassus, Golden Gate Heights (Lines 6, 7, 52, 66)
Muni has not yet restored Line 6 Parnassus. Instead, during the pandemic, they have replaced parts of that line with extensions of Line 52 and 66, while keeping Line 7 to cover Haight St.
The 6 Parnassus has always had very uneven ridership. It’s often busy along Haight Street, around UCSF, and at 9th & Irving but ridership has always been much lower in Golden Gate Heights and Ashbury Heights. That’s understandable. Those neighborhoods are not as dense with housing and destinations, and the steep hills reduce the area where people can walk easily to the bus.
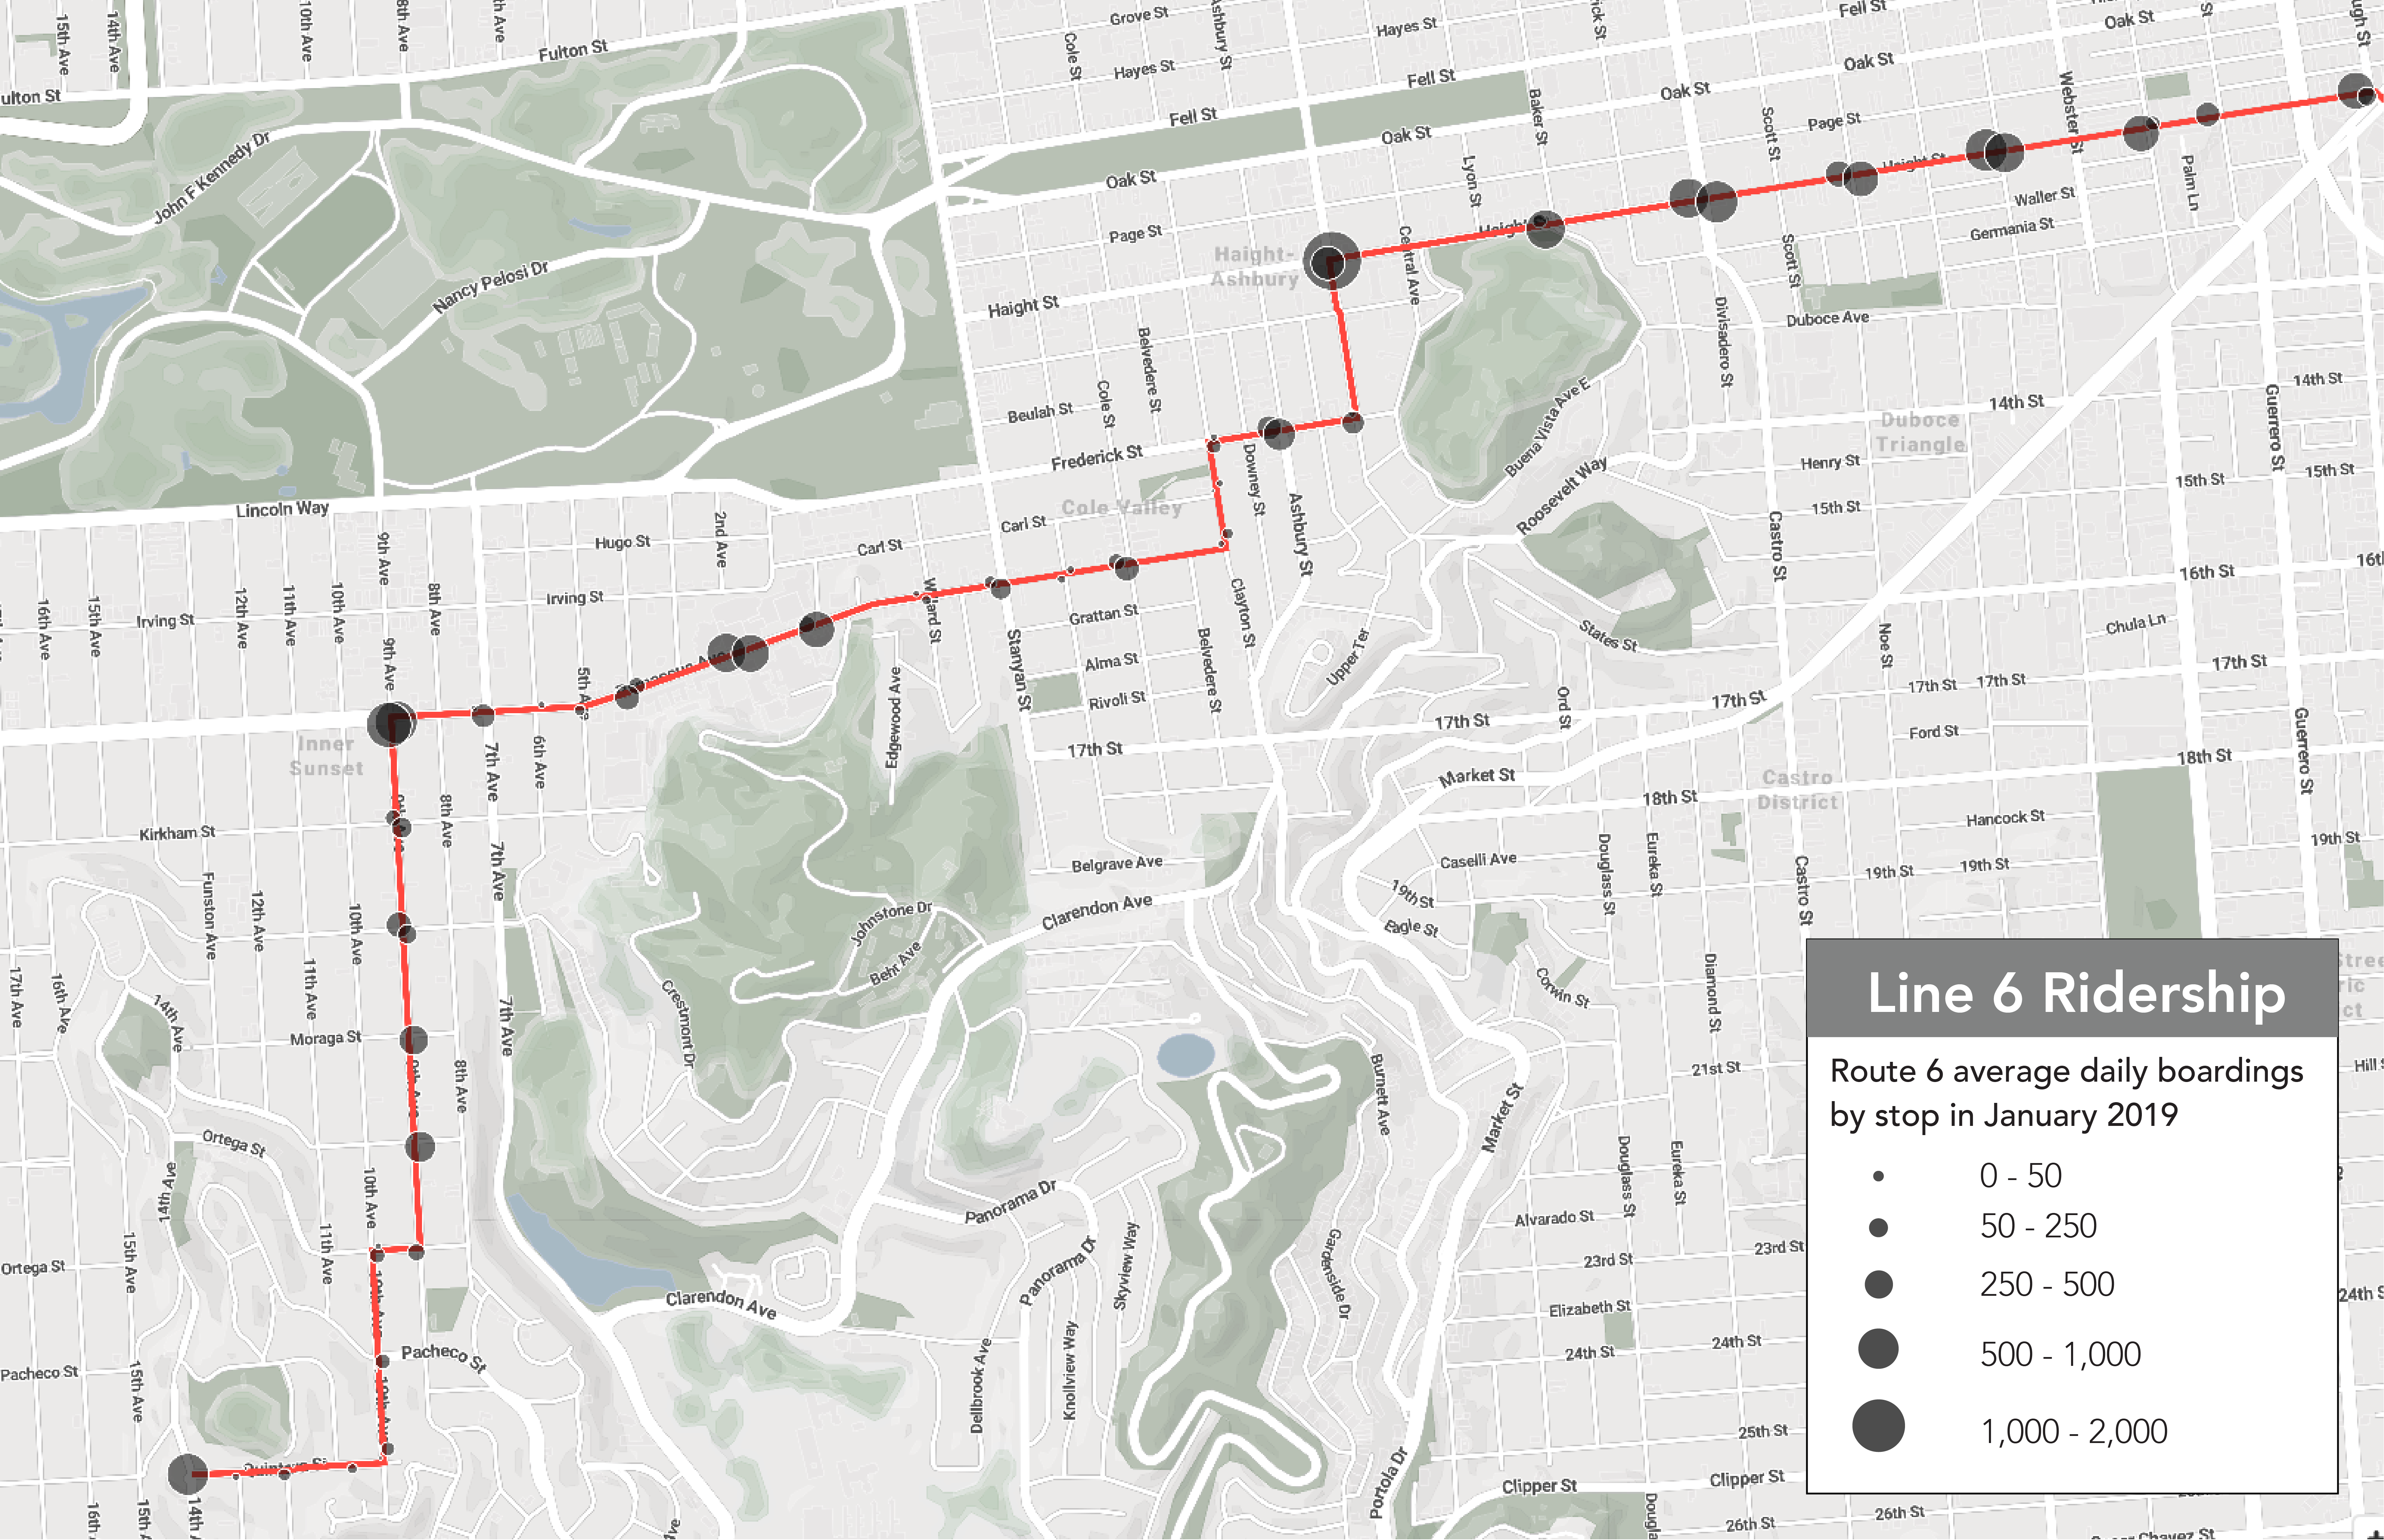
Map: Line 6 Ridership in 2019
Even at UCSF you can see that ridership is lower than you’d expect for such a big destination, but that’s because many people walk to the N Judah, which is only a block away. Likewise, not many people use this bus in Cole Valley, where it’s also right next to the N Judah.
So it might make sense to serve the parts of this line differently:
- Demand is very high all along Haight so it’s important to have frequent service there, all the way to Stanyan. The Haight business district has always had inadequate frequency because half of the Haight Street bus service has always turned off at Masonic.
- Ashbury Heights is also covered by the 33 Stanyan and its low ridership on the 6 Parnassus may not justify the service there.
- 6 Parnassus riders who are within walking distance of the N could use the N for a faster trip downtown.
- We could continue to cover Golden Gate Heights with a local service, such as the current Line 52 that connects it to Muni Metro at Forest Hill.
So here are some options:
| Familiar Alt. | Hybrid Alt. | Frequent Alt. | |
| 6 Parnassus and 7 Haight | Line 6 Parnassus restored. West of Masonic, Haight has service every 12 minutes (Line 7) East of Masonic, Haight has service every 6 min (Lines 6 and 7 combined) | Line 6 stays on Haight west to Stanyan, instead of turning off at Masonic. [see next section] This provides service every 6 minutes on the entire length of Haight, ending at Stanyan instead of Masonic. | Service along all of Haight increased to every 5 minutes. This service is provided by 7 Haight only. |
| 52 Excelsior | Ends at Forest Hill, as it did before Covid. | Ends at Forest Hill, as it did before Covid. | No change from Current Service |
| 66 Quintara – Parnassus | Ends at Forest Hill, as it did before Covid. | Ends at Forest Hill, as it did before Covid. | No change from Current Service |
Here’s how that looks on a map. As always, click the image to enlarge!
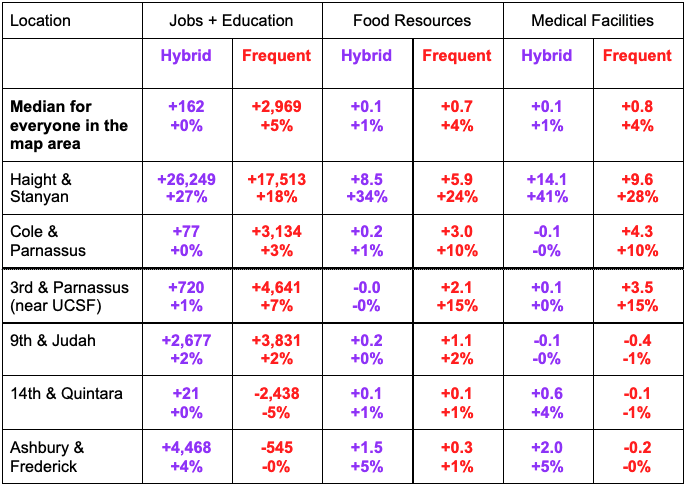
 How do the Hybrid and Frequent alternatives change where you could get to in 30 minutes, compared to the Familiar alternative? This table shows the average increase for the area of the map, and also for three locations within the area. Negative numbers indicate a decrease.
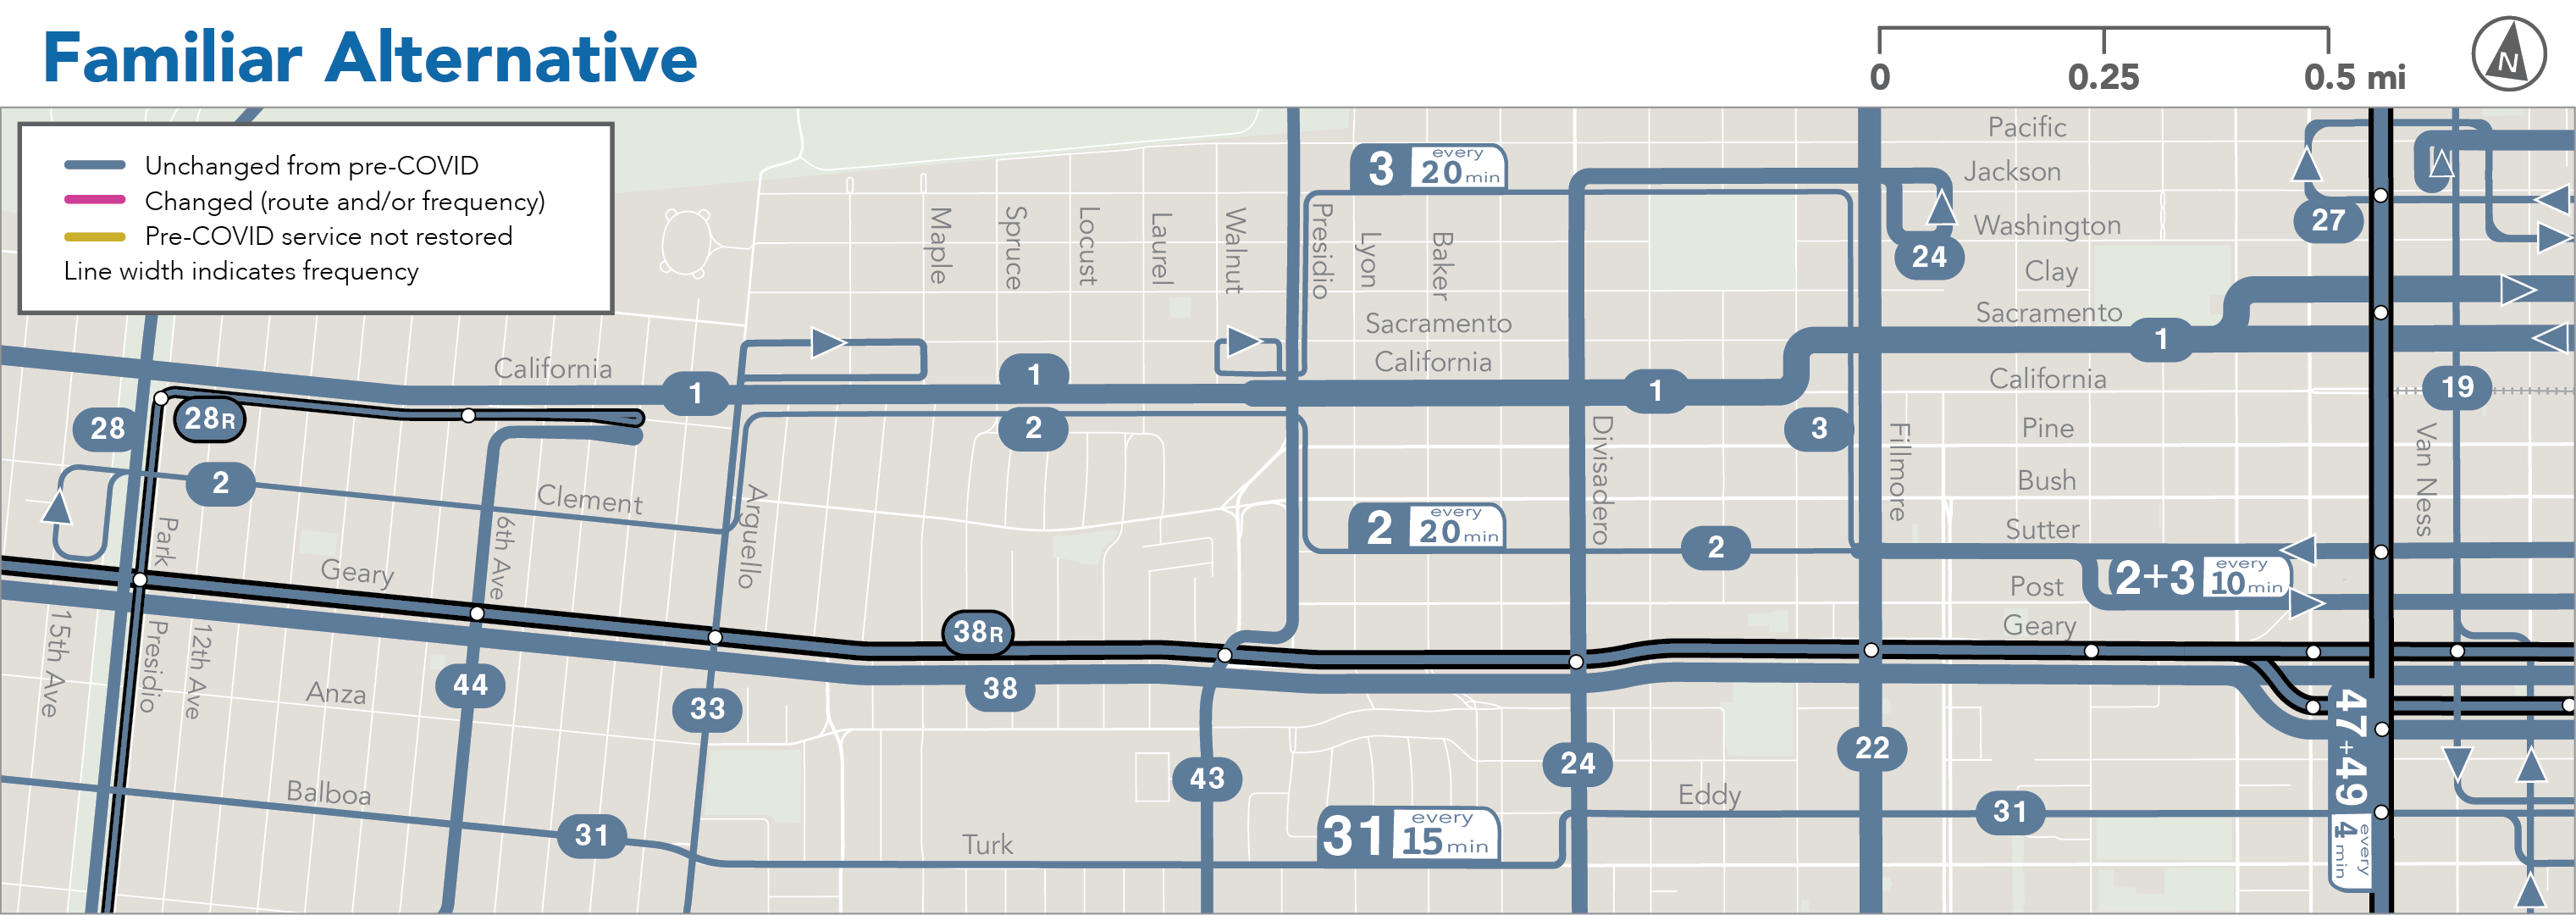
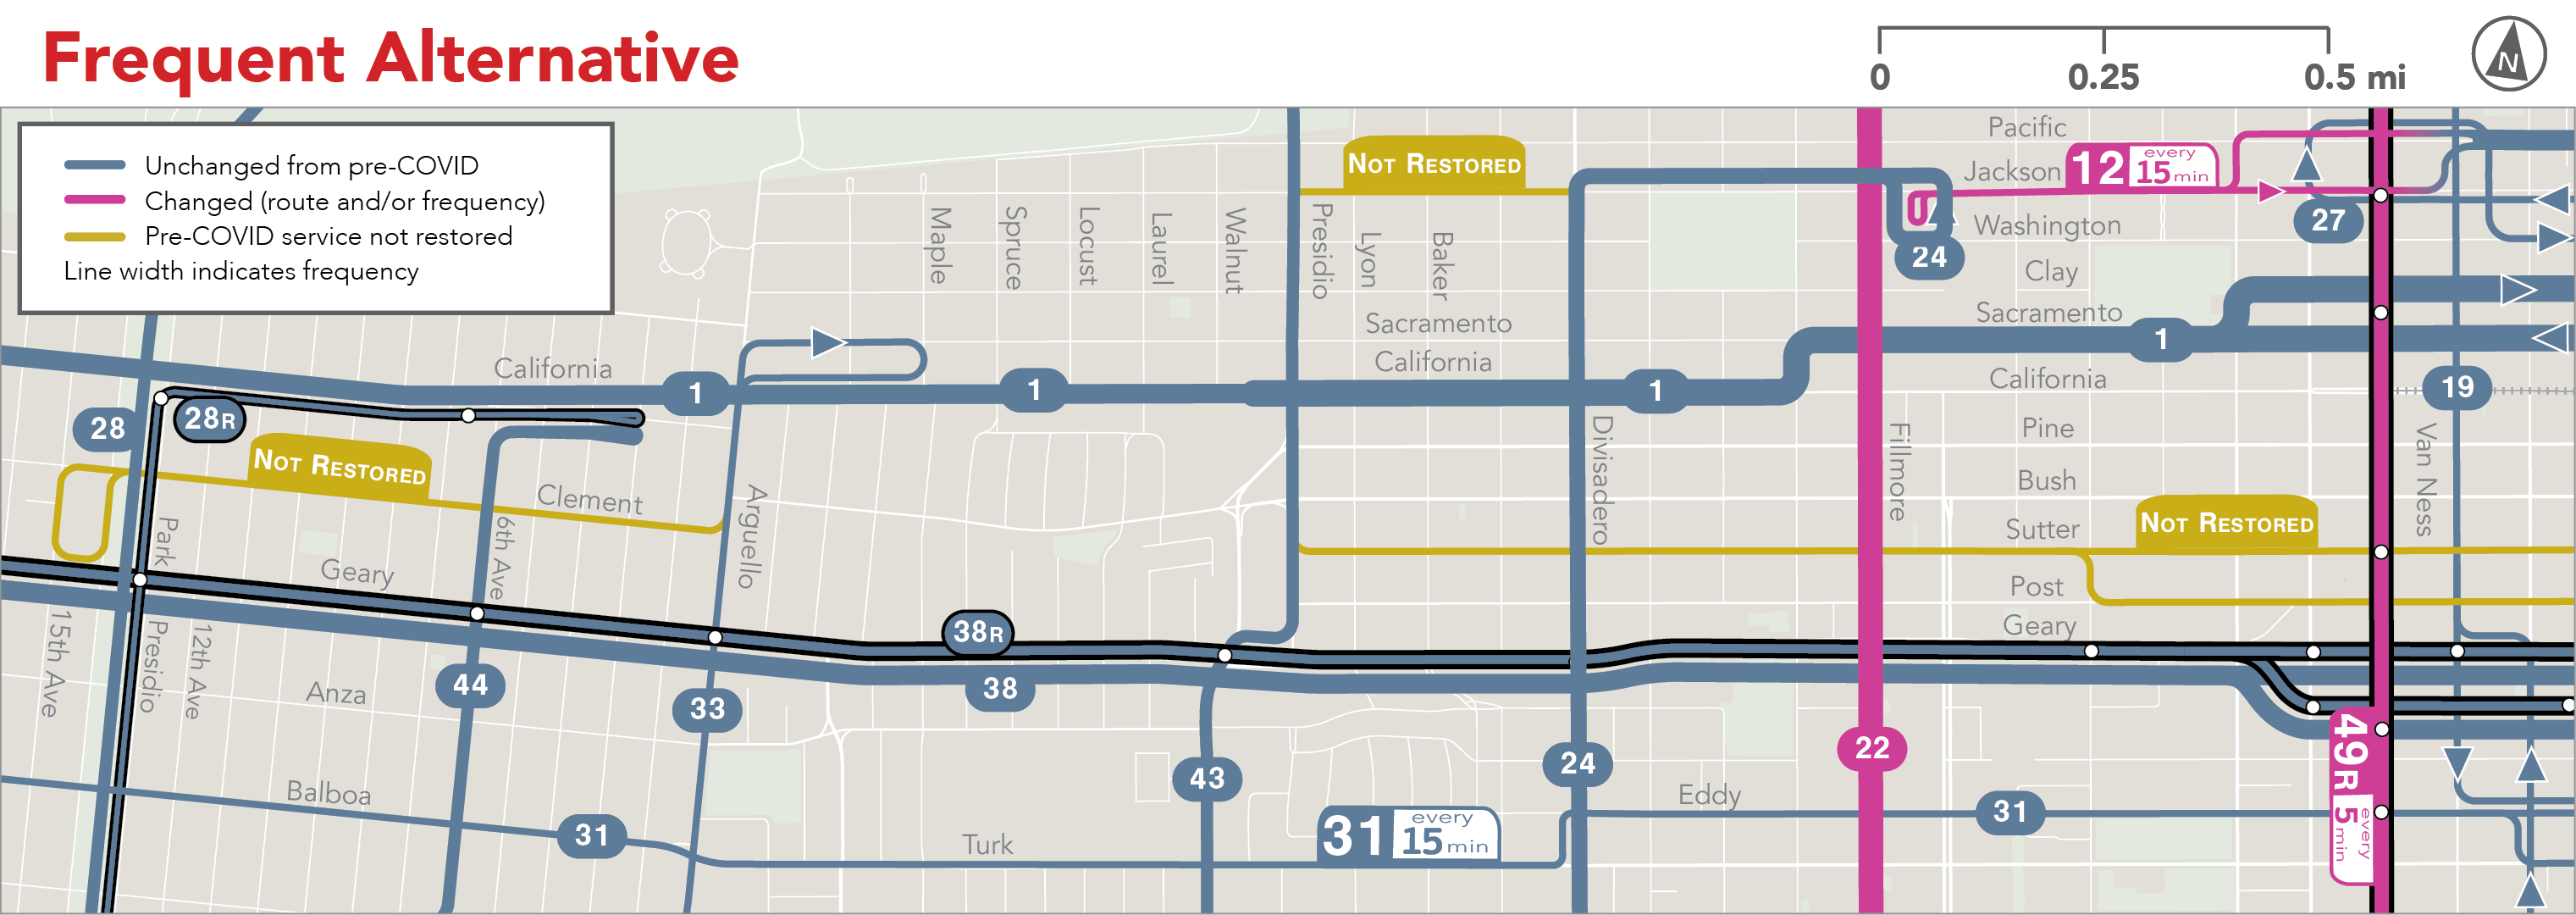
Post, Sutter, Clement, and Jackson Streets (Lines 2, 3, 12)
Should Muni restore Lines 2 Sutter/Clement and 3 Jackson?
In the Richmond District, east-west lines are now spaced every ¼ mile (on California, Geary, Balboa, and Fulton). Is it also necessary to serve Clement, which is just ⅛ mile from the very frequent service on both California and Geary, or are there better ways to use this resource? Clement is a business district, so it’s an important destination, but the whole network is already built on the assumption that ⅛ mile is a very short walk to transit. What’s the right thing to do here?
In Pacific Heights, Line 3 along Jackson St has always had very low ridership west of Is that segment important to keep? Could it be served different way?
Finally, how much service does Sutter St need? It’s only two blocks from frequent service on Geary, and 3-4 blocks from frequent service on California.
All of these services are important to people who were accustomed to them, but when there are so many urgent needs across the city, should these services be the priority? Would it be better to have lines a little further apart so that frequencies be higher?
Here are some options to help us think about this.
| Familiar Alt. | Hybrid Alt. | Frequent Alt. | |
| 2 Sutter / Clement | Restored, every 20 min west of Fillmore. East of Fillmore, service every 10 minutes (Lines 2 and 3 combined.) | 2 (trolley) every 15 min from downtown to Presidio & California | Not restored |
| 3 Jackson | Restored, every 20 min. See above. | Not restored | Not restored |
| 12 Folsom – Pacific | No service west of Van Ness. | Extended west from Van Ness along Pacific and Jackson, to end at Presidio & California, every 15 minutes. | Extended west along Pacific to Fillmore & Jackson only, every 15 minutes. |
| 22 Fillmore | No Change (every 6 min) | No Change (every 6 min) | Increased to every 5 min |

How do the Hybrid and Frequent alternatives change where you could get to in 30 minutes, compared to the Familiar alternative? This table shows the average increase for the area of the map, and also for three locations within the area. Negative numbers indicate a decrease.
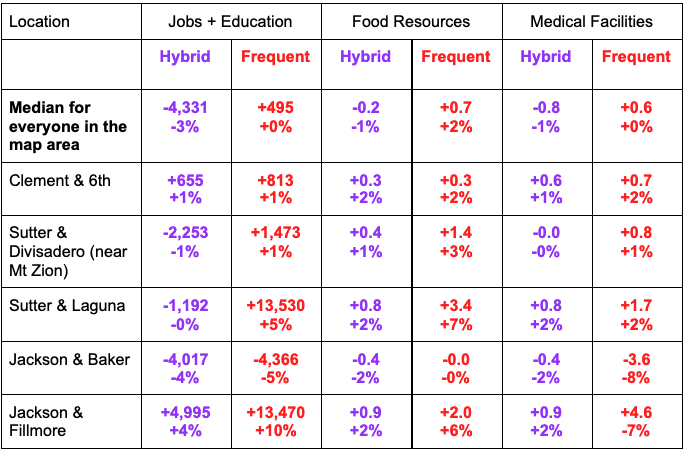
Number of new destinations reachable in 30 minutes, for the whole area and for selected points. Negative numbers indicate a loss in access.
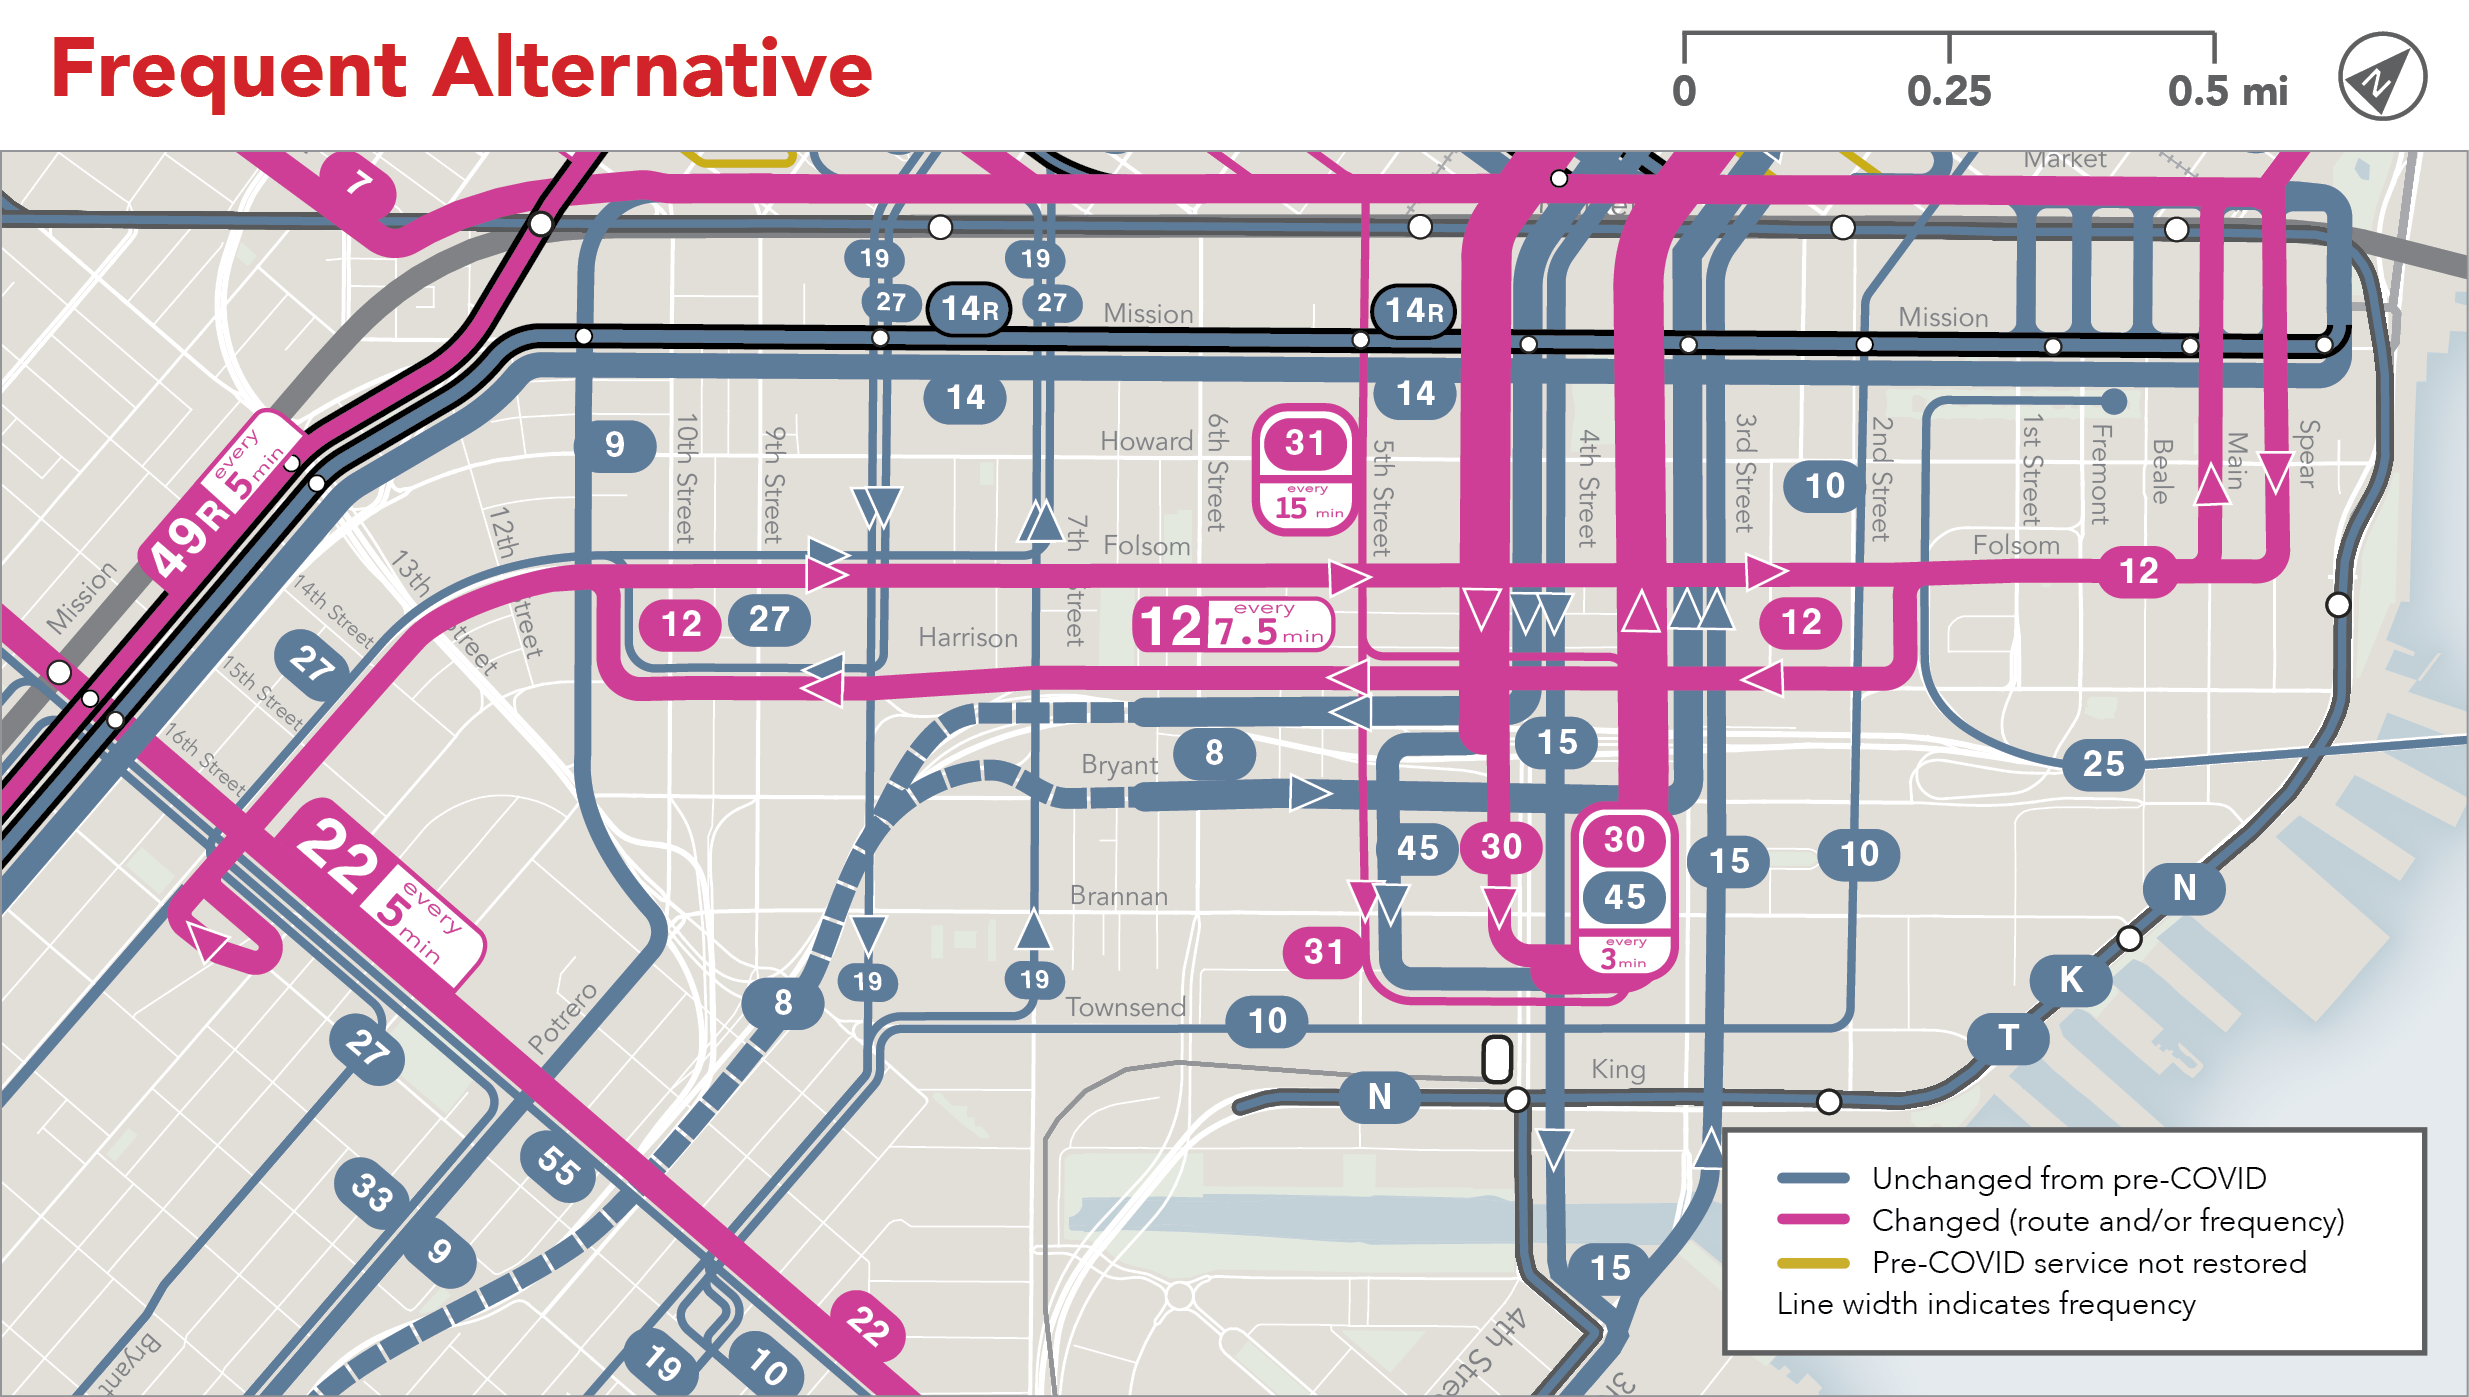
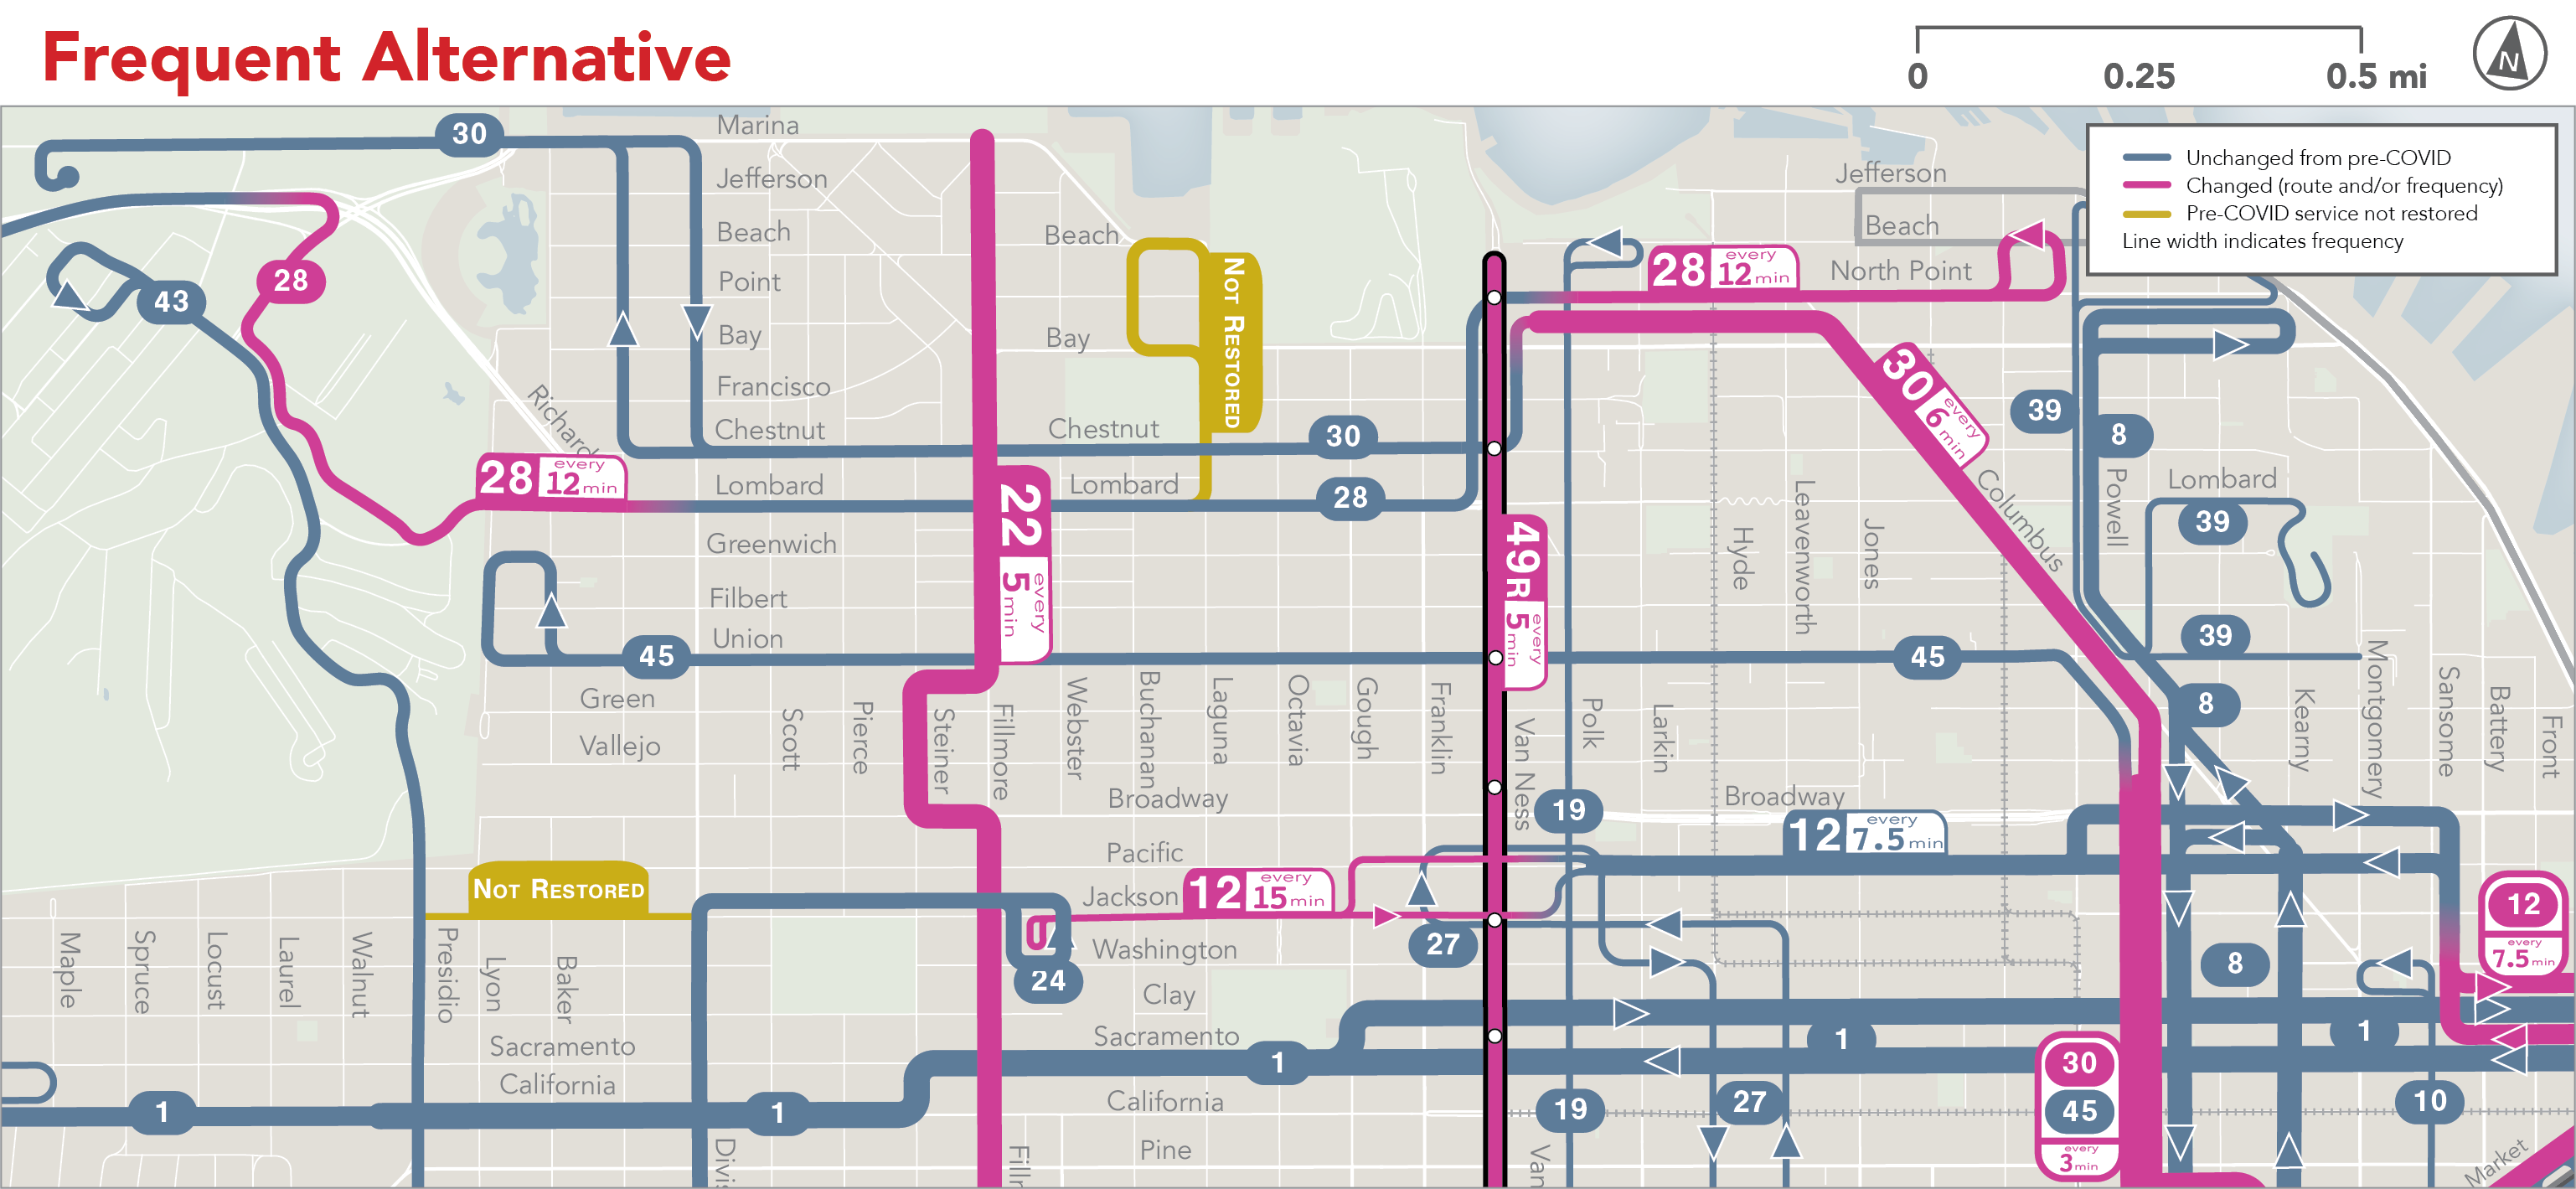
South of Market, Market St., Financial District (Lines 47, 49, 28, 10/12, 30)
In this area we have three questions:
- Is Line 47, which ran the length of Van Ness and then continued across SOMA to Caltrain, still a good way to provide lots of useful service? Would it be better if there were more frequency on 49 Van Ness / Mission and then a different pattern of frequent service in SOMA?
- Are there ways to organize lines 10 Townsend and 12 Folsom to provide more useful service, especially along Folsom and Harrison Streets and over Rincon Hill?
- Should Line 31 Balboa continue to go to the foot of Market St, or would it be more useful if it turned down 5th St to end at Caltrain?
Let’s take these one by one.
Line 47 Van Ness
Before Covid-19, Van Ness Avenue was served by two overlapping lines, 47 Van Ness and 49 Van Ness / Mission. The L-shaped 47 provided some direct service from Van Ness into Caltrain and destinations around Showplace Square. Buses on the two lines were scheduled to come every 8 minutes, and on Van Ness their schedules were offset so that a bus (either 47 or 49) came every 4 minutes.
This was really inefficient. Line 49 has much more ridership and a much more urgent need for frequency. But because of how 47 and 49 were combined along Van Ness, Muni couldn’t increase the frequency of 49 without also increasing 47.

Here are all the routes that connect points in SOMA with points on or near Van Ness. Line width indicates frequency.
Line 47’s role was to connect parts of SOMA to points along Van Ness. But many other lines also do this, as you’ll see on this map. So should Muni keep the 47? Maybe, but if they didn’t, they could:
- Run 12 Folsom every 8 minutes the full length of SOMA, from the Financial District to 16th St.
- Run 49 Van Ness Mission more frequently, putting more service into the Mission where the need is very high. This would also let us set frequencies on Van Ness to match demand more exactly.
Lines 10 Townsend and 12 Folsom/Pacific
Line 10 Townsend, south of Market Street, comes back in all of the alternatives. Before the pandemic, Lines 10 and 12 ran together along Pacific Street, through Chinatown and over Russian Hill to Van Ness. They each ran every 15 minutes, so that along Pacific Street there was service every 8 minutes.
But especially if Muni removed the 47, they’d have plenty of demand for service every 8 minutes all the way through SOMA on Folsom and Harrison. To provide that, it would make sense for Line 12, every 8 minutes, to be the only service on Pacific Street, and for the 10 Townsend to end downtown.
Where should 31 Balboa go downtown?
Transit demand to the Financial District is much lower than it used to be, and nobody knows when all the desks in all those towers will be full of workers again. So it’s important to ask whether so many local routes need to go there all day.
With so many other routes still going to the Financial District, would it make sense for Line 31 Balboa to turn south on 5th Street to end at Caltrain instead? This would provide direct service from Caltrain to the north edge of Civic Center, replacing a link that Line 47 provides now.
More frequency on 3rd and 4th Streets (30 Stockton)?
Finally, should Muni restore higher frequency on 30 Stockton, which serves 3rd and 4th Streets? It’s expensive, and when the Central Subway opens next year they might need less service here. But right now, they are seeing more crowding on this busy route through Chinatown, and they want to add service here if possible to make sure they can pick everyone up.
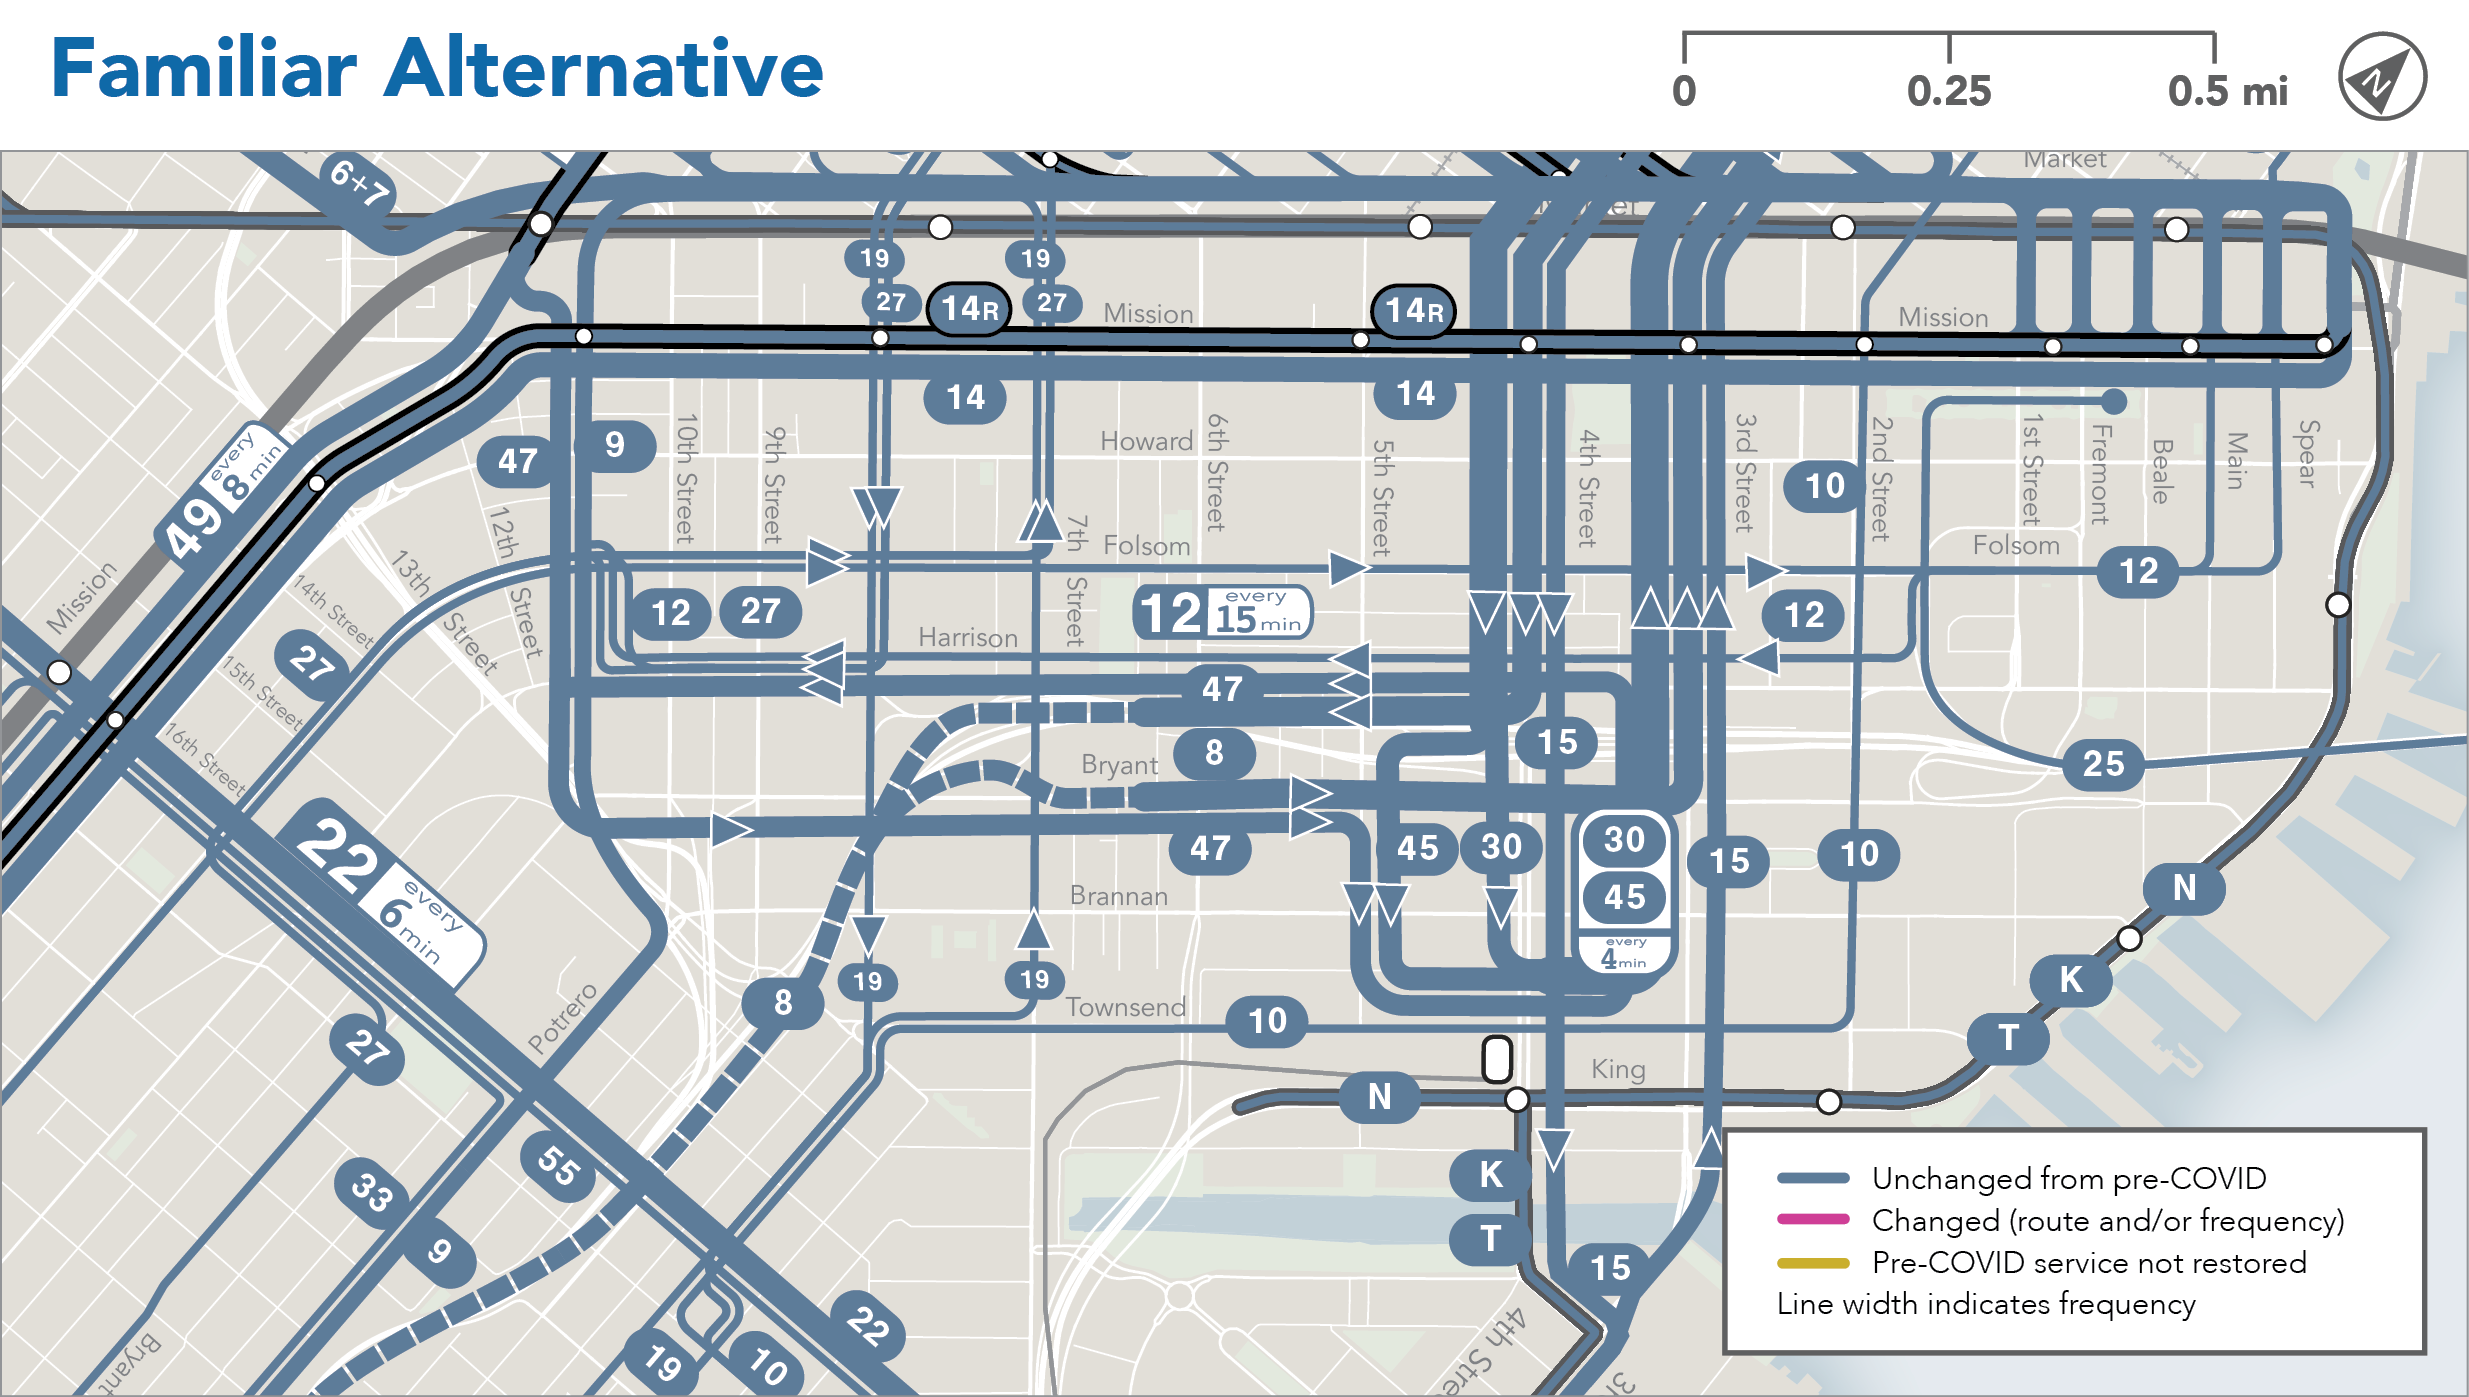
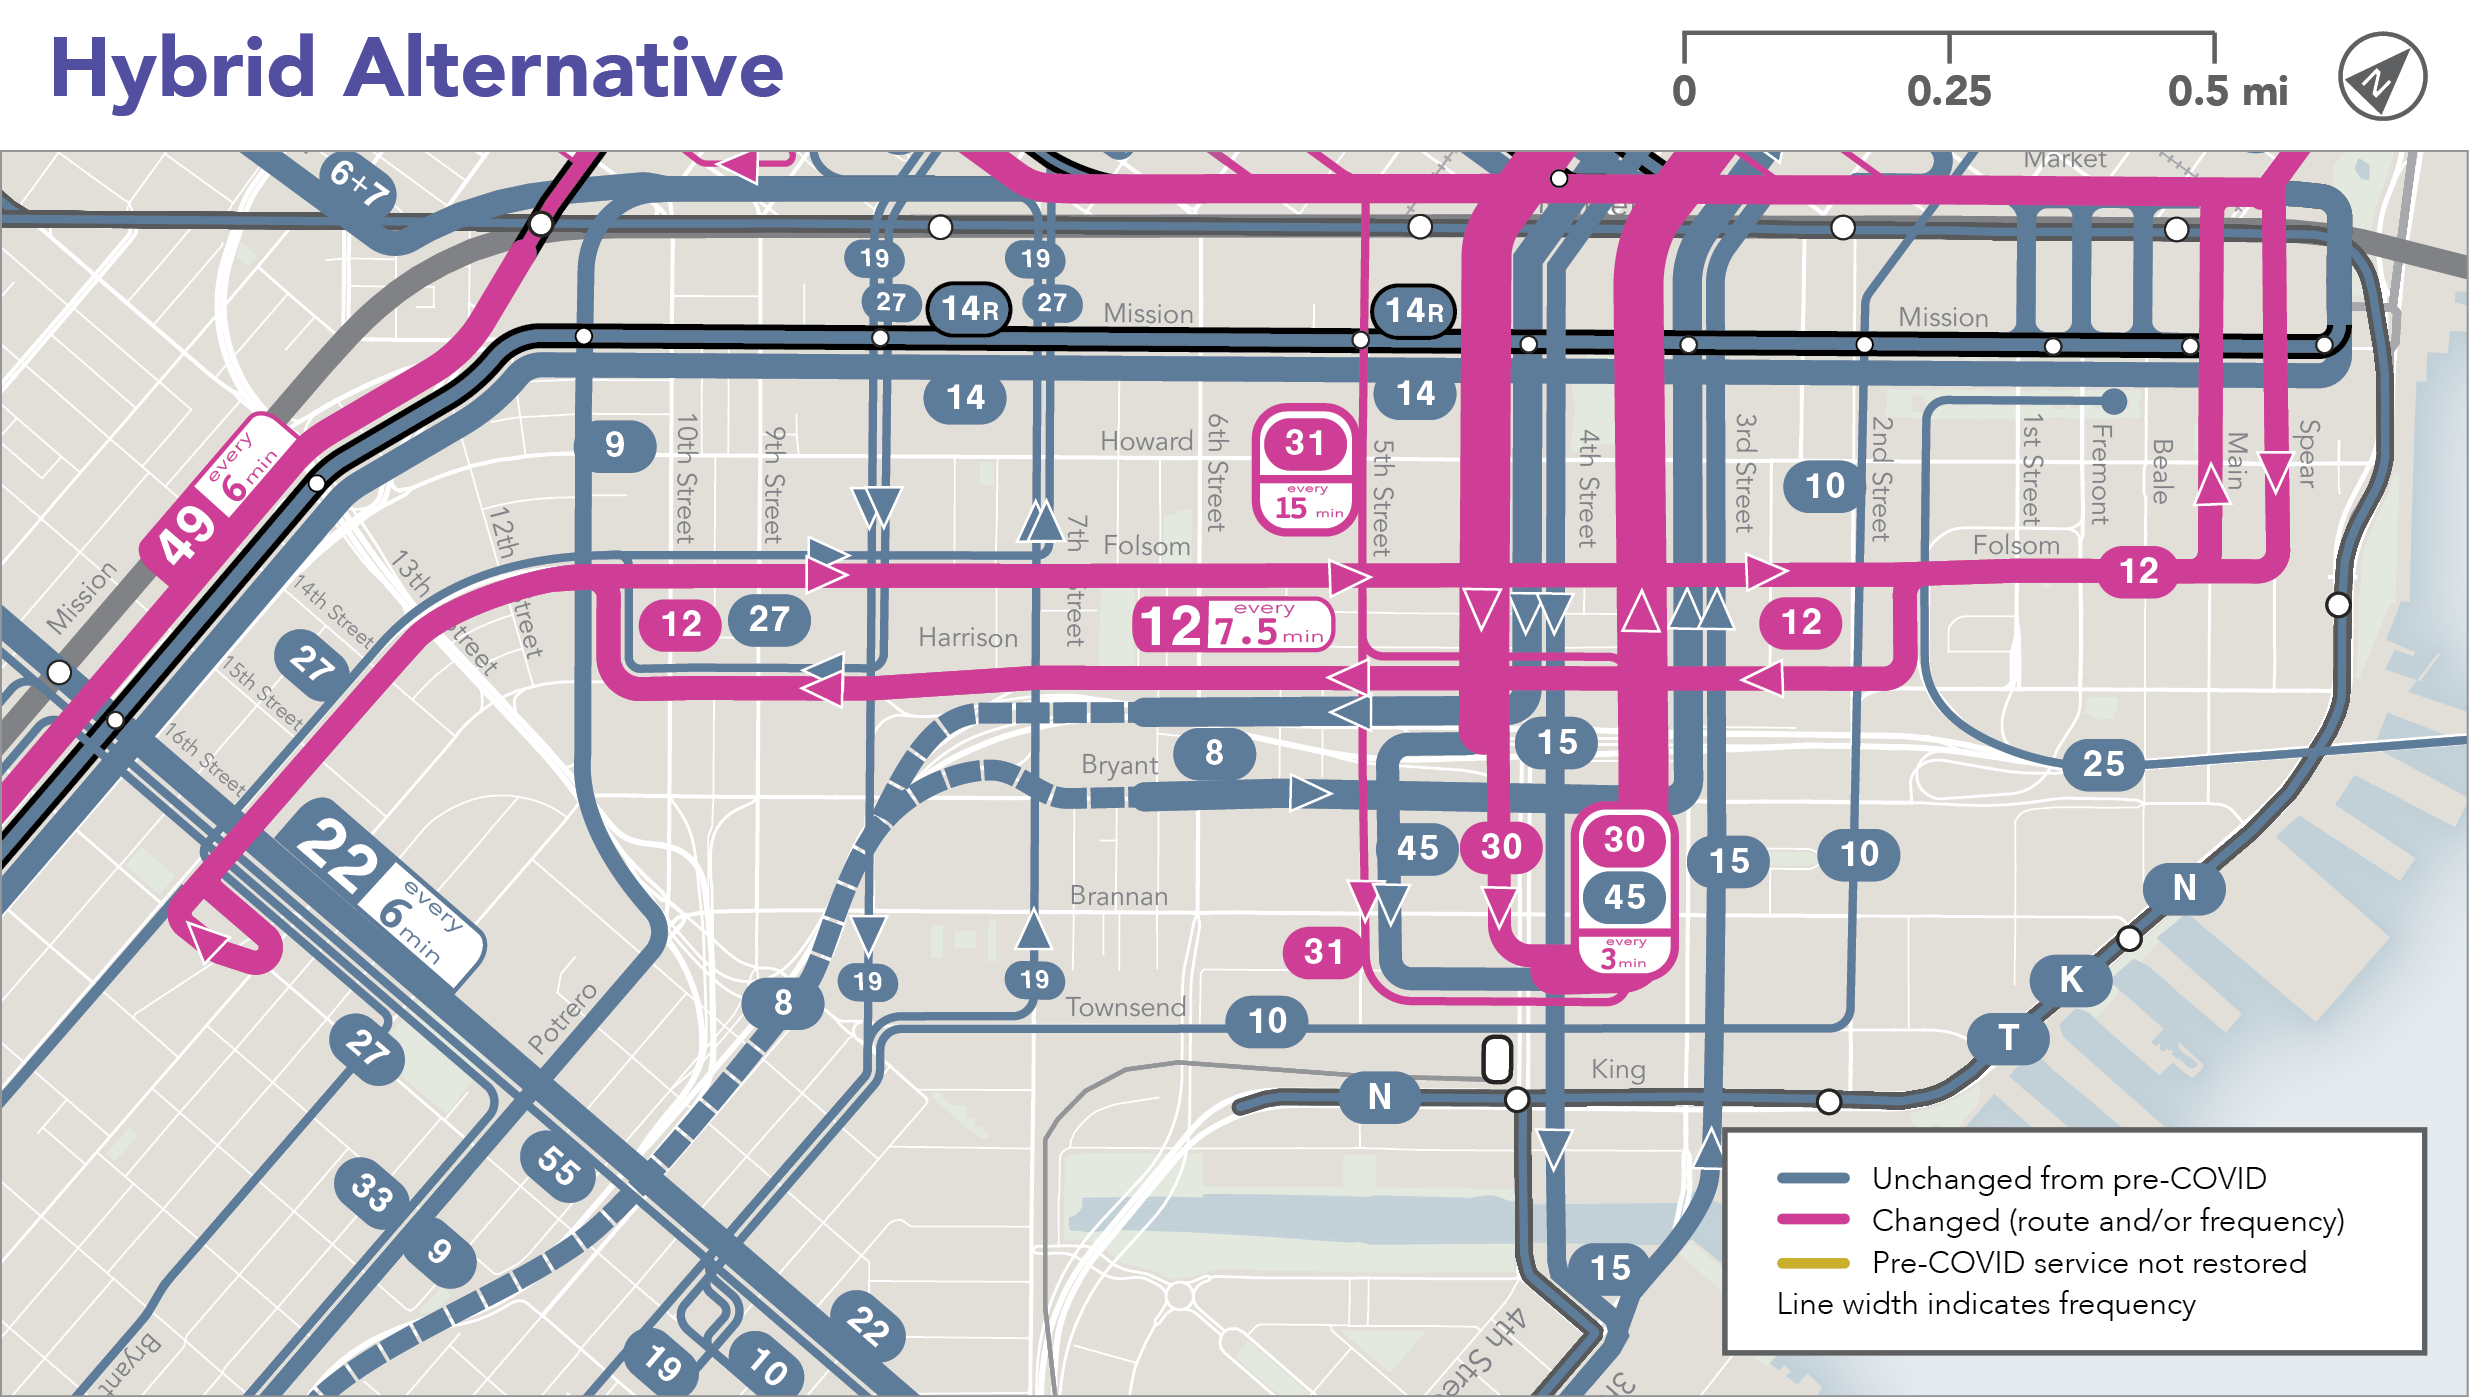
So here are the options. See the maps that follow.
| Familiar Alt. | Hybrid Alt. | Frequent Alt. | |
| 10 Townsend | Restored with service every 15 minutes. Continues along Pacific Street to Van Ness, forming 8 minute frequency together with 12 Folsom/Pacific | Restored with service every 15 minutes. Ends downtown, at Sansome & Washington. | Restored with service every 15 minutes. Ends downtown, at Sansome & Washington. |
| 12 Folsom – Pacific | Restored with service every 15 minutes. | Restored with service every 8 minutes along Pacific St, through downtown, and along Folsom/Harrison Sts to 16th St. | Restored with service every 8 minutes along Pacific St, through downtown, and along Folsom/Harrison Sts to 16th St. |
| 22 Fillmore | No Change (every 6 min) | No Change (every 6 min) | Increased to every 5 min |
| 30 Stockton (with 45 Union/Stockton) | Service every 4 minutes (Lines 30 and 45 combined). | Service every 3 minutes (Lines 30 and 45 combined). | Service every 3 minutes (Lines 30 and 45 combined). |
| 47 Van Ness | Restored with service every 8 minutes. | Not restored. | Not restored. |
| 49 Van Ness Mission | Retained with service every 8 minutes, for combined 4 minute frequency along Van Ness. | Runs every 6 minutes, as the only service on Van Ness | Replaced by 49R Van Ness Mission Rapid, running every 5 minutes. 49R serves the same stops on Van Ness as the current 49, but in the Mission it stops at the 14R Mission Rapid stops. |
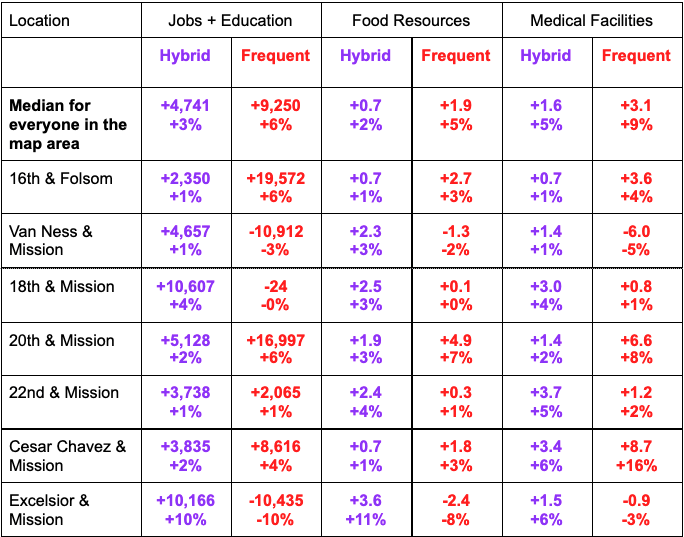
How do the Hybrid and Frequent alternatives change where you could get to in 30 minutes, compared to the Familiar alternative? This table shows the average increase for the area of the map, and also for three locations within the area. Negative numbers indicate a decrease.
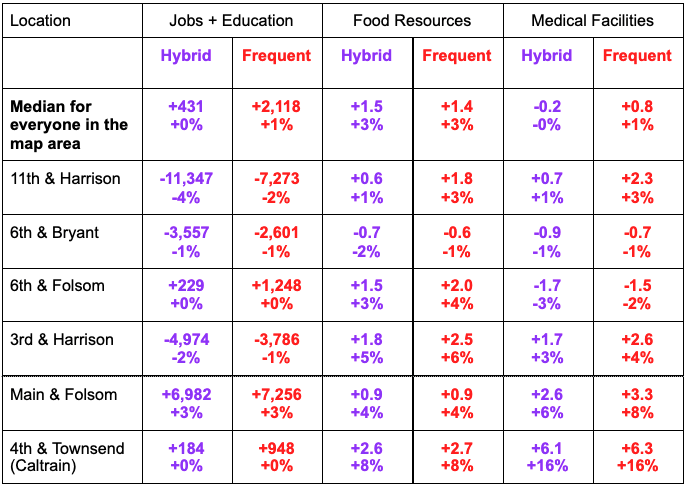
Number of new destinations reachable in 30 minutes, for the whole area and for selected points. Negative numbers indicate a loss in access.
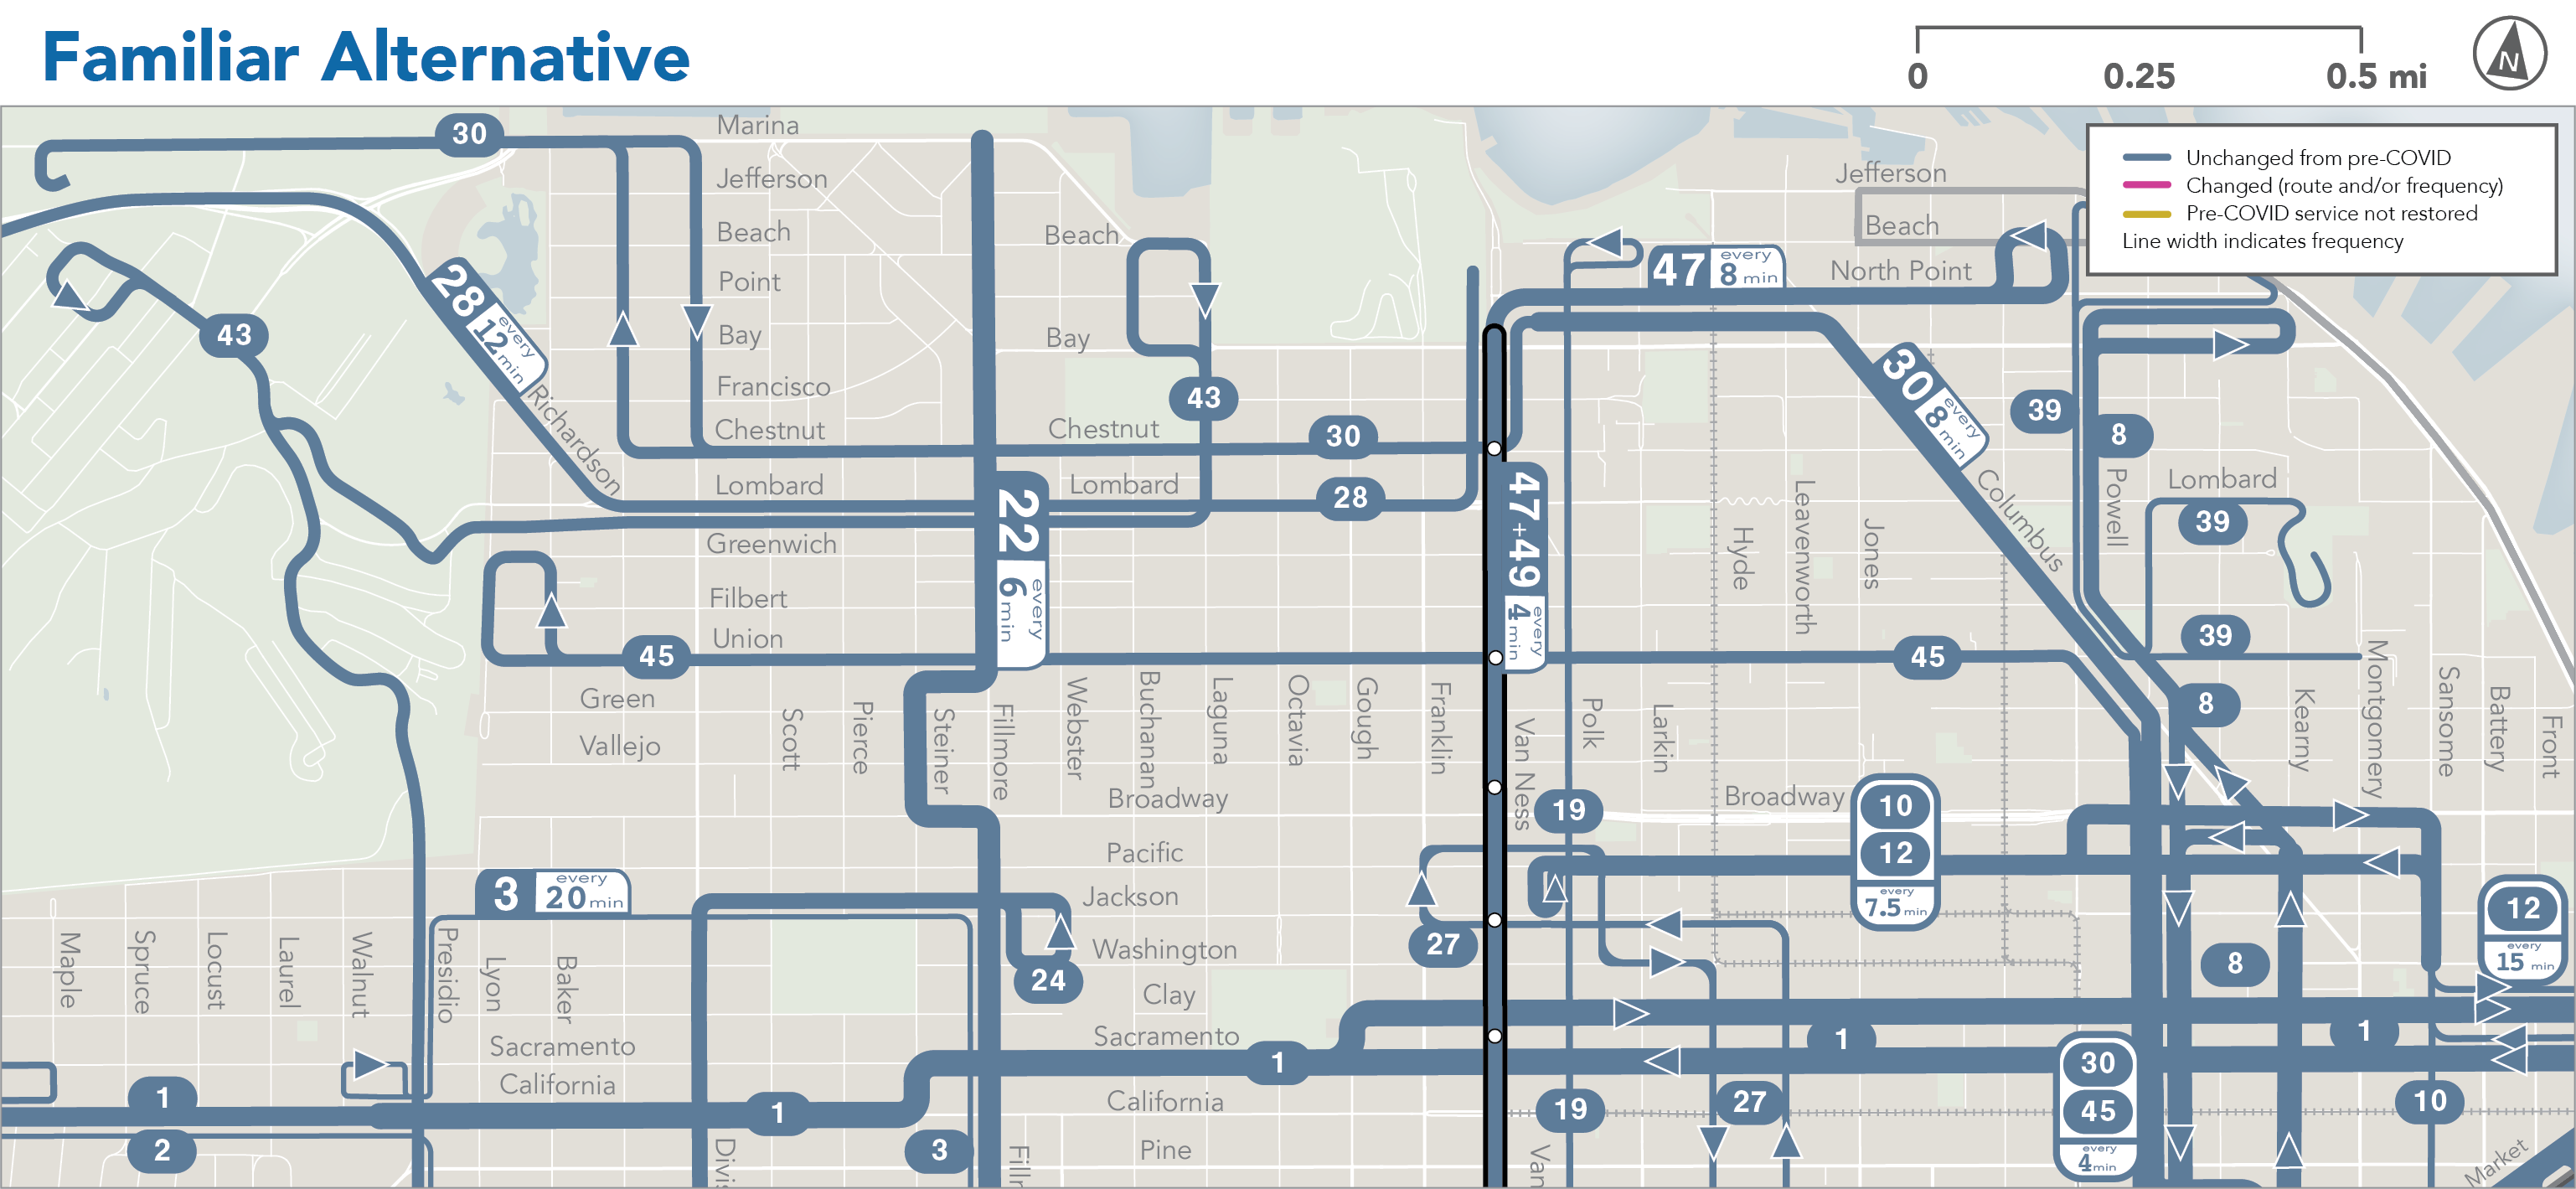
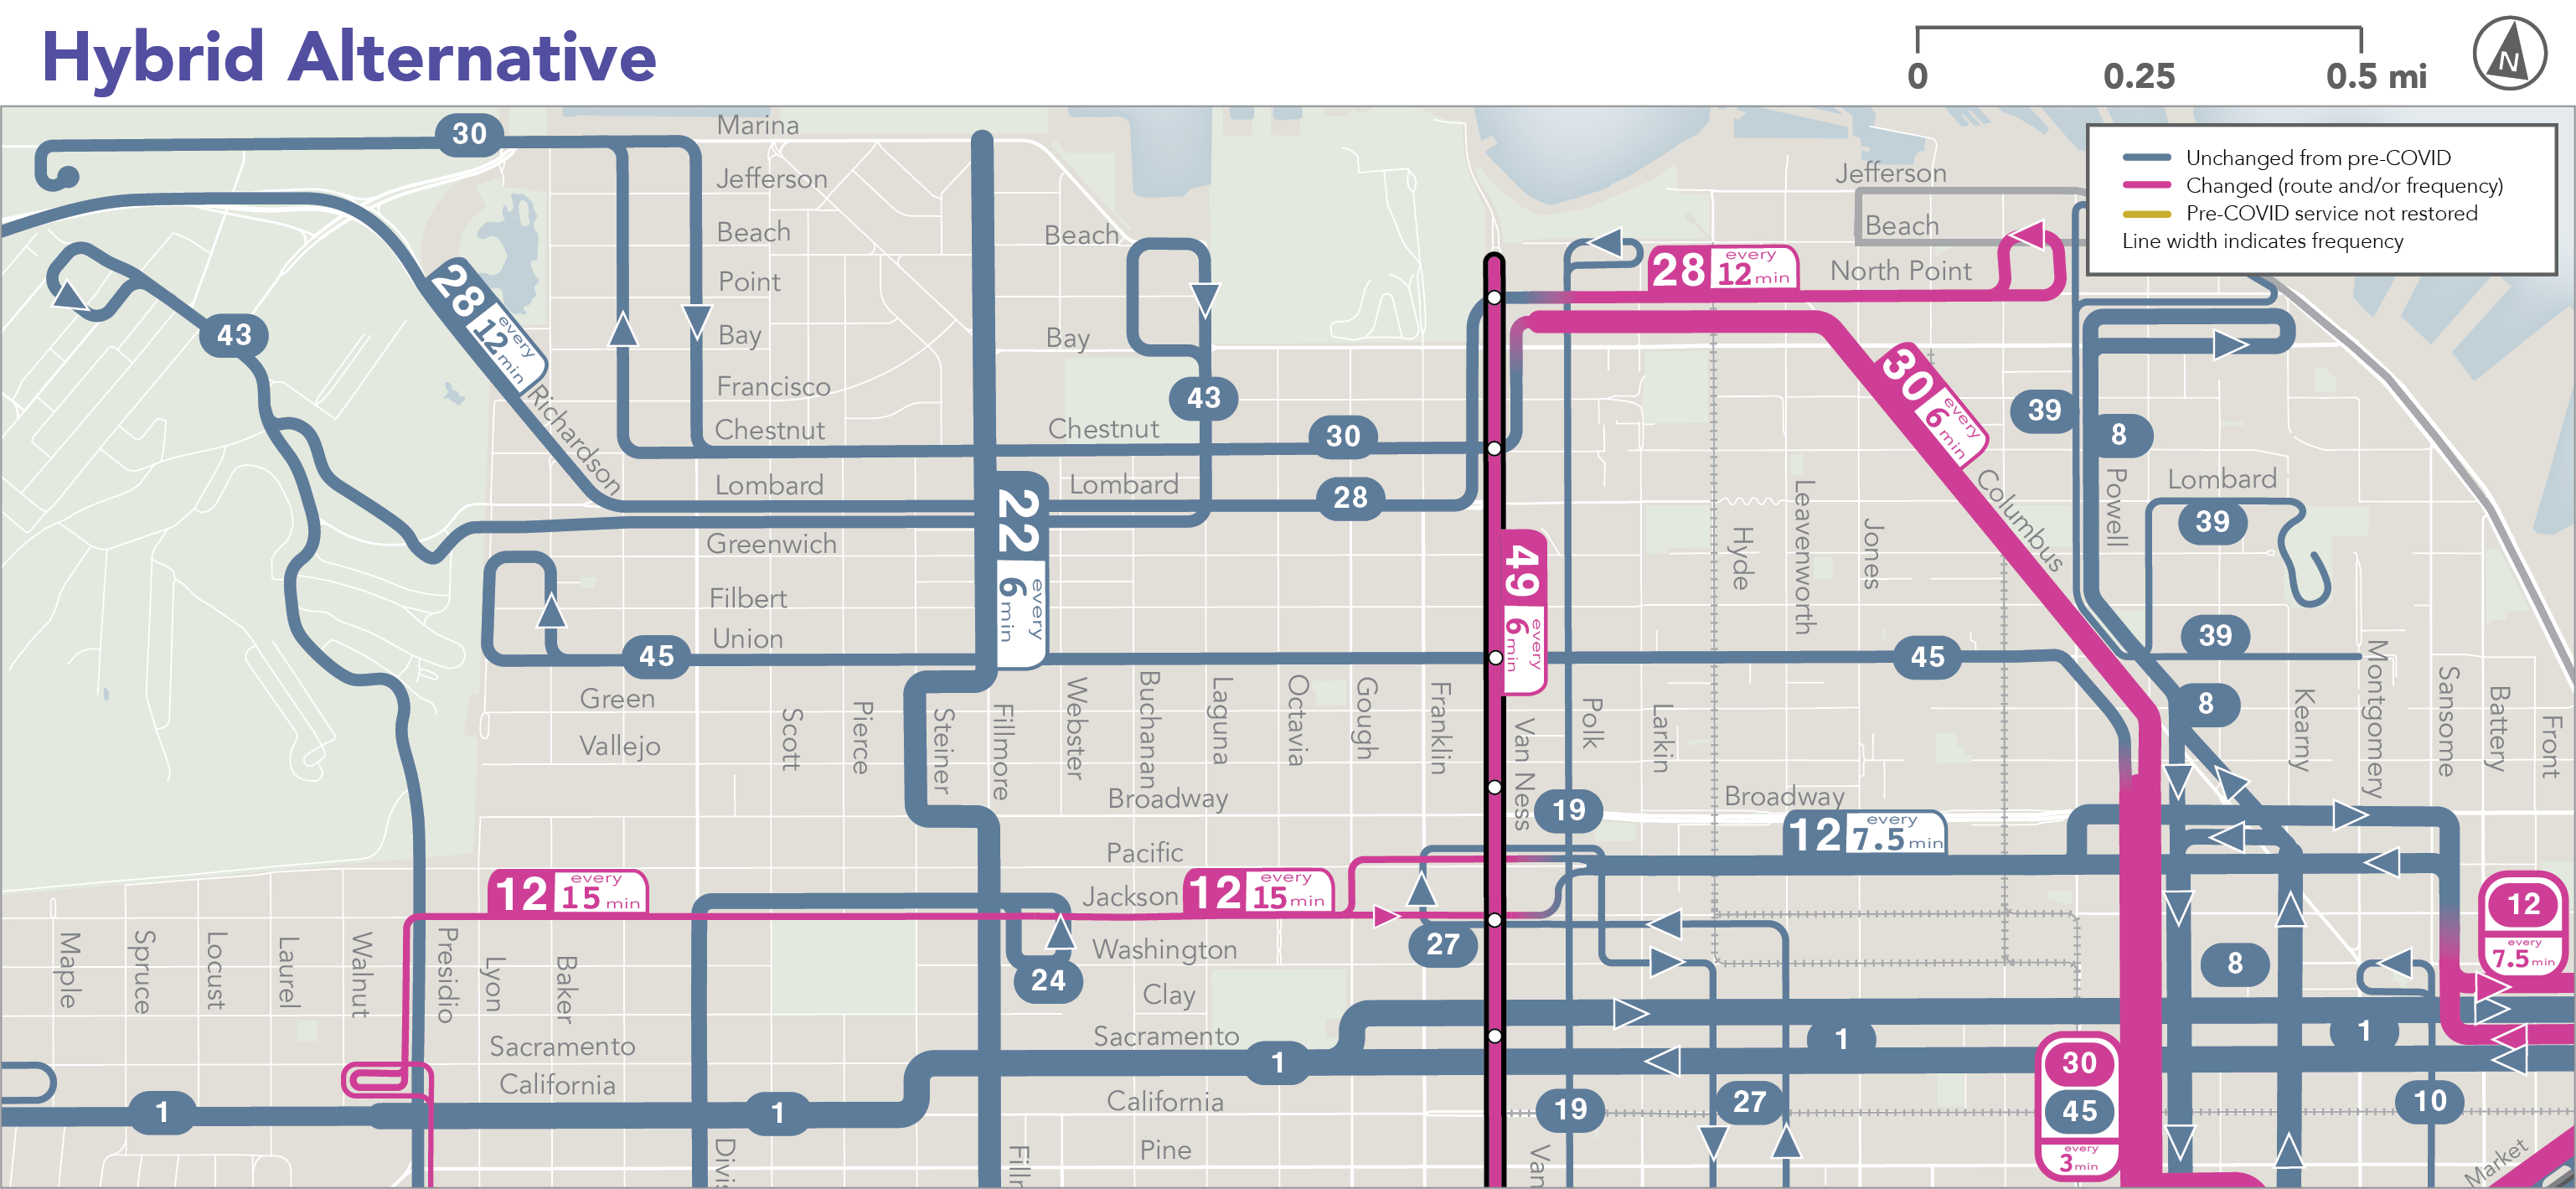
The Presidio, the Marina, Fisherman’s Wharf, Chinatown, North Beach (Lines 22, 28, 30, 43, 47, 49)
In the section on SOMA above we talked about the question of whether Muni should restore Line 47, which connected Van Ness and SOMA, or whether they should serve Van Ness with a more frequent 49 Van Ness / Mission service, as they do now. If they do this, frequency on Van Ness goes down a bit but reliability goes up, because it will be easier to manage the operations of a single line than a service that’s made up of two lines running together. We also wonder if the 49 Van Ness / Mission should be a 49 Rapid, making all stops along Van Ness but then making only Rapid stops in the Mission (generally the same stops as 14R Mission Rapid.) If they did this, they could run the whole line more frequently, and access from Van Ness to the Mission District and City College gets much better.
At the north end of Van Ness, 49 currently turns east along North Point Street to end at Powell & North Point (Muni’s Kirkland base) in Fisherman’s Wharf. This is an important link but does it need to be attached to Van Ness? Another possibility is that the 28 19th Avenue, which currently ends at Van Ness & North Point, could continue across North Point into the Wharf, replacing this piece of the 49. This would provide continuous east-west service along the north edge of the city, from the Richmond across the Presidio and Marina to the Wharf. It would also mean that all 49 buses ended at the same place, which would make it easier for us to operate Van Ness service reliably. Is all that a good idea? We’re not sure.
Meanwhile, Line 43 Masonic, which runs north-south across the city, ends at California Street right now. We haven’t restored the segment continuing north through the Presidio and then east through the Marina to Fort Mason.
We could do this, but another interesting option would be to run the 28 19th Avenue through the eastern part of the Presidio instead (see map). This would make it easier to get from the Sunset and RiIchmond to the Presidio’s jobs, and also connect the Presidio through to Fisherman’s Wharf. In this case, the 43 would be restored along Presidio Blvd to the Presidio Transit Center in the Main Post area, but would not continue on to the Marina. One big downside: No service to the front door of Fort Mason or the adjacent Marina Safeway, although those would still be within ¼ mile walk of 30 Stockton or 22 Fillmore.
Finally, Muni is looking at increasing frequency on the 30 Stockton through Chinatown. These additional trips would extend from Caltrain to Van Ness & North Point.
| Familiar Alt. | Hybrid Alt. | Frequent Alt. | |
| 22 Fillmore | No Change (every 6 min) | No Change (every 6 min) | Increased to every 5 min |
| 28 19th Avenue | No change (every 12 min) | Extended east via North Point to Powell St in Fisherman’s Wharf, every 12 min, replacing this segment of Line 47 | Extended east via North Point to Powell St in Fisherman’s Wharf, every 12 min, replacing this segment of Line 47
Revised to serve the eastern end of the Presidio, with new stops at Letterman Digital Arts Center and near Girard & Lincoln. |
| 30 Stockton and 45 Union/Stockton | No change. Service every 4 minutes through Chinatown, through the combination of 30 and 45) and every 4-8 minutes along Columbus to Van Ness & North Point | Frequency improved with new 30 Stockton trips. Service every 3 minutes through Chinatown, through the combination of 30 and 45) and every 3-6 minutes along Columbus to Van Ness & North Point | Frequency improved with new 30 Stockton trips. Service every 3 minutes through Chinatown, through the combination of 30 and 45) and every 3-6 minutes along Columbus to Van Ness & North Point |
| 43 Masonic | Pre-covid routing restored through the Marina to Fort Mason, every 12 minutes. | Pre-covid routing restored through the Marina to Fort Mason, every 12 minutes. | Pre-covid routing restored only as far as Presidio Transit Center. Service from there to the Marina and Fort Mason is provided by Line 28, every 12 minutes (see above). |
These maps also show some options for the 3 Jackson and 12 Folsom/Pacific in Pacific Heights. See the discussion above on “Sutter, Clement, and Jackson Streets”.
How do the Hybrid and Frequent alternatives change where you could get to in 30 minutes, compared to the Familiar alternative? This table shows the average increase for the area of the map, and also for three locations within the area. Negative numbers indicate a decrease.

Number of new destinations reachable in 30 minutes, for the whole area and for selected points. Negative numbers indicate a loss in access.
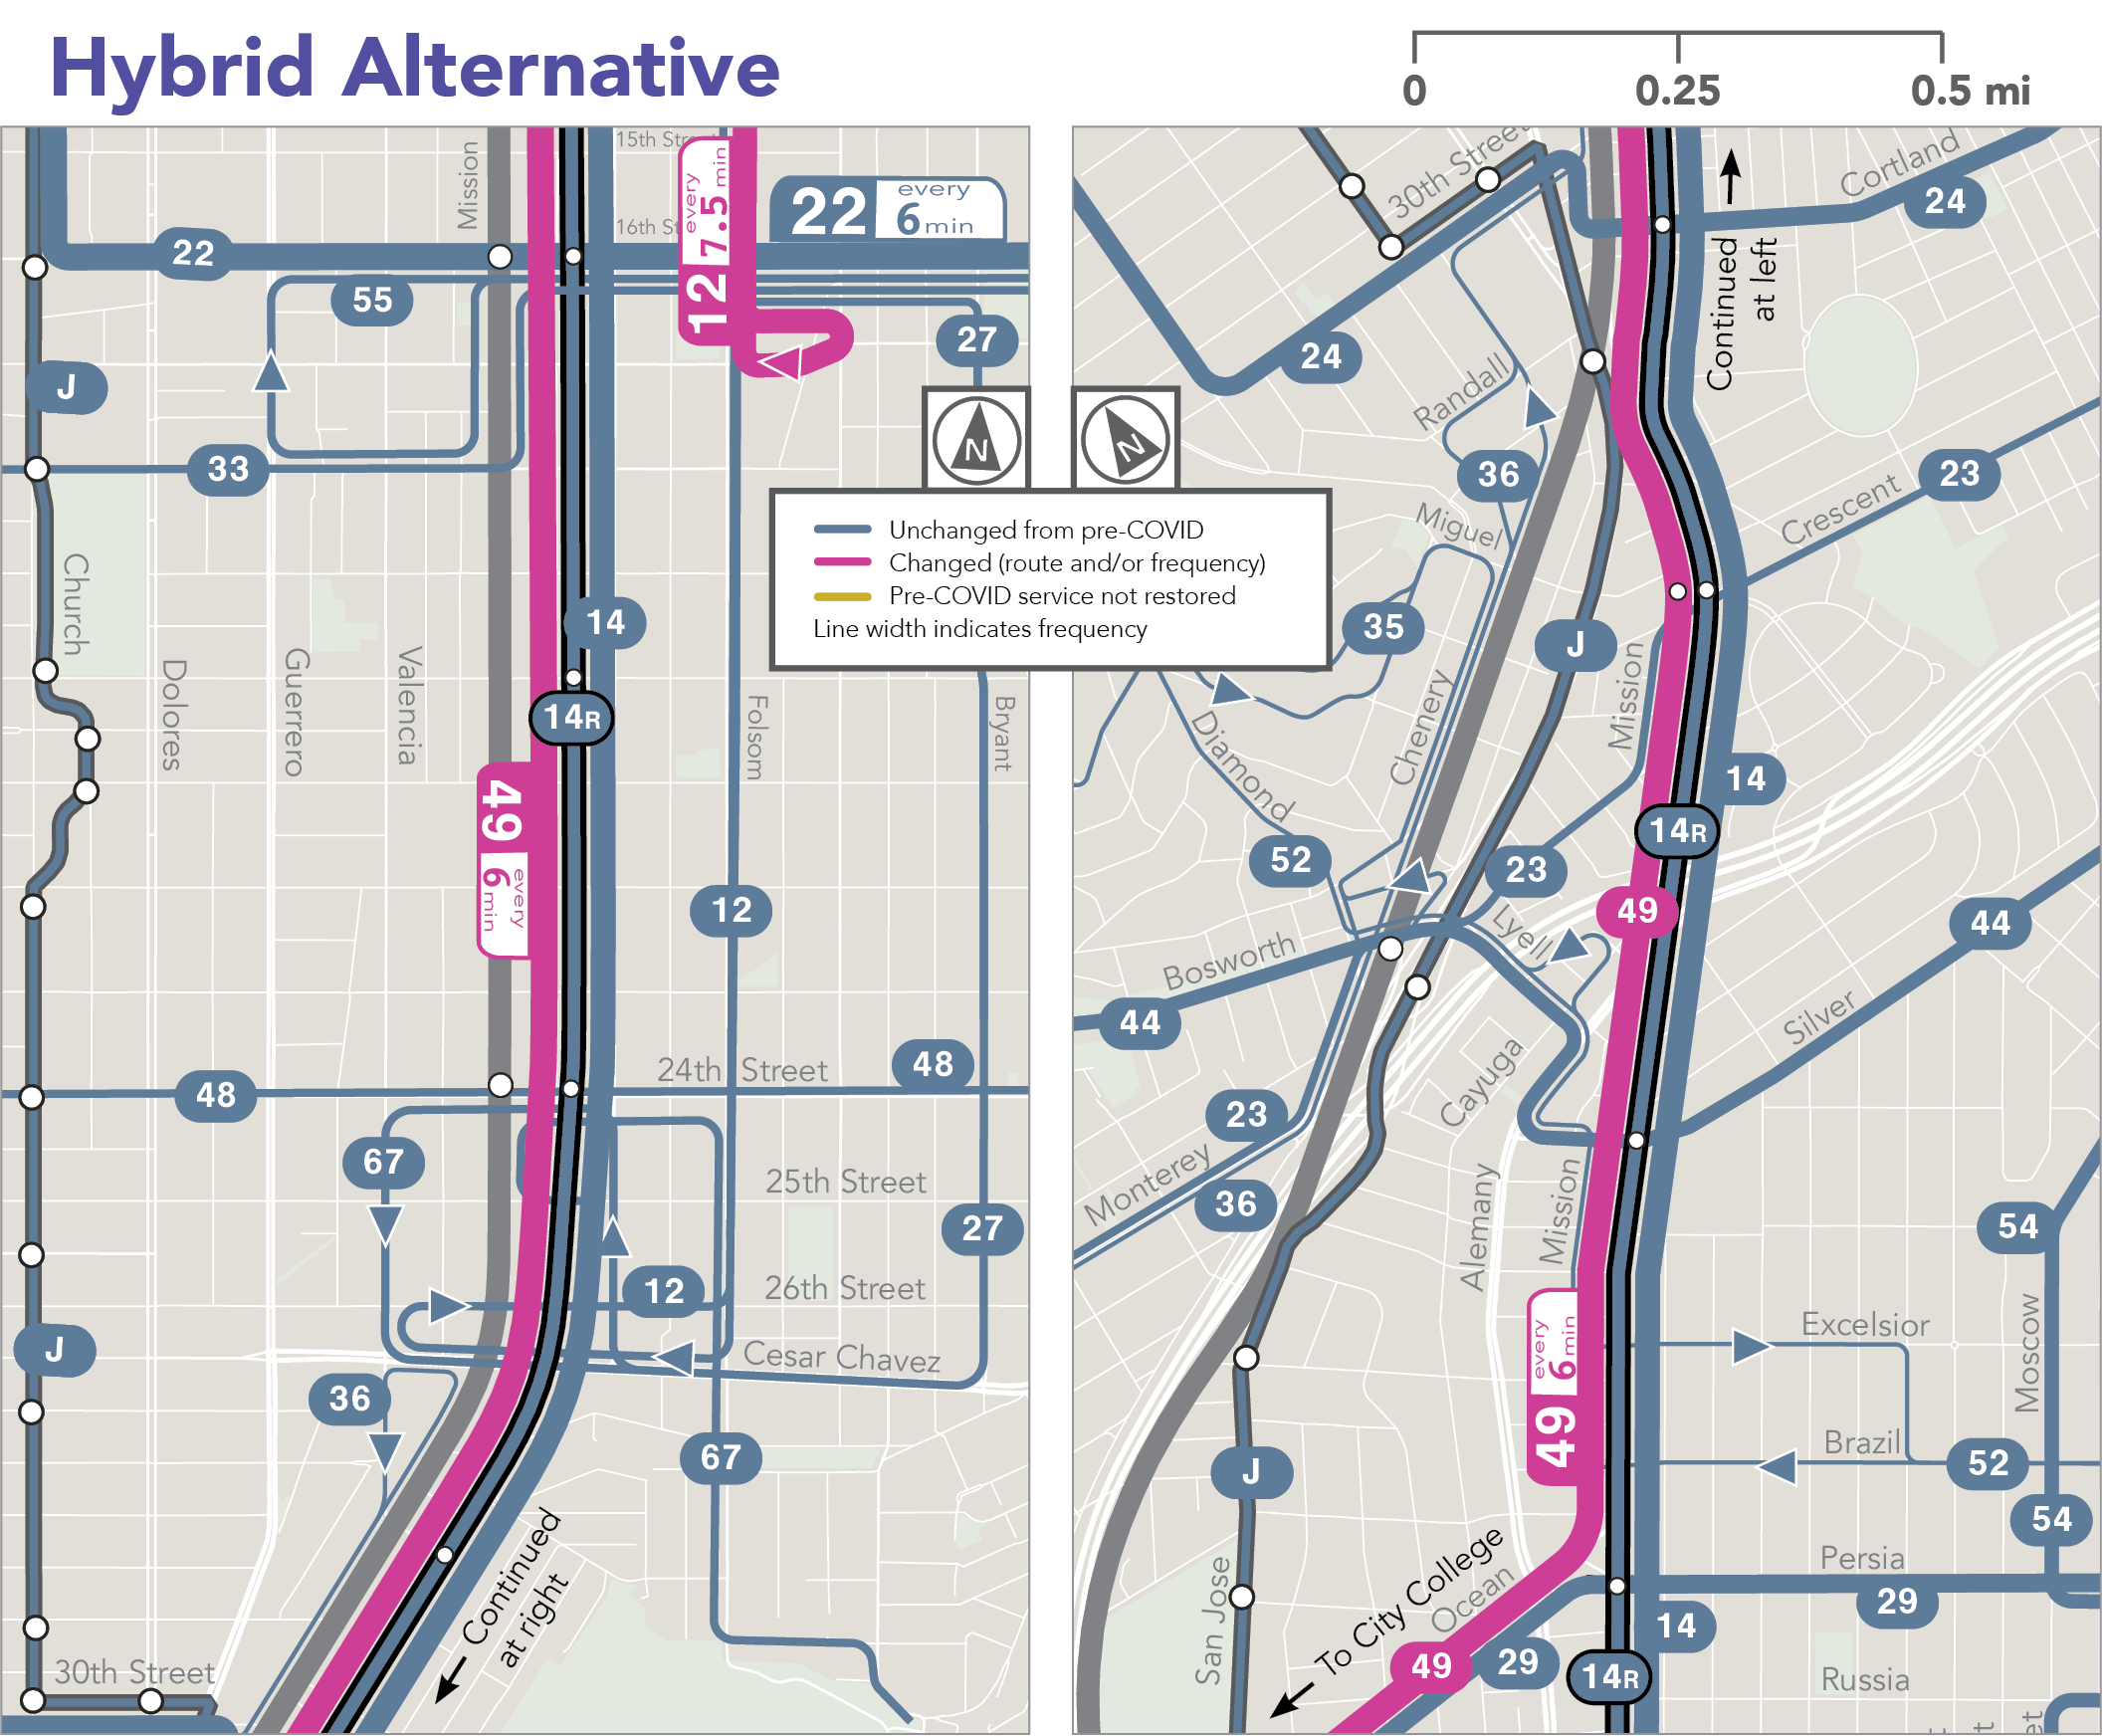
The Mission, Excelsior, City College (Lines 22, 49)
In the SOMA section above we suggested the possibility of removing Line 47 and running all Van Ness service as Line 49, which continues into the Mission and to City College. This would improve access to an area with very high transit needs and many major destinations of citywide importance.
There’s one more idea that might be worth thinking about : If Muni removes Line 47 they can provide service every 6 minutes (instead of 8) on Line 49. But they could provide service every 5 minutes if they replaced the 49 with a 49 Rapid. If they did this, Line 49R would still make all stops along Van Ness, at the new BRT stations, but along Mission it would stop only at the current Line 14 Rapid stops. This creates better access on average, but of course you’ll like this less if you’re further from a Rapid stop, and thus have to walk further to get to the more frequent Rapid service.
Finally, the Mission would benefit from improved frequency on Line 22, which Muni would like to offer if they can. The north edge of the Mission would also benefit from improved frequency on 12 Folsom from 16th Ave northward into SOMA and downtown. These changes are suggested in both Hybrid and Frequent alternatives.
So here are the alternatives:
| Familiar Alt. | Hybrid Alt. | Frequent Alt. | |
| 12 Folsom/Pacific | No change (every 15 min) | No change south of 16th. North of 16th the frequency is improved to every 8 minutes. | No change south of 16th. North of 16th the frequency is improved to every 8 minutes. |
| 22 Fillmore | No Change (every 6 min) | No Change (every 6 min) | Increased to every 5 min |
| 49 Van Ness / Mission | No change (every 8 min) | Frequency improved to every 6 min. | Replaced by 49R Rapid service every 5 minutes. 49R makes all stops on Van Ness Ave. and Ocean Ave but along Mission it stops only at 14R stops and at City College. One new Rapid stop is added at Powers St just south of Cesar Chavez. |


How do the Hybrid and Frequent alternatives change where you could get to in 30 minutes, compared to the Familiar alternative? This table shows the average increase for the area of the map, and also for three locations within the area. Negative numbers indicate a decrease.
Number of new destinations reachable in 30 minutes, for the whole area and for selected points. Negative numbers indicate a loss in access.
3. Benefits and Tradeoffs
This section answers the big question: What benefits do the alternatives achieve for riders, potential future riders, and everyone who cares about transit in San Francisco?
In each case, we show the impact of the Hybrid alternative and Frequent alternative compared to the Familiar alternative.
We look here at three important measures:
- Access to Destinations: How many useful destinations (jobs, education, etc) can people get to in a limited amount of time?
- Coverage: How many people and jobs are within ¼ mile walk of service?
- Access to Frequent Service: How many people are near high frequency service?
It’s important to think about which of these things matter most to you. You may find that what matters is that transit takes you wherever you need or want to go, in a reasonable amount of time. Everything else about a network, including coverage and frequency, is part of delivering that.
Access to Destinations
Access is your ability to go places on transit in a limited amount of time. You can read about this idea here.
Citywide Access to Destinations
Both Hybrid and Frequent scenarios expand where people can get to in a limited amount of time. It doesn’t do this for absolutely everyone, but it does it for most people.
Here’s how the concepts change how many useful destinations the average San Franciscan can reach in 30 minutes. A positive number means that on average, people can get to this many more of that destination, compared to the Familiar alternative.
On average, how many more of each kind of destination can be reached in 30 minutes? (For jobs and education we are talking about jobs or school enrollments, so the numbers are large. For other destinations we count each destination once, so the numbers are smaller and we therefore include fractions.)
We calculate this two ways, first for everyone in San Francisco, and second for just people in the affected area. (The affected area, mapped in Section 1 above, is the area within ¾ mile of a route segment that’s affected by the alternatives, most of which are near routes whose restoration is being debated.)
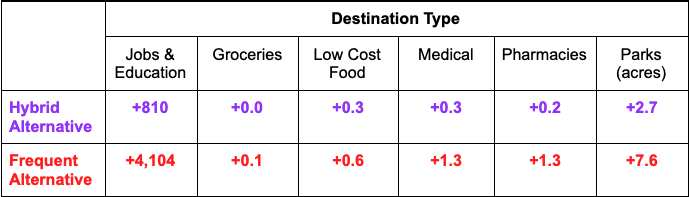
Average change in destinations reachable in 30 minutes, citywide.
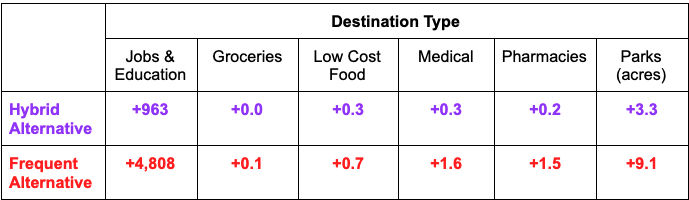
Average change in destinations reachable in 30 minutes, affected area.
Where could you go from where you are in 30 minutes?
The numbers we just gave you are averages, but of course nobody’s average. The results for you will depend on where you are. The maps below show, for every point in the city, how access to destinations gets better in each alternative, compared to the Familiar alternative. These maps are based on:
- A travel time of 30 minutes
- A walking speed of 2.5 mph. Most people walk or roll faster than this, but we’ve chosen a low estimate to reflect the difficulty some people will have climbing hills, crossing streets, etc.
In each map, shades of green mean an expansion in access and shades of brown mean a reduction in access. Darker means a bigger difference.
Access to Jobs and Education
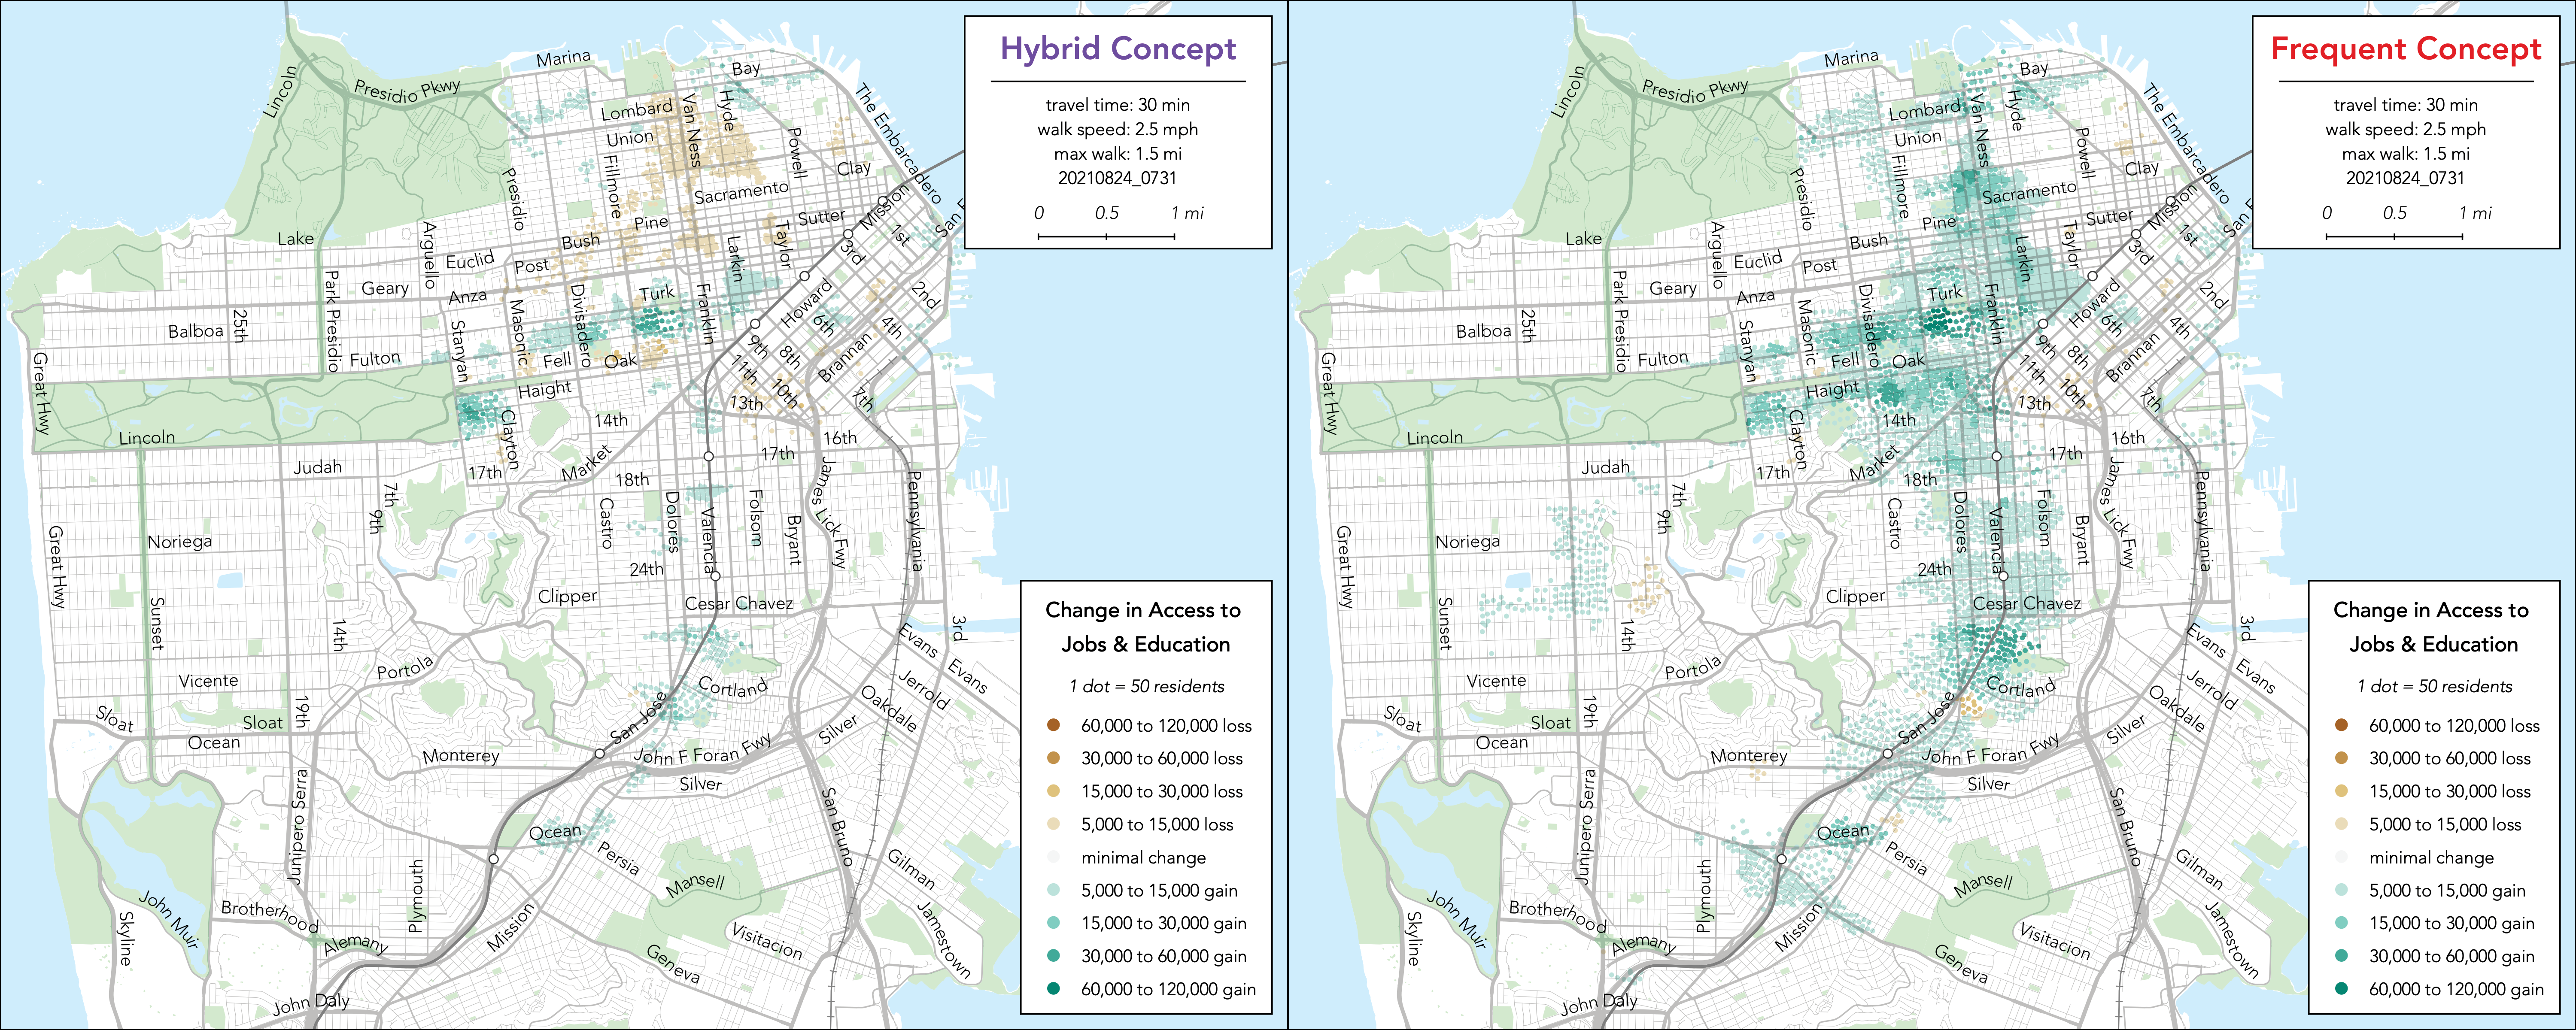
Change in Access to Jobs and Education
Access to Grocery Stores
Only the Frequent alternative shows a change in access to grocery stores for any location in the city.
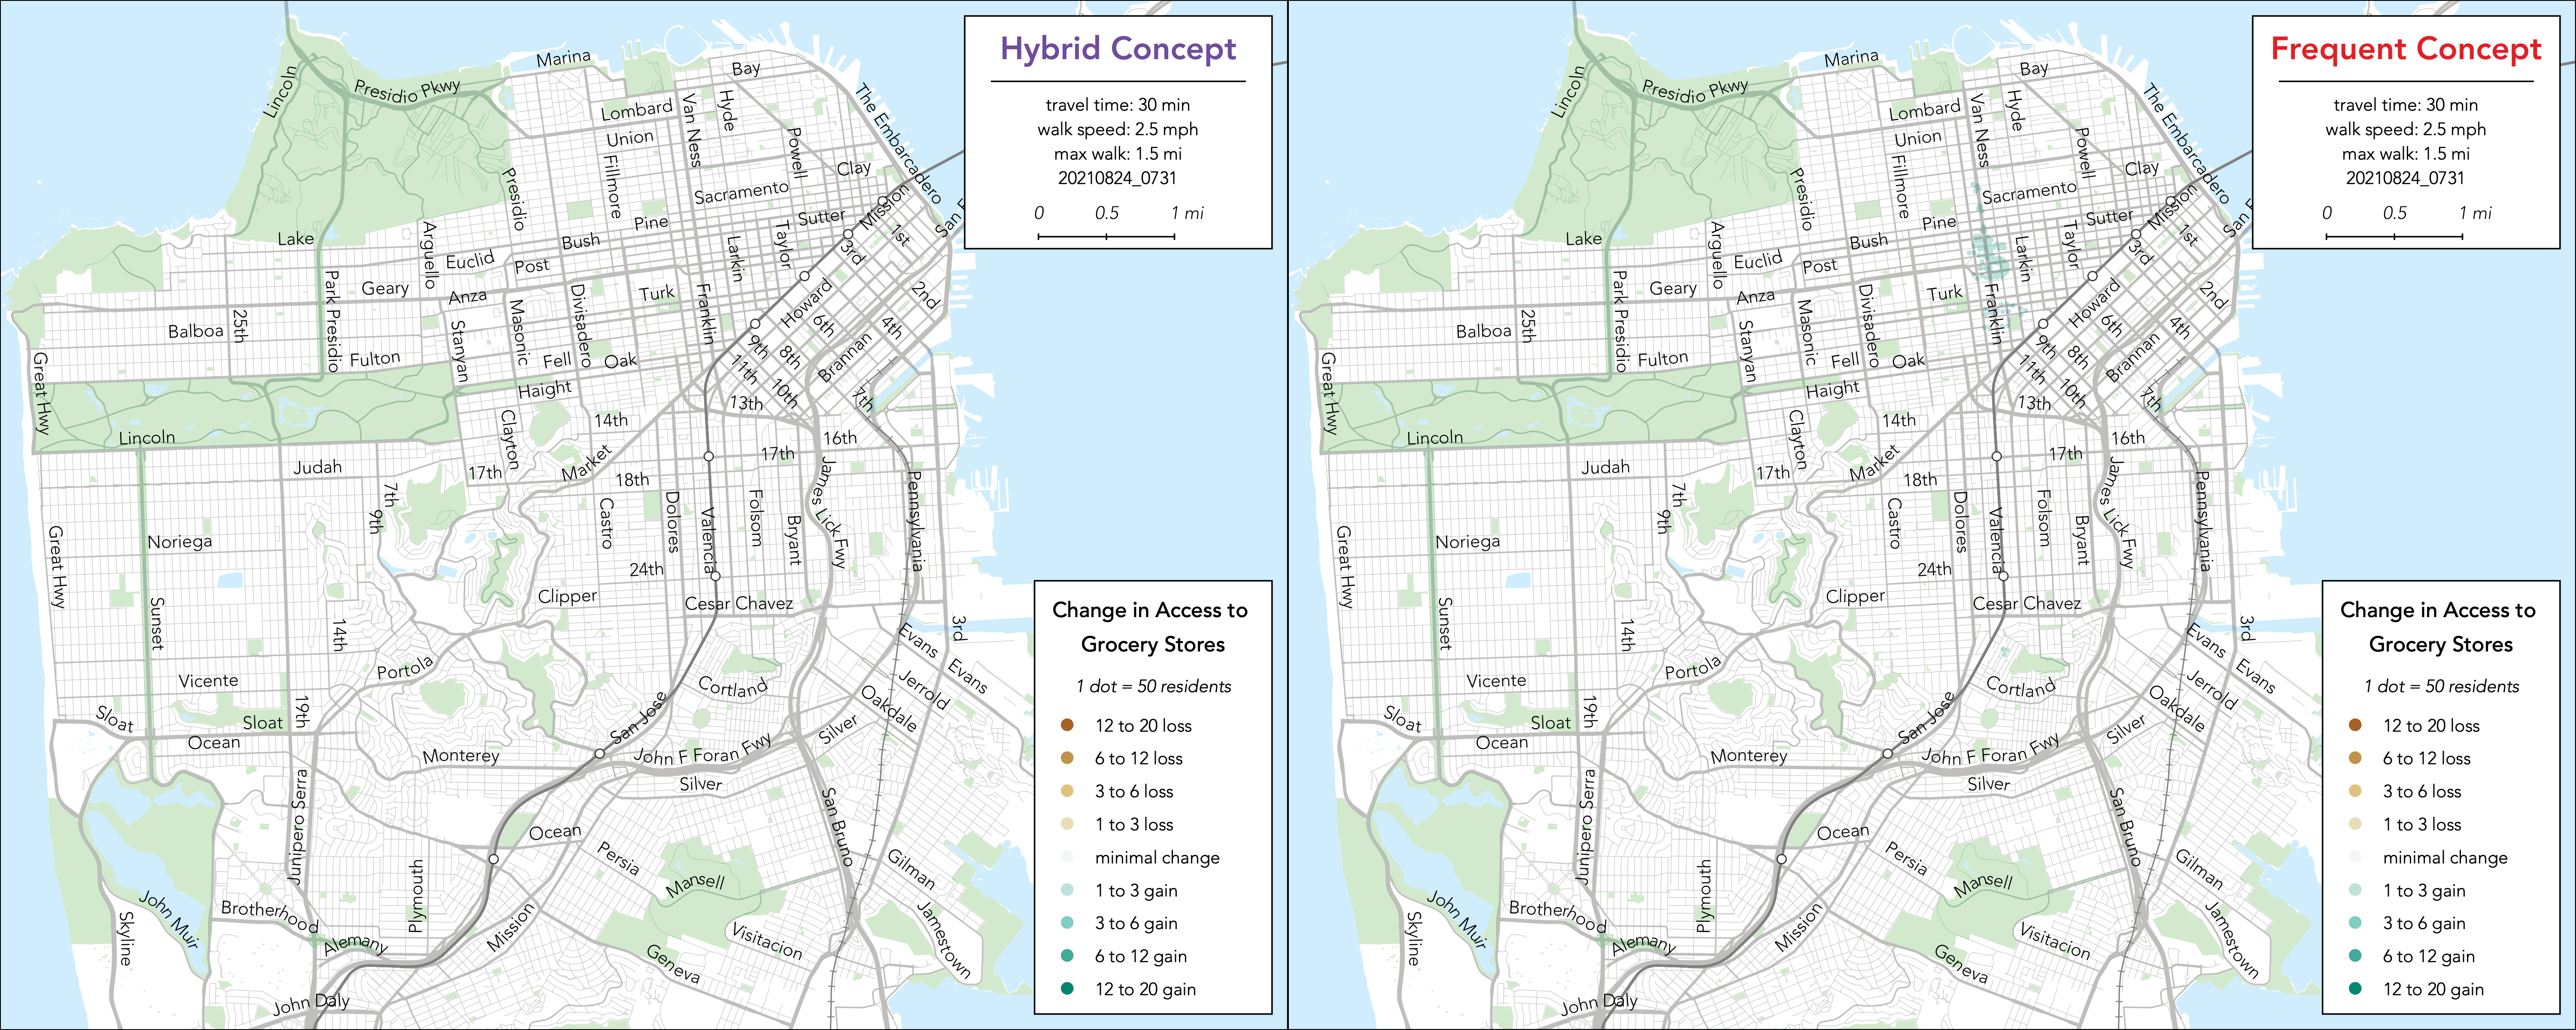
Change in Access to Grocery Stores
Access to Low Cost Food
Low-Cost Food Resources includes low cost grocery stores and prepared meals (from senior centers and community centers)
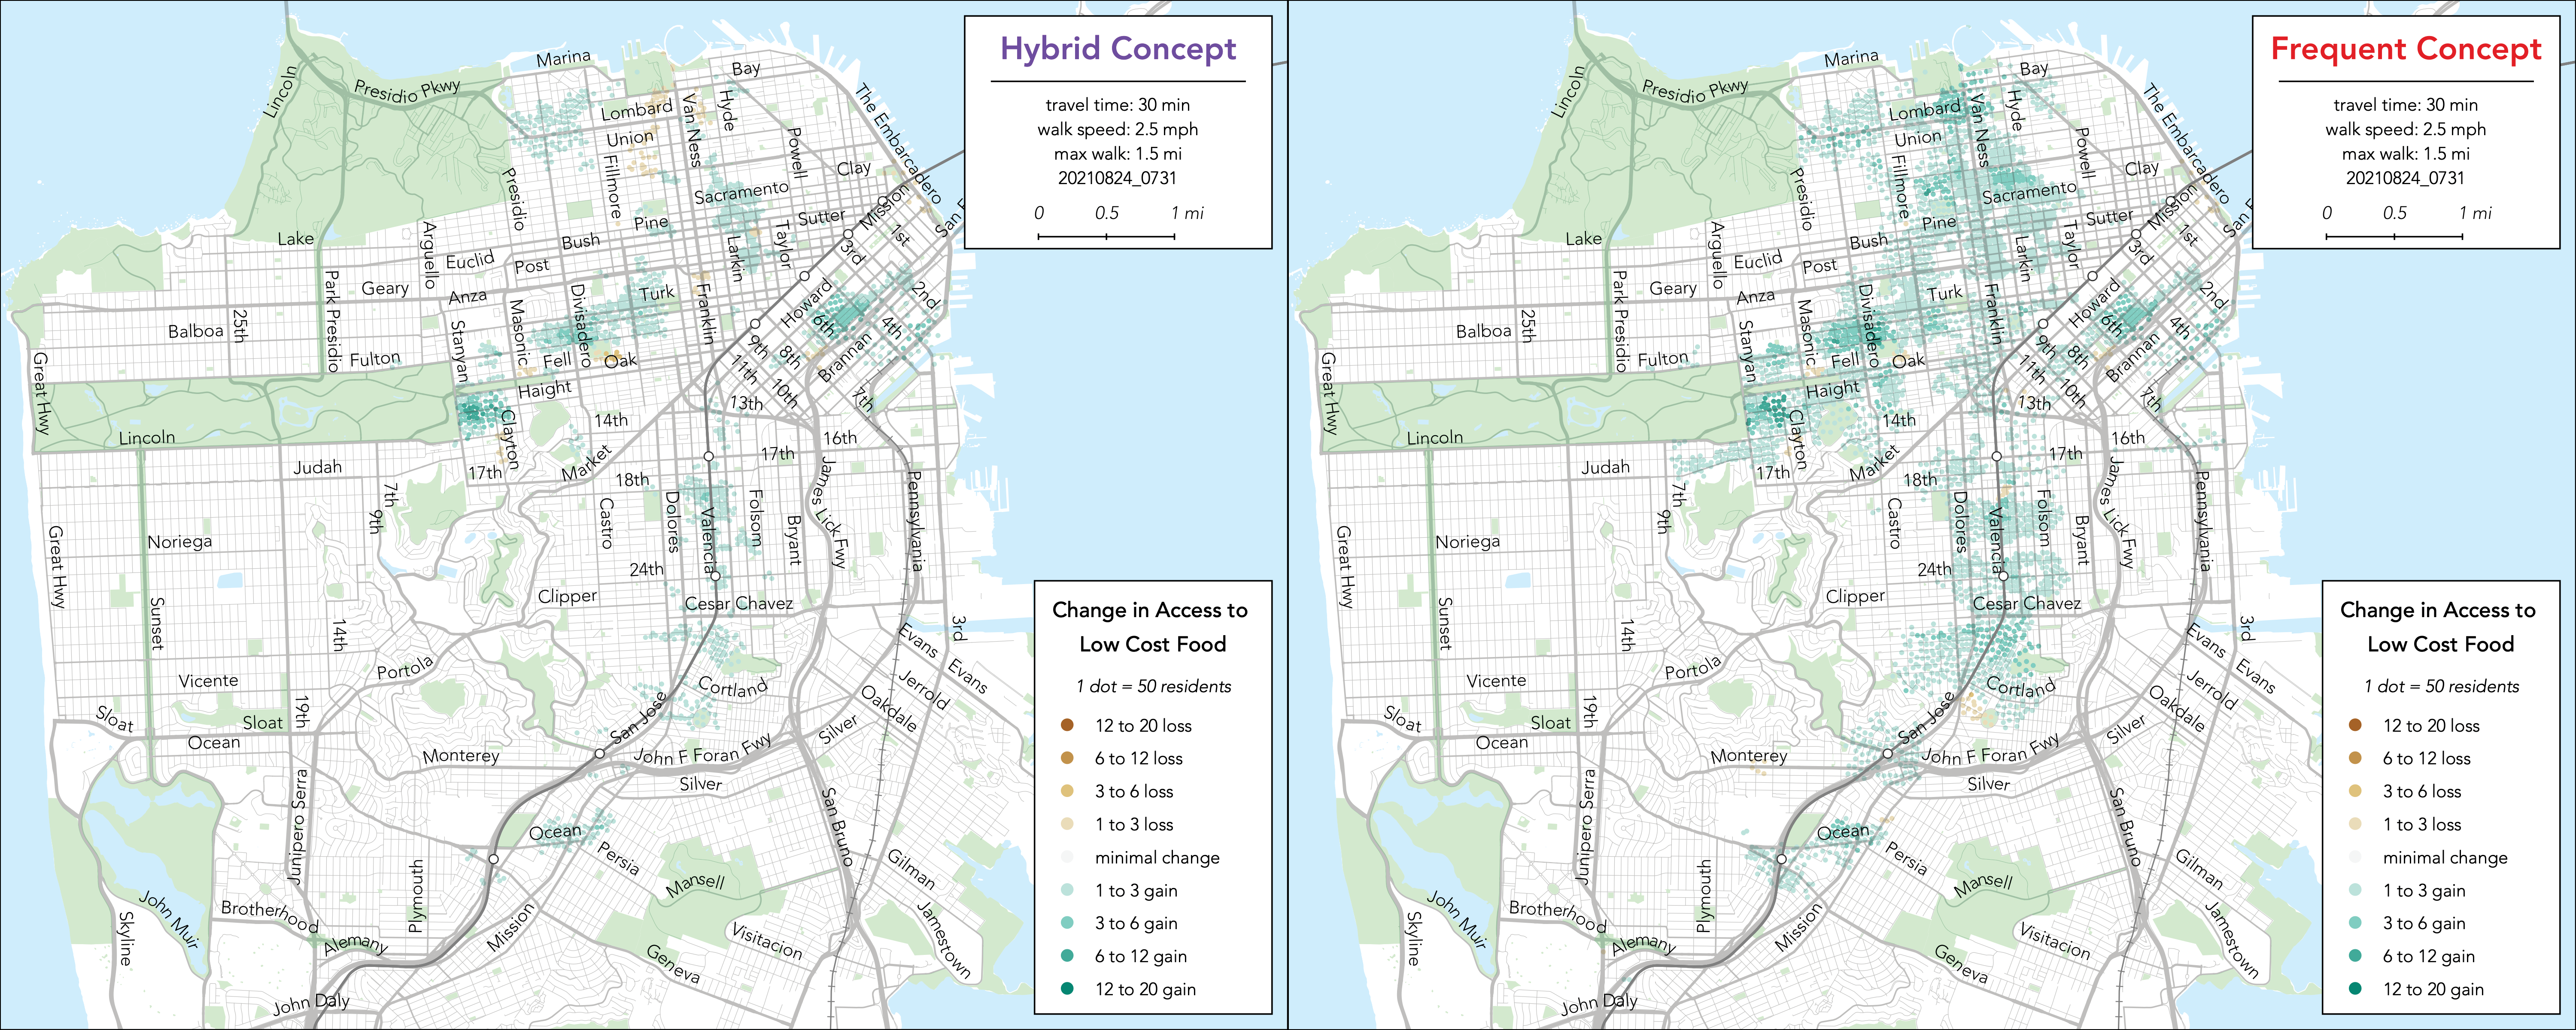
Change in Access to Low Cost Food Locations
Access to Medical Facilities
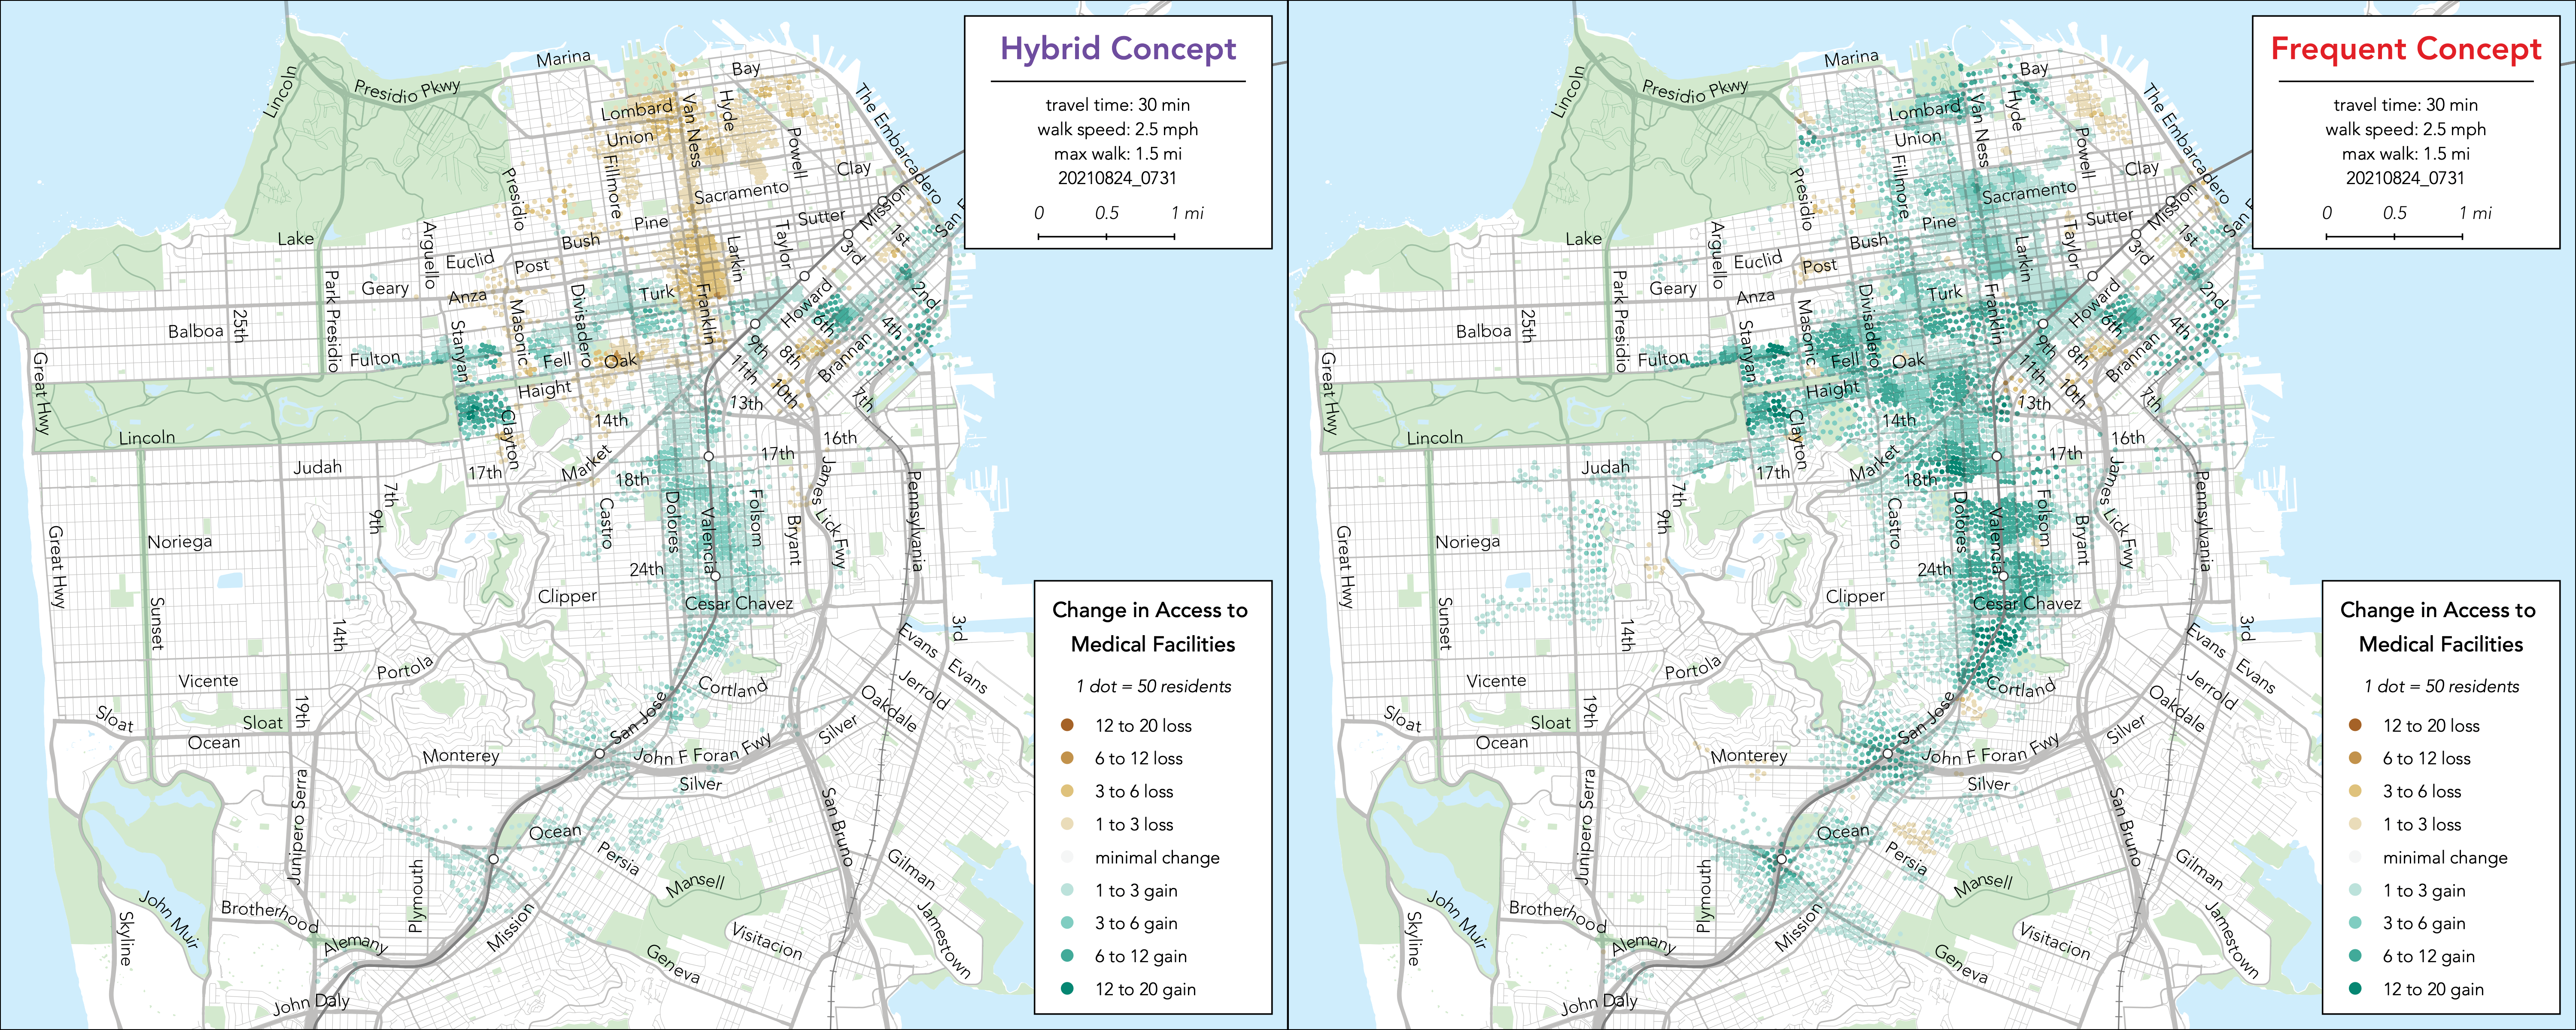
Change in Access to Medical Facilities
Access to Pharmacies
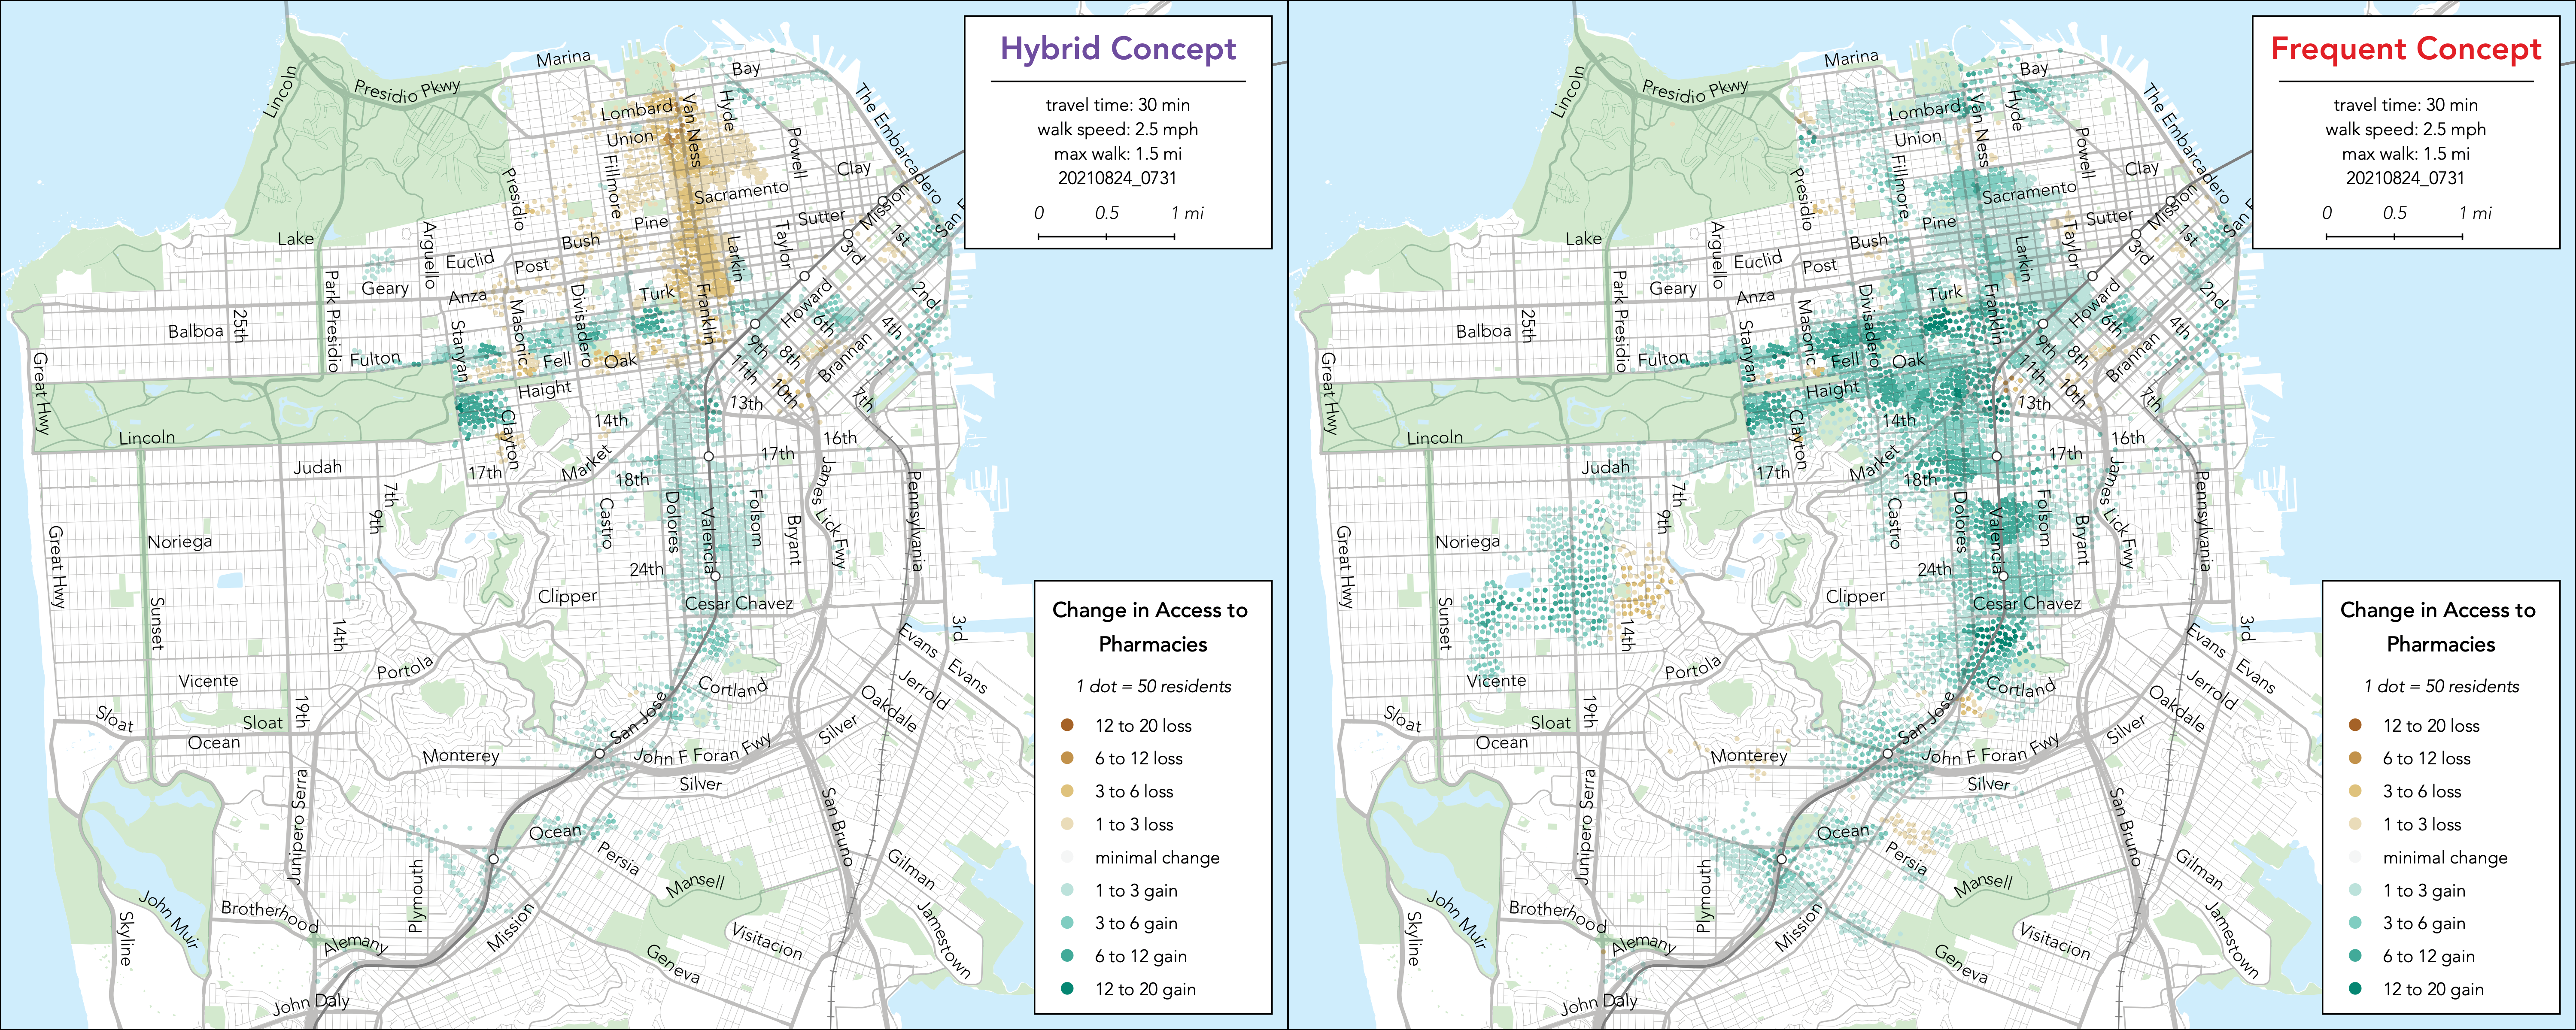
Change in Access to Pharmacies
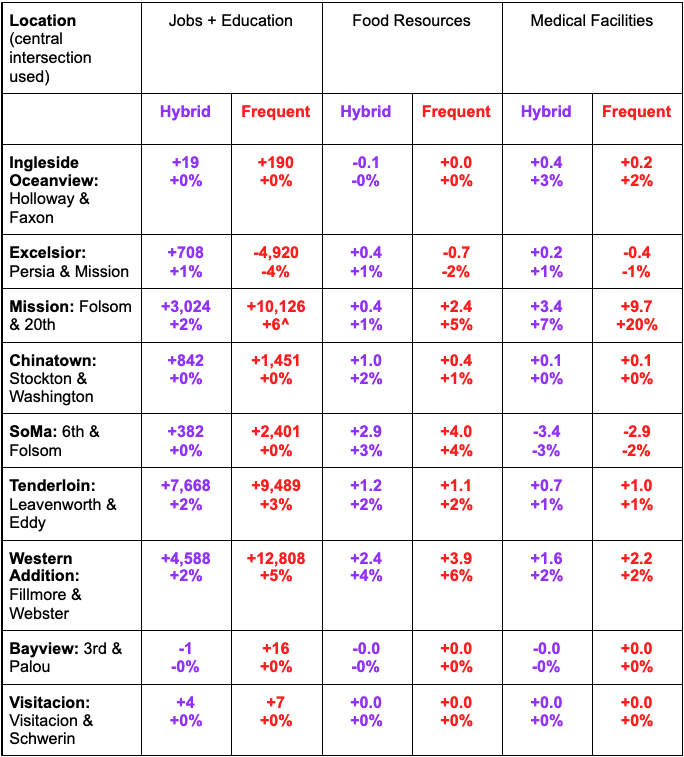
Access from Equity Neighborhoods
In addition to the areas shown previously, it is important to check the change in access from Equity Neighborhoods. The following tables shows the change in access in 30 minutes travel time from each of these areas that have especially high low-income or non-white populations, in each of the two alternatives.
Coverage of Residents and Jobs
Coverage is the number of people who are near transit service. It’s a common way to measure who or what we’ve left behind in any redesign. SFMTA counts people as covered if they are within ¼ mile walk of a bus stop. [check]
Coverage is essentially unchanged in all alternatives. The only exception is that most jobs inside of Fort Mason Center would no longer be within ¼ mile of service in the Frequent alternative.
Availability of High Frequency Service
Frequency is the foundation of what makes transit useful. When buses come very frequently, you know a bus is always coming soon, so you can travel whenever you need to and make easy connections between lines if you need to.
Not long ago, most of San Francisco was covered by lines that ran every 10 minutes or less. Today, SFMTA is committed to expanding the Five Minute Network, where buses come every five minutes all day long, covering the busiest lines all over the city. On the Five Minute network, you should be able to usually see the next bus coming.
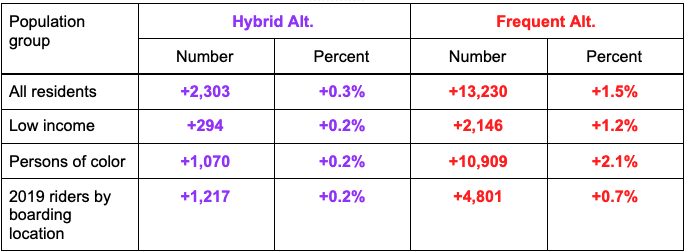
How many more or less of each group are within ¼ mile walk of the Five Minute Network?

People near 5-Minute Network
Note: the only change in the Five Minute Network in the Hybrid alternative is that Van Ness frequency changes from 4 minutes to 6 minutes, removing it from the Five Minute Network.
How many more or less of each group are within ¼ mile walk of ten minute frequency?
People near ten-minute frequency
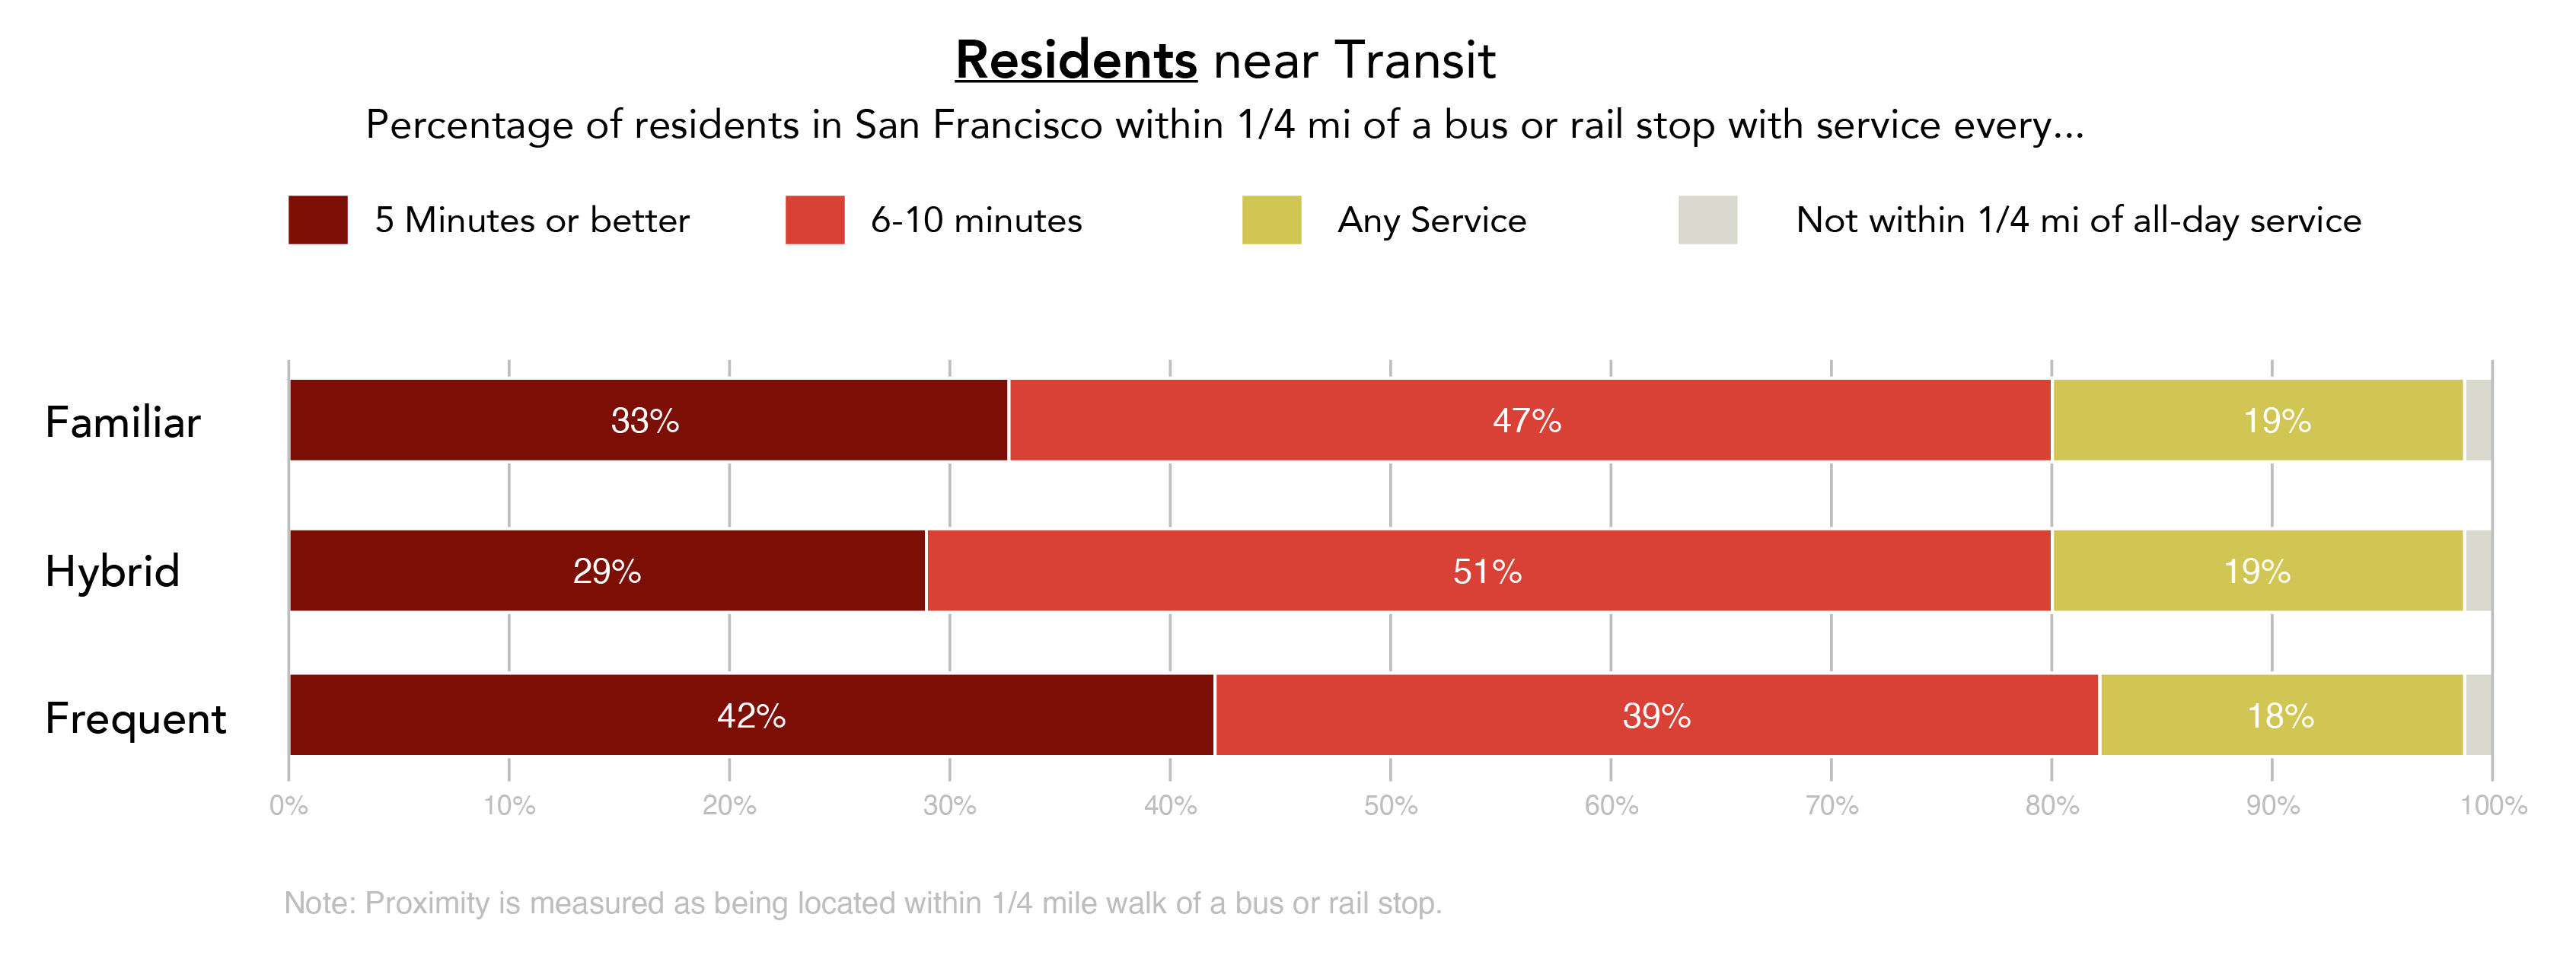
Residents near Transit
We hope all this information helps you figure out your view on which alternative is best. Once you know, please take the survey as soon as possible, and no later than October 1, 2021!