What if we planned public transit with the goal of freedom? Well, it’s hard to improve things that you can’t measure, but now it’s becoming possible to measure freedom, or as we call it in transport planning, access.
Access is your ability to go places so that you can do things. Over the last few years, I’ve come to believe that may be the single most important thing we should be measuring about our transport systems — but that we usually don’t.[1] Access isn’t a new idea, but as our data gets better it’s becoming easier to measure, and it could potentially replace many other measures that are groping toward the idea but not quite getting there.
We calculate access, for anyone anywhere, like this:
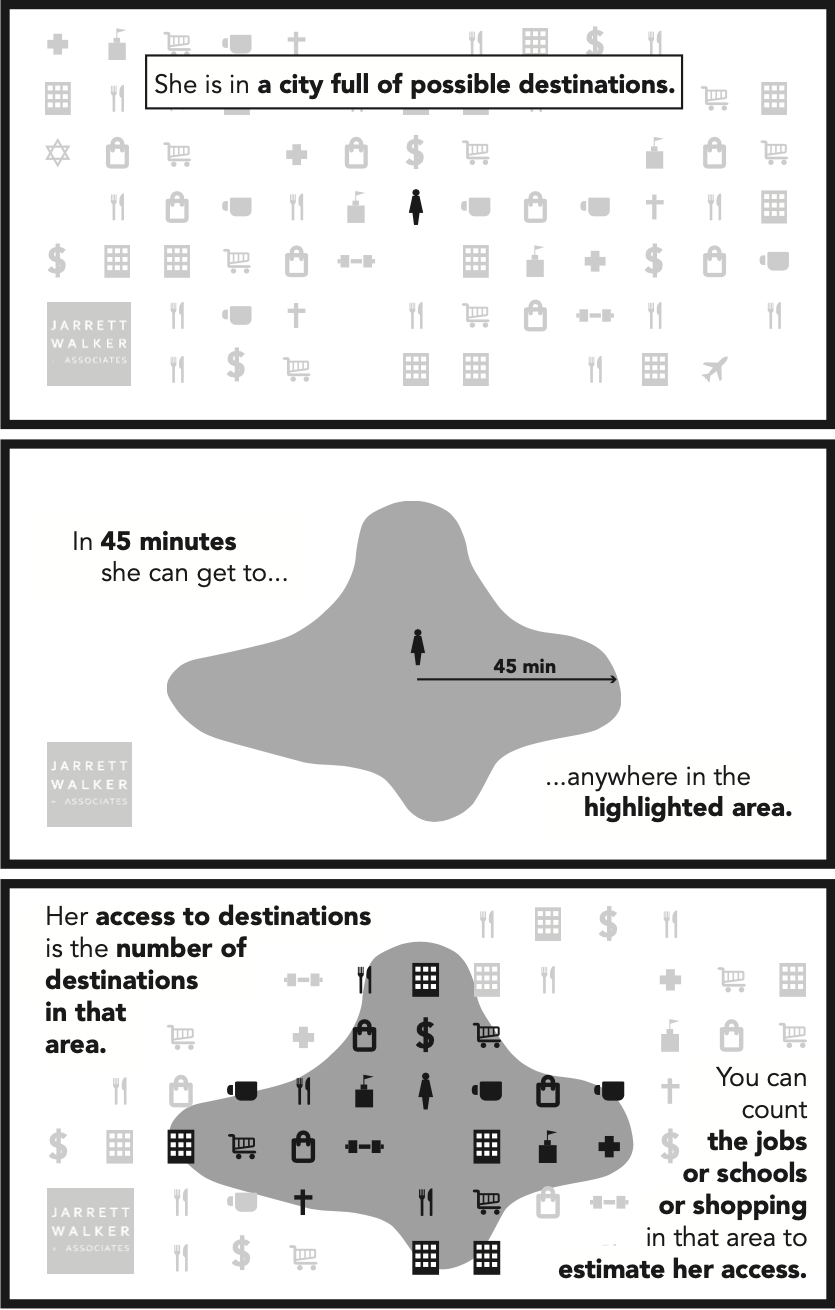
Whoever you are, and wherever you are, there’s an area you could get to in an amount of time that’s available in your day. That limit defines a wall around your life. Outside that wall are places you can’t work, places you can’t shop, schools you can’t attend, clubs you can’t belong to, people you can’t hang out with, and a whole world of things you can’t do.
We chose 45 minutes travel time for this example, but of course you can study many travel time budgets suitable for different kinds of trips. A 45 minute travel time one way might be right for commutes. For other kinds of trips, like quick errands or going out to lunch, the travel time budget is less. For a trip you make rarely it might be more.
But the key idea is that we have only so much time. There is a limit to how long we can spend doing anything, and that limit defines a wall. We can draw the map of that wall, and count up the opportunities inside it, and say: This is what someone could do, if they lived here.
Access is a combined impact of land use planning and transport planning. We can expand your access by moving your wall outward (transport) or by putting more useful stuff inside your current wall (land use). We can use the tool to identify how much of a place’s access problem lies in the transport as opposed to the development pattern.
We can calculate access for any location, as in this example, but we can also calculate the average access for the whole population of any area. In the first draft of our bus network redesign for Dublin, Ireland, for example, we found that the average Dubliner count reach 20% more jobs (and other useful destinations) in 30 minutes. To discuss equity, we can also calculate access for any subgroup of the population: low income people, older or younger people, ethnic or racial groups, and so on.
Why Access Matters
People come to public transit with many goals that seem to be in conflict, but it turns out that a lot of different things get better when we make access better:
- Ridership tends to be higher, because access captures the likelihood that any particular person, when they check the travel time for a trip, will find that the transit trip time is reasonable. Ridership goes up and down for all kinds of other reasons, but access captures how network design and operations affect ridership. [2] In our firm’s bus network redesigns, we’ve been using access as a key measure of success for about five years now, and it consistently leads us to ridership-improving network designs.
- Emissions and congestion benefits all improve, because they depend on ridership, which depends on access.
- Economically, the whole point of a city is to connect people to abundant opportunities. People come together in cities so that more stuff will be inside the wall around their lives. When we measure access we’re measuring how well the city functions at its defining purpose.
- As for equity or racial justice in transit, well, isn’t equal access to opportunity at the core of what these movements are fighting for? Access describes the essence of what has been denied to some groups through exclusionary development planning and exclusionary transport planning, so it helps us quantify what it would mean to fix those things. This, in turn, could help justice struggles avoid a lot of distractions. Because in the end, access is …
- Freedom. Where you can go limits what you can do. If we increase your access, we’ve expanded the options that you have in your life. Isn’t that what freedom is?
When we improve access, with attention to who is benefiting most, we improve all of those things. It’s this remarkable sweep of relevance that makes access analysis so interesting and potentially transformative as a way to think about transportation.
Access Compared to Common Measures
Most methods for studying or improving transit assume that we should care about (a) what people are doing or (b) what people want to do.
Data about what people are doing includes travel behavior data, which are the foundation of much of the accepted methods of transport planning. In public transit, ridership data is in this category. Ridership is the basis for transit’s benefits in the areas of congestion and emissions, and also of fare revenue.
However, what people are doing isn’t necessarily what people want to do, or what they would do if the transport network were better. Much of what people do is just the least-bad of their options given the city and transport network as it is. This problem leads to various methods of public surveying to “find out what people want,” in some sense. But there are lots of problems with that, mostly lying in the fact that people are not very good at knowing what they’d do if the world were different in some major way.
Access takes us outside of both of those frames. Instead of asking “what do people do?” or “what do people want to do?” it asks “what if we expanded what people can do?”
Access analysis does not try to predict what you’ll do. In fact, it doesn’t need to predict human behavior at all, which is a good thing because human behavior is less predictable than we’d like to think. Access calculations are vastly more certain than almost anything emerging from social science research, because they are based almost entirely on the geometric patterns of transport and development. [3]
Instead, access starts with one insight about what everybody wants, even if they don’t use the same words to describe it. People want to be free. They want more choices of all kinds so that they can choose what’s best for themselves. Access measures how we deliver those options so that everybody is more free to do whatever they want, and be whoever they are.
What Access Analysis Can’t Do
Will access analysis of transit put the social sciences and market research out of business? Of course not.
- We need to understand how different users experience public transit, and how the experience can be better designed to meet those various needs.
- We need to know exactly who won’t be served by access based network design so that we can decide what actions to take for those people, if any.
- We need to keep exploring the relationship between access and ridership so that we can identify the factors that sit outside that relationship and must be considered.
- Access analysis would also become more powerful if we had better data on the locations — to within 1/4 mile (400m) or so — of various non-work destinations: retail, groceries, medical, and so on — so that we could better assess people’s ability to get to such places.
But in 30 years of listening to public comment, I’ve heard enough times that people want to go places so that they can do things. So let’s measure how well we’re delivering that, and let’s ask ourselves if that’s more important that some of the things we measure now.
Further Reading
This post could have been much longer; in fact, I hope it will become a book. Meanwhile, here are some great resources:
- On the philosophical issues about freedom vs. prediction, and why it’s important to separate physical knowledge from social science knowledge, see my fun Journal of Public Transportation paper, “To Predict with Confidence, Plan for Freedom.” Seriously, it’s fun.
- The 2020 Transport Access Manual is the first comprehensive explanation of access and how it can be applied to various questions. It’s the work of a team led by professors David Levinson (University of Sydney) and David King (Arizona State University). Full disclosure: I had a role and wrote some snippets.
- The University of Minnesota’s Accessibility Observatory, founded by Levinson and now led by Andrew Owen, is one of the main research centers on the topic. For several years they’ve been publishing Access across America, which are essentially atlases showing where people can get to from various places by car, transit, etc.
- A discussion with transport scholars Alex Karner and Willem Klumpenhouwer regarding the continued value of short-term prediction, summarized in this post of mine and this reply of Willem‘s.
- On what high-access public transit tends to look like, here’s a fairly evergreen 2013 post of mine, with downloadable handout, on how some of the big debates of transit planning line up with a goal of high access for a community.
I will update this post with further links.
Endnotes
[1] In the academic literature, what I’m calling access is usually called accessibility. Both of these words have contested meanings, because both have been used specifically to refer to the needs and rights of people with disabilities. I follow the recent Transport Access Manual in using access as the less confusing of these two words. Of course, we are talking here specifically about spatial access — the ability to do things that require going places — which is not the only kind. However, a lot of the ways that people are cut off from opportunity do turn out to be spatial. Transportation (i.e. access) is a major barrier to employment in the US, for example.
[2] This paper, for example, establishes a relationship between transit access and public transit’s mode share, one that is especially strong for lower income people.
[3] There are exceptions. Traffic congestion, for example, is a human behavior that affects the access calculation.