Click to enlarge: The basic idea of access.
Access is your ability to go places so that you can do things. In this “basics” article, I laid out why I think measuring access would help advance many important goals that appear to be in conflict, and I suggested, for both practical and moral reasons, that public policy should care about what people can do — i.e. their freedom — as opposed to just what we computer-enhanced elites predict people will do.
Many smart people have offered critiques of this idea, or at least of its practical applications. I’m particularly grateful to Alex Karner of UT Austin and Willem Klumpenhouwer of University of Toronto for this conversation, and to Matt Laquidara, who laid out a very thoughtful critique early on. Please point me to others that I may not have seen.
Table of Contents
Two Kinds of Critique
First, let’s distinguish between rhetorical and investigative uses of analysis. In my practice as a consultant, I’m trying to break through into a public conversation, and I’ll do this only with simple explanations of things that obviously matter to people. It’s not wrong for me to oversimplify to make the idea visible and convey its importance. The work can be accurate, as far as it goes, and still be simplified.
So there are two kinds of objections to my thesis:
- those that undermine the fundamental claims of access analysis and
- those that add nuance that could make access analyses more accurate, precise, and/or more relevant in edge cases.
The latter, of course, are not objections at all. They’re just avenues for further development. You’ll see a lot of these throughout this post.
My claims for access analysis
My argument for access analysis is here, but let me quickly list the aspects of my position that seem adjacent to the critiques, and thus most relevant to this response:
- To the extent that we make strong predictions about what humans will do in the future and what outcomes will result, we are assuming that people are not really free. Free people will surprise us. Prediction also appeals to a human desire for control over history that is just not realistic. The future really is unpredictable. (More on this in my Journal of Public Transportation paper here.)
- There are degrees of prediction and the best predictive work makes much softer claims. Prediction of only near-term events, or prediction that speaks only of ranges of probability, is less problematic.
- All analysis is more reliable when it predicts that people will continue to be what they’ve always been throughout history and across cultures. It’s much more problematic assert the permanence of aspects of human society found only in the present, or in the very recent past, or in only one culture (however dominant that culture may be). Again, this is less of an issue for shorter-term predictions.
- Access analysis doesn’t need to be perfect or free of questionable assumptions. It just needs to be much more reliable than predictive modeling. Even if (hypothetically) the two methods turned out to be equal on this score, access analysis would still be preferable because:
- It’s about something that everyone cares about.
- It is correlated to many outcomes that we urgently need our transport system to deliver.
- It is a much more transparent process where the assumptions and their impacts are easy to document, even if they’re controversial.
- When you pile up the assumptions on both sides, access analysis carries a much higher degree of certainty because it isolates geometric, physical, and biological insights and relies on them to the greatest extent possible.
So let’s look at the biggest doubts about access analysis.
Is it good only for commute trips?
Our firm‘s analyses usually focus on trips to work or school, and people routinely object that those aren’t the only kinds of trips. Of course they aren’t. They aren’t even half of all trips.
However, when we think about the most long-term freedoms we need, the freedom to construct our lives and commitments according to our values, the commute (work and school) looms large. Your ability to hold a certain job, or study at a certain school, will do a great deal to define the capabilities you’ll develop, the money you’ll earn, the social networks you’ll be part of, and so on. Those things, in turn, will create the conditions for the freedom or unfreedom that you’ll experience down the line. So when we seek to quantify freedom in the broadest sense, it may be reasonable to put special emphasis on access to work or school.
Commutes are round trips made on a majority of days and that include spending several hours at the destination. They are almost always to work or school. Commutes are easier to analyze than other trips because:
- It’s easy to calculate how many people will value a trip to each destination. While the number of people who want to go to a store will vary with the quality of the store, its competition, and people’s attitudes to it, every job or school enrollment position will be the destination of exactly one resident.
- Data about the location and quantity of jobs and school enrollments are relatively good in developed countries, although there’s still a lot of variation.
- We have a useful rule of thumb about the tolerable travel time for commutes: Marchetti’s constant, the observation that across many historical periods, people have tolerated a one-way commute time of about 30 minutes. This is an example of the principle that if an aspect of human culture been true far into the past and across many cultures, it’s a more reliable basis for positing what freedoms people will continue to value.
Can we look beyond commutes?
But is access analysis good only for commutes?
In our work we do extend the principle to other kinds of trips. In our recent San Francisco work, for example, we calculated access to groceries, low-cost food resources, parks, pharmacies, and medical centers. We have also experimented with more precise pairing of residents and destinations. For example, if we have good data on both income and wages, we can calculate low-income people’s access to low-wage jobs. We can also exclude retired people from the database of people who value the freedom to access work or school opportunities, but include them — or even make specialized calculations for them — when looking at other destinations that tend to matter in a retired person’s life, including groceries, medical, and parks.
When we move beyond the commute, however, the three benefits I listed above are all absent.
- We cannot calculate, for a given person, how much freedom is provided by the ability to go to one park or medical center over another. The tool would be highly reliable for identical destinations, like McDonalds restaurants or whatever, but I think we’d all agree that if you can get to three McDonalds restaurants you don’t really have three times the freedom that comes from being able to get to just one. The freedom value of alternative destinations depends precisely on them being different from another, and we have no hope of abstractly quantifying that value. In San Francisco we inevitably made simplifying assumptions: valuing parks by the acre, for example, and valuing all medical centers the same. For present-oriented analysis you can dig deeper into trip generation patterns, through surveys etc, and refine assumptions, but that works only for analyses meant to be relevant only in the present. This is a genuine weak point for analysis.
- We have lousy data about most nonwork and nonschool destinations. Some of these things change rapidly. Even if we know where they are we usually don’t know their size or intensity.
- It’s harder to assign an acceptable travel time budget for a nonwork and nonschool trip, as I’ll address below, although we can still make educated guesses.
But predictive modeling has all these problems too! Most such modeling relies too heavily on the commute as the primary trip that matters (and on rush hour as the primary time of day that matters). All of the problems of the non-work trip are at best equal for predictive modeling as for access analysis.
Arbitrariness of Time Budgets
When I explain access, I have to start with the isochrone (see image above), the area that a person at a certain location could reach in a fixed amount of time. Thus, in the access analyses that underlie our reports, we usually describe what area could be reached in 30 minute or 45 minutes.
Why 30 and 45 minutes? If we had twelve fingers I’d probably be using 36 and 48.
There are two problems here: (1) We are imposing an obviously arbitrary threshold, valuing a trip that can be made in 29 minutes but not 31, and (2) We are asserting an amount of time that people find acceptable, which requires an explanation. These are interconnected.
How do we know what travel times people tolerate?
Everybody has the same amount of time. There are 24 hours in everyone’s day. When we perceive a travel time as acceptable it’s because it’s an acceptable percentage of the total time available.
You could argue that the perception of time is different in culturally “slow-paced” as opposed to “fast-paced” places, as in the stereotypes of New Orleans and New York, respectively. On the other hand, setting travel time budgets differently based on the dominant culture of a place is itself oppressive, as more and more people live in places where theirs is not the dominant culture.
Meanwhile, economists like to talk about “value of time,” which is about the value of your time to the economy, not to you. That’s definitely not what we should care about here. We’re talking about an equal right to freedom here, and the only way to do that is to posit an equal value of time.
We can plunge into social science research at this point, looking for non-commute equivalents of Marchetti’s constant. How long do people spend going to the grocery store? How long do they spend going to a park? The data will be all over the place, and it will be hard to separate how long people are willing to spend from how long they are forced to spend given their situation. Again, if we can find something that’s been true longer, and over more cultures, we should rely on it more.
But I think we could start with a couple of principles, which I suspect are relatively transcultural and transhistorical:
- We are willing to spend longer traveling if we will spend more time at the destination.
- We are willing to spend longer making a trip we make less often.
We have a finite amount of time in our day, so if we have many commitments, we’ll need to hold down the total percentage of our day spent in travel. So the commute is likely to be the longest trip we’ll make in a typical day, though we may make longer trips less often. Errand trips, lunch trips etc. are likely to need to be shorter than commute trips.
For retired people, diverse errand trips (medical, recreation, shopping) may be able to take longer than for people who spend much of each day at work or school. We need more research about retired people (and other people who are not in school and don’t have jobs) because their tolerable travel time may depend on the fact that their daily time is less scarce, and that some time-saving actions, like walking further to a more frequent bus stop, carry higher disincentives for them.
I think these principles, buttressed by some research, could help us creep toward some reasonable travel time budgets: Marchetti’s constant (30 minutes one way) for commutes, a lower number for typical errands, but possibly a higher number for retired people. Is this all wildly imprecise? Yes. Is it arbitrary? No, we’re not picking numbers out of the air. We have a sense of the right ranges. Now we come to the next problem: While the roughly correct travel time budget is not totally arbitrary, the exact one we use definitely is.
Why 30 minutes? Why not 31?
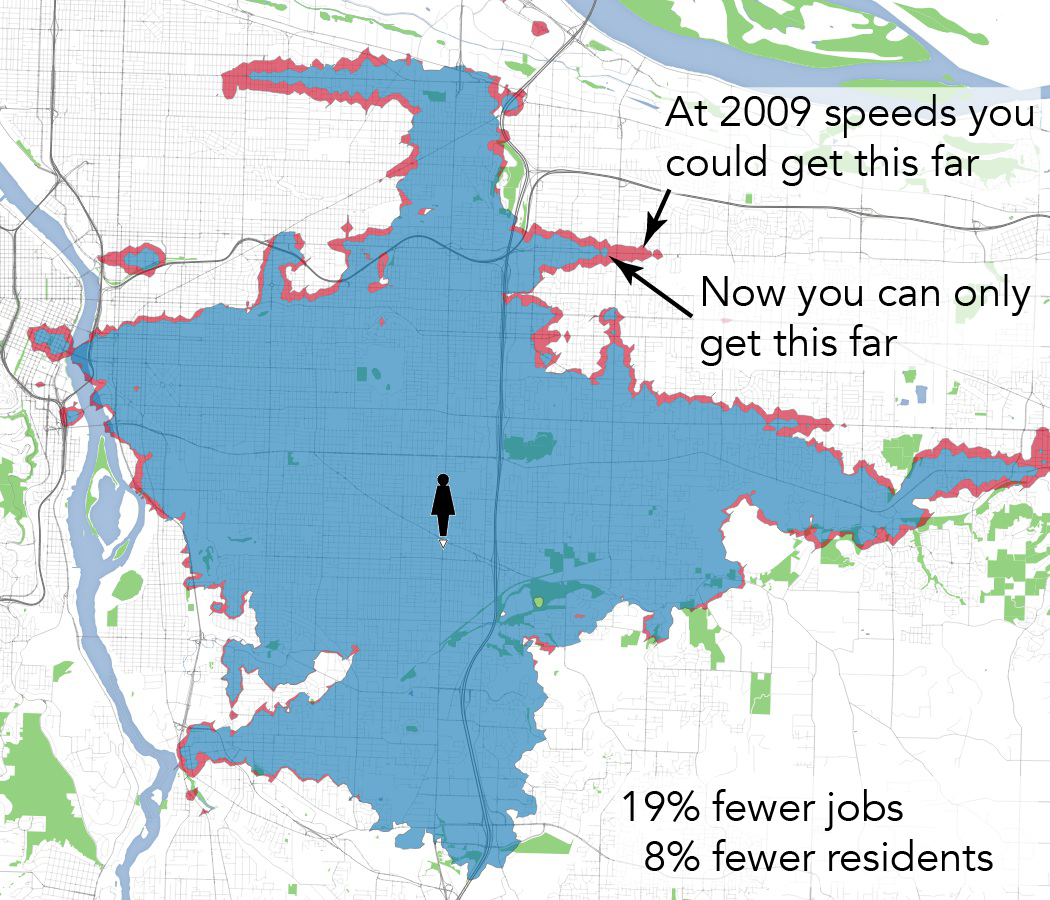
From, our work for Portland Enhanced Transit Corridors project: A person at 82nd & Foster has lost 19% of their 45-minute access to jobs in a decade (2009-19) due to declining bus speeds.
Access analysis starts with an isochrone showing where someone could get to in a fixed amount of time, such as 30 minutes of 45 minutes. But as Matt Laquidara points out, “no one who is willing to take a 45 minute trip is going to consider a destination 46 minutes away totally unreachable.” In a footnote he adds: “Why bound time at all? In theory, it’s possible to have no maximum time and compute the trip duration for every origin, destination, and starting time combination. Those could be aggregated into an average or percentiles.”
Yes, if you could tolerate a given travel time, you could probably tolerate one that’s a minute longer, but you’ll have limits. In growing cities, city bus lines in mixed traffic often slow down very gradually, a classic “boiling frog” event that causes big cumulative damage but never generates a single crisis that would attract attention and action. To a great extent, people who are used to a 45 minute bus ride may accept that it’s 46 the next year and 47 the year after that.
But at some point, they will run out of time in their day. The person whose 45-minute ride is now 55 minutes will eventually give up. They’ll change modes, or quit that job, or do what’s necessary to keep their total daily travel time down. Meanwhile, a new customer who looks up that commute will see a 55 minute travel time, and say no thanks.
So a minute’s difference may not matter, but a 10 minute difference probably does. And to talk about access as freedom, we need to be very approximately right in the travel time budget. Perhaps we’ll get closer if we come up with bell curve of weighted travel time budgets for commutes, maybe peaking at 30 minutes one way but with a long tail stretching upward past 45. This is a reasonable solution to the problem of assigning too much significance to a one-minute difference. But if we get too fancy about how we draw the curve, it takes us back to the same problem. It’s easy to quantify what people are putting up with in terrible situations, but that’s different from what a free person would tolerate. We aren’t describing people’s freedom if we’re relying on data about their unfreedom now.
So some arbitrariness, proudly proclaimed, may be better. For my own rhetorical purposes in presenting and justifying transit service plans, the soundbite and picture take us far: “The average Dubliner can get to 20% more jobs and school enrollments in 30 minutes, and here, let us show how the 30-minute wall around your life changes.” People who hear me say that rarely accuse me of claiming that 30 minutes is radically different from 31. They know I’m making a simplifying assumption so that I can show them something that they can understand, and whose value is obvious to them.
Perils of Aggregation
It’s one thing to analyze all the various kinds of destinations. It’s another more perilous thing to decide how these should be weighed to create a single measure of access. As Matt Laquidara writes:
I’m deeply uncomfortable with most any determination of what locations are important, and consequently, which ones are not. I don’t want to do it myself. I don’t want anyone else deciding it either.
For reasons we explored above, there are always going to be trip desires that are just too scattered, and for which there’s so little data, that they will tend to be omitted in analysis. Residence-to-residence trips are probably one example.
There will also always be the problem that some destinations are hard to quantify. In San Francisco, we assumed that every acre of park was equally valuable in terms of people valuing the freedom to reach it, but of course there are lots of ways to question that, and to introduce other factors such as park infrastructure. Each of those factors would make the measure more precise but also more questionable in terms of how it was projecting some people’s preferences (those who yell loudest at meetings, for example) onto the entire population.
But let’s say that refinements to access analysis make it possible to cover about 95% of trips — or as access analysis would describe it, 95% of the destinations that people will value the freedom to reach. Matt’s objection arises only when we aggregate these different destinations into a single access score. If we declare that one acre of park is worth 0.26 pharmacies, that’s a value judgment. We could try to apply survey data about how much demand each place attracts, which requires assuming that people are making all the trips they want to make. Or we could just stop trying to aggregate, which I prefer. The elected and public audiences with whom I speak usually want to hear separately about each destination type, because each is the basis for a different kind of story and has a nexus with different kinds of public policy. If you care about food security, look at access to groceries. If you care about how much exercise people get, look at access to parks. And so on.
To sum up
- Access analysis is not perfect but can be more reliable than predictive analysis, if only because it makes a more modest claim.
- Predictive modeling requires all the assumptions that access analysis requires, but adds even more assumptions about how human behavior in the future will resemble that in the recent past. Access analysis does not need to include such perilous assumptions.
- We can describe access for commutes with relative confidence. Commutes are a minority of trips but there are a variety of reasons to consider them important.
- Non-commute trips are important but harder to analyze. Still, there’s a basis for making some reasonable assumptions.
- Further work is needed on how to think about freedom of retired people, and more generally about how people’s tolerance for travel time varies with the competing demands on their time. Up to now I’ve been using busy people as the primary frame of reference. This probably contains a bias: I want transit to be useful to busy people, not just to people who enough time that they don’t feel constrained by slow service. Most people are busy.
This post is out there to start arguments, though I hope it also resolves a few. I am not an academic scholar, but I do feel confident in what I asserted in the “my claims” section above, at least until I read the comments, as you certainly should. Then, I may add some updates here.
Much of this discussion of “access” strikes me as related to an idea I’ve heard of in the work of philosophers Martha Nussbaum, and Amartya Sen, of “the capabilities approach”. I think this is behind Sen’s work on the “Human Development Index” – by including women’s literacy and life expectancy along with GDP per capita, he aims to get a better understanding of the broader capabilities that a society gives all its residents, rather than just welfare as measured in wealth.
I like the summary Ingrid Robeyns gives at Crooked Timber:
https://crookedtimber.org/2014/03/06/ca-01-functionings-and-capabilities/
https://crookedtimber.org/2014/03/06/ca-02-the-helicopter-view-what-is-the-capability-approach/
And she’s also written a textbook on it:
https://crookedtimber.org/2017/12/11/the-capability-approach-an-open-access-textbookplus/
I think Matt Laquidara’s critique that an access analysis does not necessarily take into account the ‘probability’ of access throughout the [insert time duration].
Assuming I leave my house at time t, the freedom I have can really vary throughout the day, week, or year depending on travel mode.
So what is the annual probability of access across the 30 min isochrone?
I would argue the annual probability of access across a 30 min isochrone looks fairly stable compared to other modes.
In this sense, we can increase accessible destinations, but also increase the probability of access across time. This gives us multiple levers to increase ‘access’
Edit: I would argue the annual probability of access across a 30 min isochrone (for a personal vehicle) looks fairly stable compared to other modes.
An interesting post, and quite thought-provoking. Since you invited comment, let me offer another ‘Doubt’:
An access analysis mostly ignores alternative modes, and those alternative modes affect the utility of transit.
In your earlier post, you compare the outer limit of the isochrone to a wall – the limit of a person’s opportunities within an area. But is it really a wall? Unless the mode you’re looking at (like transit) is that person’s only mobility option, that isochrone doesn’t describe the limits of their freedom. Just their limit using that particular mode. They can still get to many points both within and outside of that wall using other modes. For most people in most places in the U.S., that irregular ‘blob’ representing our riders’ range of access using transit sits along and within several other blobs that represent isochrones using other modes.
For better or worse, for most Americans in most places the transit isochrone is contained almost entirely within the isochrone for a private passenger car. The vast majority of destination pairings inside those isochrone blobs are reachable by multiple modes. That’s certainly true for most destinations outside of a CBD, and ant most times outside of rush hour. Apart from the peak hour commute, this measure of ‘access’ isn’t describing a person’s range of freedom, but the range in which they have options.
So a big part of the utility/usefulness/value of a transit improvement to your hypothetical rider doesn’t just lie in getting access to places she couldn’t before. It lies in having a different option to get to places she already could get to. So whether a transit improvement *gets used* isn’t going to track nearly as closely to the mere number of locations it connects, but rather whether the transit improvement offers something of value to riders that is better than the alternative means of getting between those two places. It might be cheaper, faster, more comfortable, more flexible, more reliable, subsidized, more convenient or what have you – but the ridership decision is based on choice, not access or freedom.
Yes, the particular characteristics of the U.S. aren’t universal. It’s entirely possible that access analysis might be the best way of evaluating transit systems for all those Borts out there. But in a country where only 9% households don’t have a car, transit is mostly about offering an alternative mode to a destination, not a new one
Does predictive analysis take into account mode alternatives?
For it to be better in this regard, it would have to calculate the car ownership rates, and then predict future car ownership rates. But car ownership rates are influenced by various things, including transit access. If you can get “everywhere” using transit, then you are way less likely to own a car (or a second car, as the case may be). This means that predictive analysis is dependent on access analysis, which suggests the latter is a better starting point.
I definitely agree that access analysis is much better than predictive analysis. Showing where someone will be able to get within an arbitrary time limit, such as 30 or 45 minutes, is good for it simplicity, which makes it very useful for communication with the average rider. But for planning a network redesign, you need more advanced methods so that you don’t end up with a result where the travel time will decrease from 31 to 30 minutes for some people but increase from 31 to 60 minutes for others. Also remember that reducing some people’s travel time from, say 20 to 10 minutes, is valuable to, but perhaps not as much as reducing other people’s travel time from 40 to 30 minutes.
I believe it’s important to consider how to measure travel time. People value different kinds of travel time differently, and it should be taken into account. For example, people tend to prefer time spend in vehicle rather than time spend waiting at the stop, and many people prefer a direct trip even if it takes a few minutes longer. Many models use some kind of weighted travel time, and that’s a good thing.
In your network redesign projects, you usually analyze changes in average travel time. Average travel time is not relevant when you need to be at your destination at a specific time, such as most trips towards (not from) work or school (except flex-time jobs). For example, let’s say that you transfer between two 10-minute routes that are scheduled to arrive at the transfer stop at the same time. Assuming that both buses are equally likely to arrive first, average waiting time will be 5 minutes, but that’s not relevant for these kind of trips, you have to be prepared to wait 10 minutes.
It is possible to weight different elements of the trip differently. But the problem is, doing so requires assumptions about human behavior, which may or may not be true depending on the individual. Simply focusing on total travel time is simpler.
There are some people who will choose a trip with longer overall time in order to trade walking or waiting for time sitting on a bus, but there are plenty of reasons for people to not do so. Walk time, you at least have some control, meaning that if you need to, you can walk faster. Wait time, you also have some control if you able to control your schedule to arrive at the stop just before the bus runs, rather than just show up at some random time and wait. But, the ride time, once you’re on board, is completely out of your control. If a bus takes 30 minutes to crawl 3 miles, nothing you do can ever get you those three miles in under 30 minutes, no matter how fast you walk or how precisely you time your schedule. It is also true that some people get motion sickness riding a bus, which they don’t get while walking or waiting.
It is also total travel time that answers the all-important question of what time do you need to leave to arrive at the destination on time. Ride quality of various segments is irrelevant.
From a transit planning perspective, introducing bias towards in-vehicle time over walk time and wait time encourages routes that detour into parking lots or transit centers, or have unnecessary jog-around-the-block’s, in order to convert walk/wait time into ride time for some riders, at the cost of increasing overall travel time for everyone else. The most popular bus routes, by contrast, are usually very simple – just run the bus in a straight line down a major arterial street. Everywhere the street goes, the bus goes. It is these straight, simple routes we need more of. It’s when agencies try to overthink things and imagine specific destinations that people are trying to get to and tailor the routes to those destinations that loopy routes result, and loopy routes are usually poorly ridden.
Thanks for the shout out!
My paragraph about bounding time was, upon reflection, not constructed very well. It was not meant to dispute the merit of strictly bounding time, but to contrast bounding time with using a strict bounding threshold for determining how many times of day a destination can be reached before it is considered “reachable” in an isochrone. I was trying to anticipate the argument of “well if you allow a strict cut off for travel time, why are you objecting to a strict cut off point for counting a destination as reachable?”. In my analyses I strictly bound travel time, but represent every location as probabilistically reachable (based on the number of minutes of the day it is reachable within the time bound) rather than binarily reachable or not. In attempting to explain this apparent discrepancy, I think I came across as arguing a point about time bounds that I don’t actually believe.
The footnote asks why time should be bounded at all not to suggest it never should be, but to motivate that there is a high computational cost of not bounding it. There is a benefit of computing without a time bound. It allows an overall assessment of the change in travel time that will be absent in a collection of isochrones. But computing without a time bound also generates the data to create isochrones for any duration! These ischrones are still very important, perhaps more so than the overall travel time aggregation. An idea would be to use an aggregation as an overall signal of change while having the flexibility to “zoom in” to isochrones of arbitrary durations. The problem is that it is going to massively increase the computational time when doing an analysis that creates isochrones from hundreds of thousands of starting points.
All this is to say, I don’t intend to question the wisdom of a time bound; I use them extensively and I think they’re critical for both comprehensibility and computational tractability. I intended to question the reasoning behind presenting access using an isochrone map that doesn’t provide a visual indication of how many times of day exist where can leave one’s origin point and reach that point within the time bound. Computationally they’re no more work than any isochrone that uses schedule data and not headway approximations. Understanding the temporal flexibility that I have to reach destinations within my “wall” is critical to my process of assessing how much freedom I have. A map that contains that information is more useful to me than a map that treats reachability within a time bound as a binary proposition, in spite of the increased complexity of it. Is that added complexity simply not worth it when addressing a broader audience?
I have some thoughts on aggregation too, but I’ll follow up with that later.
This “My Claims” section of this post was updated on Oct 26 to reflect some good early comments.
This piece is amazing. There is a typo. “do what’s necessary to keep their total daily travle time down” It should be travel, not travle.
Fixed, tx
By looking on the network maps (current and suggested), and isochrone maps, people can evaluate a lot of things you cannot derive from the available data, especially when the available data is limited and/or unreliable, both issues being relatively common.
This is where predictive modelling is completely helpless. As a complex mathematical instrument, any model which has unreliable/incomplete data as an input will return output that would be nonsense by default.
In this respect, isochrone analysis is truly superior: its outputs may lack descriptions and even quantification but they are still reasonably reliable and they can be interpreted by the locals who have their internal understanding of the place where they live, and eventually provide insightful and reliable feedbacks to the planners.
Very good thoughts and analysis, you may say you are “…not an academic scholar,…” however there is more practicality in this discussion than anything I’ve seen from the “academics”. Access analysis is critical, and the value of travel time is a key input to the analysis. Retired folks have a lower value of transit time but a higher value of walk to stop distance. That said we also don’t want retired folks headed to medical or simple shopping trips to travel all over the place. All is insightful analysis and I, for one, welcome the discussion.
“Access analysis doesn’t need to be perfect or free of questionable assumptions. It just needs to be much more reliable than predictive modeling.”
I don’t see that as being necessary. There are two different models. If they differ in terms of the numbers they generate, then a trained professional (or set of professionals) should argue which is better, and why (for that particular case). In that regard, it is like predicting the weather. The weather forecasts are made by comparing several different models. If they all line up, that’s the prediction. But often they don’t, and a judgment call is made. I find that I can get the best handle on things by reading the forecast discussion, which goes into all that (https://a.atmos.washington.edu/data/disc_report.html). This gives people a much better idea of the confidence that meteorologists have for the weather forecast (which is often very little). The more models, the better.
There is a clear benefit to access analysis, which goes beyond ridership numbers. It allows people to see how things will change if a particular action is taken. This is especially useful if comparing different proposals. Ideally, the maps would be more interactive. You could pick a point, then pick a time, and see all the places you can access within that time. If you are debating different proposals, this is especially useful. I could imagine linking to access maps while pointing out the advantages of one proposal over the other. The predictive model might downplay access to a particular area (e. g. an area with a lot of nightlife) or ignore the fact that a relatively dense neighborhood just got a huge increase in access (suggesting a lot of people in that neighborhood will stop using cars). With an access model, you can tease all of that out.
Just how good is predictive modeling? In other words, how often does it nail it, and how often does it fail, miserably? To continue my comparison to weather forecasting, the models are extremely reliable within 3 days. Outside of a week, you might as well base it on the climate (e. g. it will be cold and wet in Seattle in December).
Where, on this scale, does predictive modelling sit? Or, to put it another way, what are some of the big failures with predictive modeling? How often did they greatly exaggerate the results, and how often did they underestimate them? When it did fail, does it look like an access model would have done better?
One important consideration of Access is how long transit service runs until. This interactive map shows Vancouver transit at different times of day.
https://tmaps.org/
For example from 7pm to 8pm transit service drops significantly, and is the most visible in Surrey.
I do take your point that the problem of a privileged group deciding what is important, and its degree, is lessened when there is not a single score being created through aggregation. I don’t think it’s quite enough for me to completely put my objection to rest.
A decision maker asking for separate access measurements for a variety of destinations is still performing aggregation, in my view. Ultimately they have to take the measurements they are given and aggregate them into a binary decision about the change. My fear is that a person can become anchored by the information that they’re presented with, or think to ask about. They’ll be biased by the inputs, though perhaps not to the degree that a machine would be.
Because of that, I want to to present that decision maker with a numeric score that does not give any weight to the importance to destinations. A visual of an ischrone is extremely useful, but it’s hard to compare a change in a the size of an area on a map (particularly if that area is actually a 2-dimensional probability distribution) against a percentage increase in jobs reached, for example.
I believe that a score that eschews designating important destinations represents that something that a collection of important destinations derived from reasonable assumptions about human needs and customs doesn’t. The times when I have felt the most joy in life rarely have involved important destinations. They’ve disproportionately been firsts, spontaneous decisions made late at night, meandering trips to unplanned destinations with significant people. Thus, I want a measurement that rewards expanding the area that people can reach quickly and often, not just so that they can access important destinations, but so that they have a greater boundary in which they can explore and find new things that bring them joy. That’s the purpose of what I’ve built and described in my post.
If a decision maker asks about access to jobs, schools, groceries, or some other essential priority I’m not averse to computing and presenting it. I’d be incredibly naive if I didn’t recognize the special position that those have in human life. I just feel it’s unfortunate that access to these things is not presented, in comparable terms, alongside how much a change simply changes the area that a person can reach quickly.
I hope that in my initial post and these comments I have not portrayed myself as an opponent of access measurement (or a booster of predictive analysis over it). I wouldn’t consider myself a critic or a doubter; I consider what I have built to be a particular implementation of an access measurement. At the same time I don’t see my objections as fitting cleanly into the two kinds of objections in your post. I don’t reject access measurements, but I don’t think my objections are satisfied by access measurements with a more nuanced understanding of what people are seeking to reach. If anything, I’m pushing for less nuance around that and simply making a case for numerically measuring the expansion or contraction of reachable space. I don’t it’s the only thing a decision maker should look at, but to me capturing the ability to spontaneously explore is vitally important, and it needs to be presented so that it enters the mental aggregation that a decision maker performs.
Rather than leaning into the wind, does the wind blow in a certain direction with purpose? In other words, what’s the history of predictive modeling and what can be leveraged for access analysis? Perhaps that’s what you are trying to do with this blog, but why not sort through the history before changing direction?
Access analysis assumes there is capacity to move on transit. What happens when that assumption breaks down when buses are crowded currently or in the future? Maybe more intuitively, what if a desert city tried to expand without attempting to forecast water consumption?
Access analysis can ultimately incorporate many of the ways that systems break down. You’re right, too, that projections of population growth are needed to right-size future infrastructure and services, and/or identify fixed limits to growth. Within those scenarios, though, we’d be incline to optimize for access rather than just predicted behavior.
This exchange made me think, particularly of “overtime” trips. In the 1950’s our family dentist — who was excellent by the standards of the day — relocated from Portland to Vancouver, Washington. We had a car ride one-way and the return trip from McLoughlin Heights to Irvington was about a 1½ to 2 hour trip on Vancouver City Lines, Vancouver-Portland Bus Company, Portland Traction’s lightning-fast Interstate Avenue trolley coaches, and their Broadway motor coaches. No free transfers between companies. Both of us boys ended up in the transit business but I think that our mother was glad to keep those expeditions to a minimum.
Now, as a retiree I have a one-hour, two bus ride to my dentist. I had started with that office when it was walk distance from my house and about 25 minutes on one bus from work.
In Denver’s Sun Valley low-income neighborhood the opening of a subsidized grocery is being celebrated as ending its status as a ‘food desert’. RTD’s Rte 9 through the neighborhood had a 30-minute headway prior to the pandemic and serves two King Soopers (Kroger) and a Walmart within ten to twenty minutes running time, depending on which store. That was not mentioned explicitly in the news article but what was mentioned was the long bus ride one woman makes weekly to shop in her ethnic group’s specialty grocery. I’m familiar with the details from my time helping an ESL class in that neighborhood and it’s a 55-minute trip including a 1/3 mile walk onto a ten-minute pandemic headway.
These sorts of trips are difficult to categorize but must be kept in mind.