Access

Some Doubts about Access Analysis

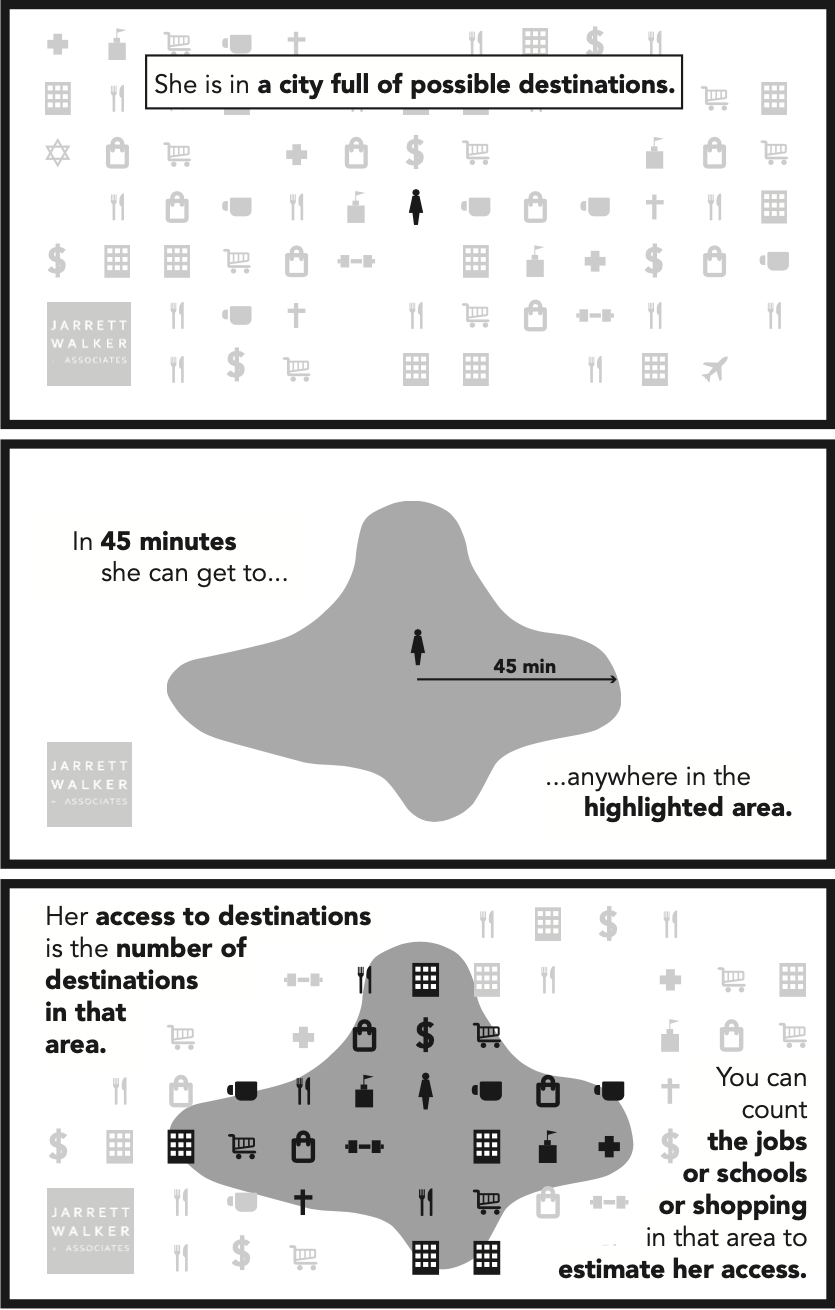
Click to enlarge: The basic idea of access.

Access is your ability to go places so that you can do things.  In this “basics” article, I laid out why I think measuring access would help advance many important goals that appear to be in conflict, and I suggested, for both practical and moral reasons, that public policy should care about what people can do — i.e. their freedom — as opposed to just what we computer-enhanced elites predict people will do.

Many smart people have offered critiques of this idea, or at least of its practical applications.  I’m particularly grateful to Alex Karner of UT Austin and Willem Klumpenhouwer of University of Toronto for this conversation, and to Matt Laquidara, who laid out a very thoughtful critique early on.  Please point me to others that I may not have seen.

Two Kinds of Critique

First, let’s distinguish between rhetorical and investigative uses of analysis.  In my practice as a consultant, I’m trying to break through into a public conversation, and I’ll do this only with simple explanations of things that obviously matter to people.  It’s not wrong for me to oversimplify to make the idea visible and convey its importance.  The work can be accurate, as far as it goes, and still be simplified.

So there are two kinds of objections to my thesis:

  • those that undermine the fundamental claims of access analysis and
  • those that add nuance that could make access analyses more accurate, precise, and/or more relevant in edge cases.

The latter, of course, are not objections at all.  They’re just avenues for further development.  You’ll see a lot of these throughout this post.

My claims for access analysis

My argument for access analysis is here, but let me quickly list the aspects of my position that seem adjacent to the critiques, and thus most relevant to this response:

  • To the extent that we make strong predictions about what humans will do in the future and what outcomes will result, we are assuming that people are not really free.  Free people will surprise us.  Prediction also appeals to a human desire for control over history that is just not realistic.  The future really is unpredictable.  (More on this in my Journal of Public Transportation paper here.)
  • There are degrees of prediction and the best predictive work makes much softer claims.  Prediction of only near-term events, or prediction that speaks only of ranges of probability, is less problematic.
  • All analysis is more reliable when it predicts that people will continue to be what they’ve always been throughout history and across cultures.  It’s much more problematic assert the permanence of aspects of human society found only in the present, or in the very recent past, or in only one culture (however dominant that culture may be).  Again, this is less of an issue for shorter-term predictions.
  • Access analysis doesn’t need to be perfect or free of questionable assumptions. It just needs to be much more reliable than predictive modeling.  Even if (hypothetically) the two methods turned out to be equal on this score, access analysis would still be preferable because:
    • It’s about something that everyone cares about.
    • It is correlated to many outcomes that we urgently need our transport system to deliver.
    • It is a much more transparent process where the assumptions and their impacts are easy to document, even if they’re controversial.
  • When you pile up the assumptions on both sides, access analysis carries a much higher degree of certainty because it isolates geometric, physical, and biological insights and relies on them to the greatest extent possible.

So let’s look at the biggest doubts about access analysis.

Is it good only for commute trips?

Our firm‘s analyses usually focus on trips to work or school, and people routinely object that those aren’t the only kinds of trips.  Of course they aren’t.  They aren’t even half of all trips.

However, when we think about the most long-term freedoms we need, the freedom to construct our lives and commitments according to our values, the commute (work and school) looms large.  Your ability to hold a certain job, or study at a certain school, will do a great deal to define the capabilities you’ll develop, the money you’ll earn, the social networks you’ll be part of, and so on.  Those things, in turn, will create the conditions for the freedom or unfreedom that you’ll experience down the line.  So when we seek to quantify freedom in the broadest sense, it may be reasonable to put special emphasis on access to work or school.

Commutes are round trips made on a majority of days and that include spending several hours at the destination. They are almost always to work or school.  Commutes are easier to analyze than other trips because:

  • It’s easy to calculate how many people will value a trip to each destination.  While the number of people who want to go to a store will vary with the quality of the store, its competition, and people’s attitudes to it, every job or school enrollment position will be the destination of exactly one resident.
  • Data about the location and quantity of jobs and school enrollments are relatively good in developed countries, although there’s still a lot of variation.
  • We have a useful rule of thumb about the tolerable travel time for commutes: Marchetti’s constant, the observation that across many historical periods, people have tolerated a one-way commute time of about 30 minutes.  This is an example of the principle that if an aspect of human culture been true far into the past and across many cultures, it’s a more reliable basis for positing what freedoms people will continue to value.

Can we look beyond commutes?

But is access analysis good only for commutes?

In our work we do extend the principle to other kinds of trips.  In our recent San Francisco work, for example, we calculated access to groceries, low-cost food resources, parks, pharmacies, and medical centers.   We have also experimented with more precise pairing of residents and destinations.  For example, if we have good data on both income and wages, we can calculate low-income people’s access to low-wage jobs.  We can also exclude retired people from the database of people who value the freedom to access work or school opportunities, but include them — or even make specialized calculations for them — when looking at other destinations that tend to matter in a retired person’s life, including groceries, medical, and parks.

When we move beyond the commute, however, the three benefits I listed above are all absent.

  • We cannot calculate, for a given person, how much freedom is provided by the ability to go to one park or medical center over another.   The tool would be highly reliable for identical destinations, like McDonalds restaurants or whatever, but I think we’d all agree that if you can get to three McDonalds restaurants you don’t really have three times the freedom that comes from being able to get to just one.  The freedom value of alternative destinations depends precisely on them being different from another, and we have no hope of abstractly quantifying that value.  In San Francisco we inevitably made simplifying assumptions: valuing parks by the acre, for example, and valuing all medical centers the same.  For present-oriented analysis you can dig deeper into trip generation patterns, through surveys etc, and refine assumptions, but that works only for analyses meant to be relevant only in the present.  This is a genuine weak point for analysis.
  • We have lousy data about most nonwork and nonschool destinations.  Some of these things change rapidly.  Even if we know where they are we usually don’t know their size or intensity.
  • It’s harder to assign an acceptable travel time budget for a nonwork and nonschool trip, as I’ll address below, although we can still make educated guesses.

But predictive modeling has all these problems too!  Most such modeling relies too heavily on the commute as the primary trip that matters (and on rush hour as the primary time of day that matters).  All of the problems of the non-work trip are at best equal for predictive modeling as for access analysis.

Arbitrariness of Time Budgets

When I explain access, I have to start with the isochrone (see image above), the area that a person at a certain location could reach in a fixed amount of time.  Thus, in the access analyses that underlie our reports, we usually describe what area could be reached in 30 minute or 45 minutes.

Why 30 and 45 minutes?  If we had twelve fingers I’d probably be using 36 and 48.

There are two problems here: (1)  We are imposing an obviously arbitrary threshold, valuing a trip that can be made in 29 minutes but not 31, and (2) We are asserting an amount of time that people find acceptable, which requires an explanation.  These are interconnected.

How do we know what travel times people tolerate?

Everybody has the same amount of time.  There are 24 hours in everyone’s day.  When we perceive a travel time as acceptable it’s because it’s an acceptable percentage of the total time available.

You could argue that the perception of time is different in culturally “slow-paced” as opposed to “fast-paced” places, as in the stereotypes of New Orleans and New York, respectively.  On the other hand, setting travel time budgets differently based on the dominant culture of a place is itself oppressive, as more and more people live in places where theirs is not the dominant culture.

Meanwhile, economists like to talk about “value of time,” which is about the value of your time to the economy, not to you.  That’s definitely not what we should care about here.  We’re talking about an equal right to freedom here, and the only way to do that is to posit an equal value of time.

We can plunge into social science research at this point, looking for non-commute equivalents of Marchetti’s constant.  How long do people spend going to the grocery store?  How long do they spend going to a park?  The data will be all over the place, and it will be hard to separate how long people are willing to spend from how long they are forced to spend given their situation.  Again, if we can find something that’s been true longer, and over more cultures, we should rely on it more.

But I think we could start with a couple of principles, which I suspect are relatively transcultural and transhistorical:

  • We are willing to spend longer traveling if we will spend more time at the destination.
  • We are willing to spend longer making a trip we make less often.

We have a finite amount of time in our day, so if we have many commitments, we’ll need to hold down the total percentage of our day spent in travel.  So the commute is likely to be the longest trip we’ll make in a typical day, though we may make longer trips less often.  Errand trips, lunch trips etc. are likely to need to be shorter than commute trips.

For retired people, diverse errand trips (medical, recreation, shopping) may be able to take longer than for people who spend much of each day at work or school.  We need more research about retired people (and other people who are not in school and don’t have jobs) because their tolerable travel time may depend on the fact that their daily time is less scarce, and that some time-saving actions, like walking further to a more frequent bus stop, carry higher disincentives for them.

I think these principles, buttressed by some research, could help us creep toward some reasonable travel time budgets:  Marchetti’s constant (30 minutes one way) for commutes, a lower number for typical errands, but possibly a higher number for retired people.  Is this all wildly imprecise?  Yes.  Is it arbitrary?  No, we’re not picking numbers out of the air.  We have a sense of the right ranges.  Now we come to the next problem:  While the roughly correct travel time budget is not totally arbitrary, the exact one we use definitely is.

Why 30 minutes?  Why not 31?
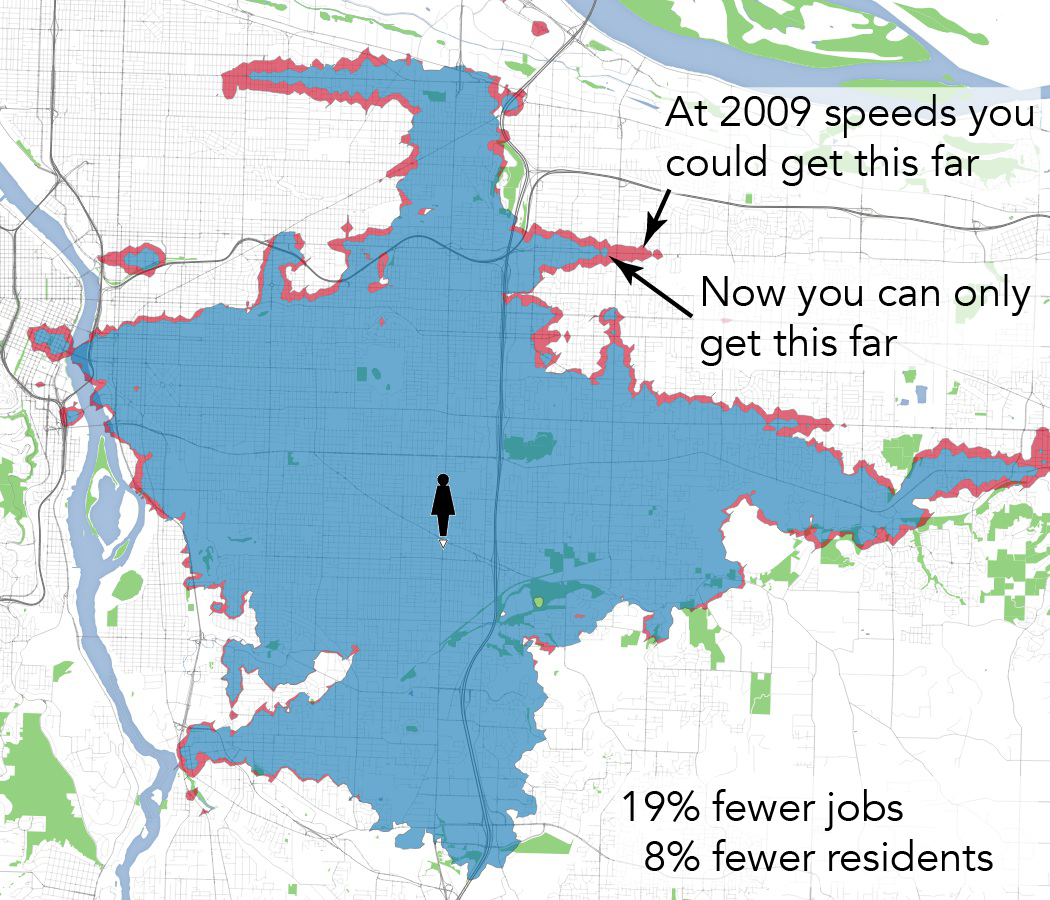
From, our work for Portland Enhanced Transit Corridors project: A person at 82nd & Foster has lost 19% of their 45-minute access to jobs in a decade (2009-19) due to declining bus speeds.

Access analysis starts with an isochrone showing where someone could get to in a fixed amount of time, such as 30 minutes of 45 minutes.  But as Matt Laquidara points out, “no one who is willing to take a 45 minute trip is going to consider a destination 46 minutes away totally unreachable.” In a footnote he adds: “Why bound time at all? In theory, it’s possible to have no maximum time and compute the trip duration for every origin, destination, and starting time combination. Those could be aggregated into an average or percentiles.”

Yes, if you could tolerate a given travel time, you could probably tolerate one that’s a minute longer, but you’ll have limits.  In growing cities, city bus lines in mixed traffic often slow down very gradually, a classic “boiling frog” event that causes big cumulative damage but never generates a single crisis that would attract attention and action.  To a great extent, people who are used to a 45 minute bus ride may accept that it’s 46 the next year and 47 the year after that.

But at some point, they will run out of time in their day.  The person whose 45-minute ride is now 55 minutes will eventually give up.  They’ll change modes, or quit that job, or do what’s necessary to keep their total daily travel time down.  Meanwhile, a new customer who looks up that commute will see a 55 minute travel time, and say no thanks.

So a minute’s difference may not matter, but a 10 minute difference probably does.   And to talk about access as freedom, we need to be very approximately right in the travel time budget.  Perhaps we’ll get closer if we come up with bell curve of weighted travel time budgets for commutes, maybe peaking at 30 minutes one way but with a long tail stretching upward past 45.  This is a reasonable solution to the problem of assigning too much significance to a one-minute difference.  But if we get too fancy about how we draw the curve, it takes us back to the same problem.   It’s easy to quantify what people are putting up with in terrible situations, but that’s different from what a free person would tolerate.  We aren’t describing people’s freedom if we’re relying on data about their unfreedom now.

So some arbitrariness, proudly proclaimed, may be better.  For my own rhetorical purposes in presenting and justifying transit service plans, the soundbite and picture take us far:  “The average Dubliner can get to 20% more jobs and school enrollments in 30 minutes, and here, let us show how the 30-minute wall around your life changes.”  People who hear me say that rarely accuse me of claiming that 30 minutes is radically different from 31.  They know I’m making a simplifying assumption so that I can show them something that they can understand, and whose value is obvious to them.

Perils of Aggregation

It’s one thing to analyze all the various kinds of destinations.  It’s another more perilous thing to decide how these should be weighed to create a single measure of access.  As Matt Laquidara writes:

I’m deeply uncomfortable with most any determination of what locations are important, and consequently, which ones are not. I don’t want to do it myself. I don’t want anyone else deciding it either.

For reasons we explored above, there are always going to be trip desires that are just too scattered, and for which there’s so little data, that they will tend to be omitted in analysis.  Residence-to-residence trips are probably one example.

There will also always be the problem that some destinations are hard to quantify.  In San Francisco, we assumed that every acre of park was equally valuable in terms of people valuing the freedom to reach it, but of course there are lots of ways to question that, and to introduce other factors such as park infrastructure.  Each of those factors would make the measure more precise but also more questionable in terms of how it was projecting some people’s preferences (those who yell loudest at meetings, for example) onto the entire population.

But let’s say that refinements to access analysis make it possible to cover about 95% of trips — or as access analysis would describe it, 95% of the destinations that people will value the freedom to reach.  Matt’s objection arises only when we aggregate these different destinations into a single access score.  If we declare that one acre of park is worth 0.26 pharmacies, that’s a value judgment.  We could try to apply survey data about how much demand each place attracts, which requires assuming that people are making all the trips they want to make.  Or we could just stop trying to aggregate, which I prefer.  The elected and public audiences with whom I speak usually want to hear separately about each destination type, because each is the basis for a different kind of story and has a nexus with different kinds of public policy.  If you care about food security, look at access to groceries.  If you care about how much exercise people get, look at access to parks.  And so on.

To sum up

  • Access analysis is not perfect but can be more reliable than predictive analysis, if only because it makes a more modest claim.
  • Predictive modeling requires all the assumptions that access analysis requires, but adds even more assumptions about how human behavior in the future will resemble that in the recent past.  Access analysis does not need to include such perilous assumptions.
  • We can describe access for commutes with relative confidence.  Commutes are a minority of trips but there are a variety of reasons to consider them important.
  • Non-commute trips are important but harder to analyze.  Still, there’s a basis for making some reasonable assumptions.
  • Further work is needed on how to think about freedom of retired people, and more generally about how people’s tolerance for travel time varies with the competing demands on their time.  Up to now I’ve been using busy people as the primary frame of reference.  This probably contains a bias: I want transit to be useful to busy people, not just to people who enough time that they don’t feel constrained by slow service.  Most people are busy.

This post is out there to start arguments, though I hope it also resolves a few.  I am not an academic scholar, but I do feel confident in what I asserted in the “my claims” section above, at least until I read the comments, as you certainly should.  Then, I may add some updates here.
Basics: Access, or the Wall Around Your Life

What if we planned public transit with the goal of freedom?  Well, it’s hard to improve things that you can’t measure, but now it’s becoming possible to measure freedom, or as we call it in transport planning, access.

Access is your ability to go places so that you can do things.  Over the last few years, I’ve come to believe that may be the single most important thing we should be measuring about our transport systems — but that we usually don’t.[1]  Access isn’t a new idea, but as our data gets better it’s becoming easier to measure, and it could potentially replace many other measures that are groping toward the idea but not quite getting there.

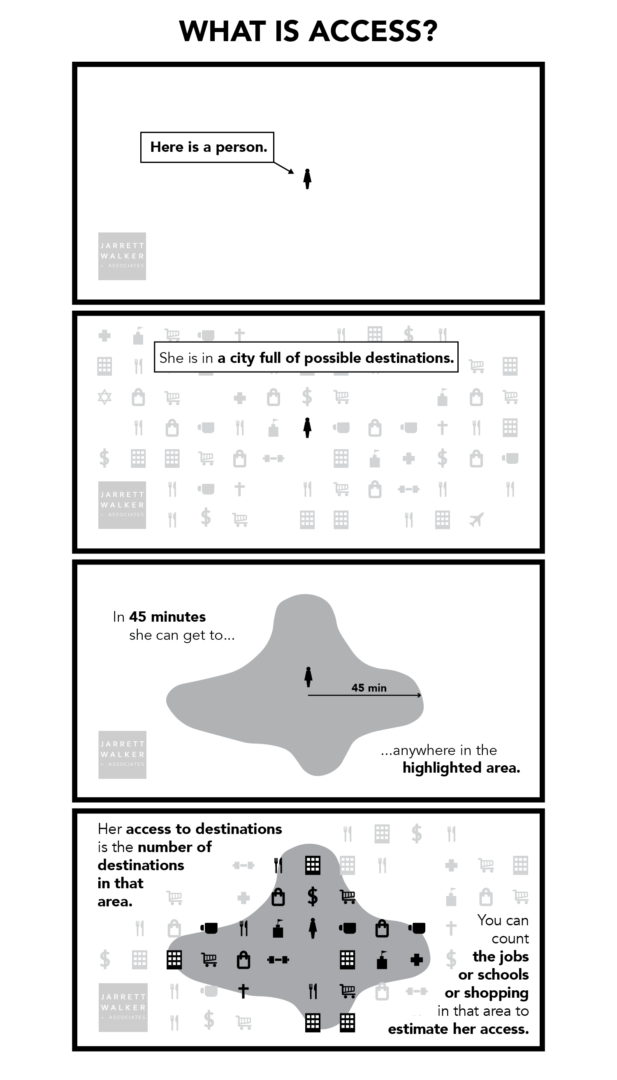
We calculate access, for anyone anywhere, like this:


Whoever you are, and wherever you are, there’s an area you could get to in an amount of time that’s available in your day. That limit defines a wall around your life.  Outside that wall are places you can’t work, places you can’t shop, schools you can’t attend, clubs you can’t belong do, people you can’t hang out with, and a whole world of things you can’t do.

We chose 45 minutes travel time for this example, but of course you can study many travel time budgets suitable for different kinds of trips.  A 45 minute travel time one way might be right for commutes.  For other kinds of trips, like quick errands or going out to lunch, the travel time budget is less.  For a trip you make rarely it might be more.

But the key idea is that we have only so much time.  There is a limit to how long we can spend doing anything, and that limit defines a wall.  We can draw the map of that wall, and count up the opportunities inside it, and say:  This is what someone could do, if they lived here.

Access is a combined impact of land use planning and transport planning. We can expand your access by moving your wall outward (transport) or by putting more useful stuff inside your current wall (land use).  We can use the tool to identify how much of a place’s access problem lies in the transport as opposed to the development pattern.

We can calculate access for any location, as in this example, but we can also calculate the average access for the whole population of any area.  In the first draft of our bus network redesign for Dublin, Ireland, for example, we found that the average Dubliner could reach 20% more jobs (and other useful destinations) in 30 minutes.  To discuss equity, we can also calculate access for any subgroup of the population: low income people, older or younger people, ethnic or racial groups, and so on.

Why Access Matters

People come to public transit with many goals that seem to be in conflict, but it turns out that a lot of different things get better when we make access better:

  • Ridership tends to be higher, because access captures the likelihood that any particular person, when they check the travel time for a trip, will find that the transit trip time is reasonable.  Ridership goes up and down for all kinds of other reasons, but access captures how network design and operations affect ridership. [2]  In our firm’s bus network redesigns, we’ve been using access as a key measure of success for about five years now, and it consistently leads us to ridership-improving network designs.
  • Emissions and congestion benefits all improve, because they depend on ridership, which depends on access.
  • Economically, the whole point of a city is to connect people to abundant opportunities.  People come together in cities so that more stuff will be inside the wall around their lives.  When we measure access we’re measuring how well the city functions at its defining purpose.
  • As for equity or racial justice in transit, well, isn’t equal access to opportunity at the core of what these movements are fighting for?  Access describes the essence of what has been denied to some groups through exclusionary development planning and exclusionary transport planning, so it helps us quantify what it would mean to fix those things.  This, in turn, could help justice struggles avoid a lot of distractions.  Because in the end, access is …
  • Freedom.  Where you can go limits what you can do.   If we increase your access, we’ve expanded the options that you have in your life.  Isn’t that what freedom is?

When we improve access, with attention to who is benefiting most, we improve all of those things.  It’s this remarkable sweep of relevance that makes access analysis so interesting and potentially transformative as a way to think about transportation.

Access Compared to Common Measures

Most methods for studying or improving transit assume that we should care about (a) what people are doing or (b) what people want to do.

Data about what people are doing includes travel behavior data, which are the foundation of much of the accepted methods of transport planning.  In public transit, ridership data is in this category.  Ridership is the basis for transit’s benefits in the areas of congestion and emissions, and also of fare revenue.

However, what people are doing isn’t necessarily what people want to do, or what they would do if the transport network were better.  Much of what people do may just be the least-bad of their options given the city and transport network as it is.   This problem leads to various methods of public surveying to “find out what people want,” in some sense.  But there are lots of problems with that, mostly lying in the fact that people are not very good at knowing what they’d do if the world were different in some major way.

Access takes us outside of both of those frames.  Instead of asking “what do people do?” or “what do people want to do?” it asks “what if we expanded what people can do?

Access analysis does not try to predict what you’ll do.  In fact, it doesn’t need to predict human behavior at all, which is a good thing because human behavior is less predictable than we’d like to think.  Access calculations are vastly more certain than almost anything emerging from social science research, because they are based almost entirely on the geometric patterns of transport and development.  [3]

Instead, access starts with one insight about what everybody wants, even if they don’t use the same words to describe it.  People want to be free.  They want more choices of all kinds so that they can choose what’s best for themselves.  Access measures how we deliver those options so that everybody is more free to do whatever they want, and be whoever they are.

What Access Analysis Can’t Do

Will access analysis of transit put the social sciences and market research out of business?  Of course not.

  • We need to understand how different users experience public transit, and how the experience can be better designed to meet those various needs.
  • We need to know exactly who won’t be served by access based network design so that we can decide what actions to take for those people, if any.
  • We need to keep exploring the relationship between access and ridership so that we can identify the factors that sit outside that relationship and must be considered.
  • Access analysis would also become more powerful if we had better data on the locations — to within 1/4 mile (400m) or so — of various non-work destinations: retail, groceries, medical, and so on — so that we could better assess people’s ability to get to such places.

But in 30 years of listening to public comment, I’ve heard enough times that people want to go places so that they can do things.  So let’s measure how well we’re delivering that, and let’s ask ourselves if that’s more important that some of the things we measure now.

Further Reading

This post could have been much longer; in fact, I hope it will become a book.  Meanwhile, here are some great resources:

  • The 2020 Transport Access Manual is the first comprehensive explanation of access and how it can be applied to various questions.  It’s the work of a team led by professors David Levinson (University of Sydney) and David King (Arizona State University). Full disclosure: I had a role and wrote some snippets.
  • The University of Minnesota’s Accessibility Observatory, founded by Levinson and now led by Andrew Owen, is one of the main research centers on the topic.  For several years they’ve been publishing Access across America,  an atlas showing where people can get to from various places by car, transit, etc..
  • On the philosophical issues about freedom vs. prediction, and why it’s important to separate physical knowledge from social science knowledge, see my fun Journal of Public Transportation paper, “To Predict with Confidence, Plan for Freedom.”  Seriously, it’s fun.
  • On what high-access public transit tends to look like, here’s a fairly evergreen 2013 post of mine, with downloadable handout, on how some of the big debates of transit planning line up with a goal of high access for a community.

I will update this post with further links.

Endnotes

[1]  In the academic literature, what I’m calling access is usually called accessibility.  Both of these words have contested meanings, because both have been used specifically to refer to the needs and rights of people with disabilities.  I follow the recent Transport Access Manual in using access as the less confusing of these two words.  Of course, we are talking here specifically about spatial access — the ability to do things that require going places — which is not the only kind.  However, a lot of the ways that people are cut off from opportunity do turn out to be spatial.  Transportation (i.e. access) is a major barrier to employment in the US, for example.

[2]  This paper, for example, establishes a relationship between transit access and public transit’s mode share, one that is especially strong for lower income people.

[3]  There are exceptions.  Traffic congestion, for example, is a human behavior that affects the access calculation.

US Congress Considering Freedom-Based Measures of Project Success

It’s hard to capture what good news this is.  Through a bipartisan bill, Congress is seriously considering a plan to give more weight to how proposed transit investments improve access to jobs and opportunity.  The bureaucratic word for this is accessibility, but I like to call it physical freedom, because the presence of meaningful choices in your life lies in whether you can get to them in a reasonable time, which is exactly what this measures.  From the Transportation For America website:

The incredibly blunt metrics that most planners or communities have used since the 1960s, like overall traffic congestion and on-time performance for transit, paint a grossly two-dimensional picture of the challenges people face while trying to reach jobs and services. They don’t provide sufficient information for agencies to make accurate decisions about what to build in order to best connect people to the places they need to go. These 1960s metrics lead to singular and expensive solutions (like highway expansions), while often failing to solve the problem or even creating new ones.

Today, precise new tools allow communities to accurately calculate accessibility to employment opportunities, daily errands, public services, and much more. These tools allow states and MPOs to better understand where people are traveling and to design transportation networks to maximize the ability of people to travel. It also allows states and MPOs to optimize their transportation networks to utilize all modes of transportation and even to understand how their investments interact with land use policies.

We use these tools all the time in our bus network redesigns, though we are limited, by available data, to studying access to jobs.  It is great to see people working on better data layers to capture errands, shopping, and so on.  I am not sure how much of this granularity is necessary, but it doesn’t hurt.

Implicit in this news is the idea that ridership prediction could decline in importance, which would be great news.  We are much too deferential to predictive algorithms for things that may not be predictable, such as human preferences and attitudes 20 or 30 years from now.

There’s one other caution.  When planning fixed infrastructure investment, hard thinking has to go into what facts from today are assumed to be permanent.  For example, when we talk about access to public services, will we just analyze outcomes based on the often terrible locations of these services, thereby enabling continued terrible location decisions?  If we dare to predict better urban form in response to public investments, on what basis will we predict that?

The conversation about access therefore needs to reflect on what aspects of urban form and location are likely to last for decades, like the larger scale urban form and the likely trip generation it implies.   (We may build more dense urban fabric, but we are unlikely to tear it down.)  This is another reason why too much granularity could distract us; it leads us back into obsessive descriptions of the present, some aspects of which could be different next year.

So this is difficult philosophical stuff.  I’m trying to grapple with it in the next book.  Feel free to nag me about how it’s going!

“To Predict with Confidence, Plan for Freedom”


The Journal of Public Transportation has a special issue out consisting of thinkpieces by a range of figures in the business.  I’m honored to be there alongside industry leaders like Susan Shaheen of UC Berkeley, Graham Currie of Australia’s Monash University, Kari Watkins of Georgia Tech and Brian Taylor of UCLA, as well as our favorite operations and scheduling consultant, Dan Boyle.

My contribution is called “To Predict with Confidence, Plan for Freedom.”  It basically outlines the argument of my next book, so this would be a great time to hear some critiques of it.  Here’s the opening:

What will urban transportation be like in 10-20 years? How will automated vehicles interact with social and cultural trends to define the city of tomorrow? Will the vehicles of the future be owned or shared? How will pricing evolve to motivate behavior? What will happen to public mass transit? What other innovations can we expect that will transform the landscape? This paper, which is merely the outline of a larger argument, suggests three interconnected answers.

  • We can’t possibly know. History has always been unpredictable, punctuated with shocks, but if the pace of change is accelerating, then unpredictability may be increasing too.
  • We can reach many strong conclusions without knowing. A surprising number of facts about transportation, including some fairly counterintuitive insights that would be transformative if widely understood, can be described and justified solidly with little or no empirical ground, because they are matters of geometry and physics or of nearly axiomatic principles of biology.
  • Prediction may not be what matters anyway. If we abandoned hope of predicting the future, we could still describe a compelling outcome of transportation investment, one that motivates many people who will never care about a ridership prediction or economic impact analysis. We could also predict it in the sense that we can predict the continued value of pi. That idea is freedom, as transportation expands or reduces it.

So if that catches your interest, read the whole thing, and share your comments below!

Better Transit = Higher Property Values (but …)

Real estate giant Redfin (which owns WalkScore) has a study about how transit quality correlates with property values.  And yes, there’s a correlation:

On average, across the 14 metros analyzed, one Transit Score point can increase the price of a home by $2,040. But the price premium varies widely from metro to metro.

That variance is a problem, though.  For example, a Transit Score point gains you 1.13% on property values in Atlanta but counts for nothing in Orange County, California. When you see this kind of variance, you should suspect that other factors are more significant than the one being studied.  So this supposedly pro-transit Redfin piece can actually be used to argue that transit isn’t all that important, or at least that when transit is important, it’s because it echoes something else that matters more.

But we should explore a simpler explanation:  Maybe transit is relevant, but Transit Score isn’t.

I explain what’s wrong with Transit Score here, but the bottom line is that Transit Score has nothing to do with where you can get to on transit.  Transit Score is about how much transit is nearby, and whether it’s cute or sexy, but not at all about whether it’s useful.  In this it’s much like the way the real estate industry evaluates static civic amenities, like schools and parks, whereas it should be more like the way the same industry evaluates road access, i.e. by caring how fast you can get to places.  More here.

This is important because when you publish results with such huge variability, you tip off smart people that you may not be looking at the right explanatory variable.  It’s easy to look at these results and assume that transit isn’t what matters.  But maybe it’s Transit Score, not transit, that’s the distraction.


Seattle: The Future of a City’s Liberty

If you know the Seattle area at all, you’ll enjoy this simple yet deeply pleasing animation by King County Metro Transit, showing how transit could improve over the next 25 years, if voters continue to support it.

What kind of video is this?  No pictures of diverse, happy people on public transit? No pictures of sexy trains or buses?  No network diagrams? (Those are here!)

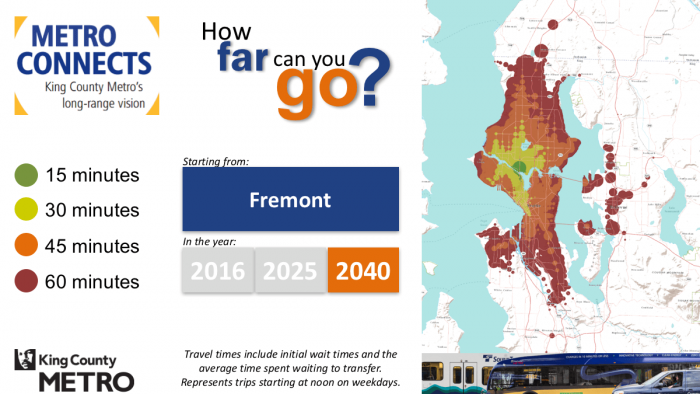
Nope.  Just pictures of the liberty and opportunity of human beings, like this:Slide039


This image means that in 2040, if you’re in the Fremont district of Seattle (the center of the dark green dot) you’ll be able to get to anywhere in the brown area in 60 minutes. The animation steps you through how small this area is now, and how it grows over time under the plan.  It does this for over 70 sample destinations around the region.

If you want to get around on transit and walking, think of this brown area as the wall around your life.  Make it bigger, and your life is bigger: more jobs you could hold, more schools you or your kids you could go to, more clubs you can belong to, more people you can meet, befriend, maybe even marry.

At my firm, we almost never do a plan anymore without drawing these, showing how they differ based on various alternatives under study.

Because we think people are tired of arguing about rail vs buses, and about transferring, walking distances, waiting times, dwell times, platform heights, and all the other arcana that make most transit conversations seem maddening and inaccessible.  Instead, we want to talk about something everyone cares about: liberty and opportunity.

Diagram by King County Metro Transit, part of their “Metro Connects” strategic plan.  Produced in Remix.  

Basics: Public Transit “Integration” or “Seamlessness”

When you hear the word integration or seamlessness in conversations about transit, it usually means making it easy to make trips that involve multiple public transit agencies or operating companies.  (In the US we are generally talking about entangled government agencies, but in countries where private operators control patches of the network, the issue is the same.)

The San Francisco Bay Area has long been one of North America’s most difficult integration challenges, so it’s a good laboratory for exploring the issue.  If you can get transit integration right in the Bay Area, you can probably do it anywhere.  The Bay Area’s particular challenge is that it has no recognized central city.  Instead, it’s named after an obstacle, the Bay, and its geography of bays and hills provides natural psychological divides.  Wherever you live in the Bay Area, most of the Bay Area is “across the water” or “over the hills” from you, and this matters enormously to how people perceive issues as local or regional.  (Los Angeles, mostly a city of vast continuous basins, could not be more opposite.)

Screen Shot 2015-08-03 at 11.31.30 AM

The San Francisco Bay Area, with county lines


Fig1-WholeBayArea BS2_REV3_040915

Map of Bay Area transit agencies (SPUR, “Seamless Transit” 2015)

The key types of seam are:

  1. Fare barriers, where a trip involving two agencies requires paying both agencies’ fares, and sometimes also keeping track of two kinds of ticket or pass.
  2. Information barriers, such as the lack of a clear map.  (In many regions, the only regionwide map, if it exists, is more like a diagram of turf.  It’s designed to clarify what agency controls what rather than help people understand their travel options.)  Other information barriers include information systems that don’t describe how to use other agencies’ networks to complete common trips.
  3. Service Design Barriers, where a route ends at an agency boundary even though almost everyone on the bus is trying to go further.
Regional-Transit-Diagram

A typical old regional transit diagram, showing areas of turf but no sense of what service might be useful (no indication of frequency, for example).  (MTC)

For decades, it’s been easy to propose that some grand merger of agencies would solve problems of integration, but the obvious problem was you would have to merge the whole Bay Area into one transit authority serving almost 8 million people, in a region around 100 miles long.  That population would mean little citizen access to the leadership, while the huge area would mean that people planning your bus routes may be working in an office 50 miles away.  It just doesn’t work when the sense of  citizenship is as understandably decentralized as it is in the Bay Area.

What’s more, if you value transit-intensive core cities, places like San Francisco and Oakland, or if you want your city to be more like those places, you have an especially strong reason to want local control.  These places need more transit than the whole region wants on average, so they will struggle to get adequate service from a regional transit agency, whose decisions will tend to converge on the average regional opinion.

Many North American regions are seeing conflict around this issue, and are evolving a fascinating range of solutions.  Many of these solutions involve additional funding from the cities that want more transit than the regional average.

Some core cities are proud to have their own city-controlled transit systems separate from what regional agencies do (San Francisco, Toronto, Chicago).  Some pay their regional transit agency for a higher level of service in the core city (Seattle, Salt Lake City).  Some run their own transit systems overlaid, often messily and confusingly, on the regional one (Washington DC).   Many more core cities are going to face this issue soon, especially if regional politics continue to polarize on urban-exurban lines.

Apart from the issue of urban-exurban differences in the need for transit, there are also real challenges when a single transit agency becomes enormous, especially if it provides local service over a vast geographic area.  Los Angeles is a great example.   As an undergraduate in the 1980s, living in the region, I marveled at what I assumed to be the stupid chaos of provincialism.  The region had a big transit agency, which has evolved into what we now call LA Metro, but many cities within the region ran their own transit systems, which were tangled up in each other, and with the regional agency, in complex ways.  As an undergraduate, I assumed that progress would mean merging all this into one giant agency that could provide the same product everywhere.

And yet: in those days, everyone hated the regional agency, but loved their city ones.  And there were good reasons for that that weren’t anyone’s fault, and still aren’t today.  You could get your city’s transit manager on the phone, but not the regional one.  Small city governments can fix a bus route and put up a new bus shelter in the time it would take the regional agency to organize the right series of meetings.  Again, nobody’s at fault there; these are natural consequences of smallness and bigness — in corporations as well as in governments.

Which is why, even in Los Angeles, the trend is not toward mergers.  Today, many city systems in the county are doing excellent work at their local scale.  LA Metro has improved massively as well, of course, but its costs are still high; more important, it’s still very big and therefore inevitably feels distant to many people — again, not the fault of the folks working there.

Meanwhile, a clearer negotiated boundary between regional and city functions is slowly starting to emerge.  One idea, for example, is that a key role of city systems is to run services that don’t meet regional standards for ridership, but that the locals feel to be important.  The division of labor among agencies is not what anyone would design from scratch.  But great work has been done over the years to build clearer relationships, or what I will call, later in this post, “good fences.”

City-operated transit is growing more popular in North American for another excellent reason:  Most of transit’s ability to succeed is already controlled by city government: specifically the functions of land use planning and street design.  If a city government feels in control of its transit, it is more likely to exercise those other functions in ways that support transit rather than undermine it.  San Francisco’s recent decision to combine traffic and parking functions with transit under one city agency shows a new way of thinking about the need to get this right, but it would be impossible if San Francisco relied on a big regional agency for its transit service.  Whenever someone proposes to turn a city transit system over to a consolidated regional agency, I have to point out that integrating in one dimension (between geographically adjacent services) means disintegrating in another (between key functions of city government.)

So there’s no simple answer.  City control creates a nasty patchwork of geographic integration problems across adjacent cities in a region.  The big regional agency has a different integration problem, which is with the land use and street design functions of municipal governments that don’t control their transit and therefore have trouble caring about it.  Whichever thing you integrate, you’re disintegrating the other.

What’s the answer?  It’s for each region to feel its way through the inevitable tensions to its own solution.  But I’d propose we start old fashioned idea made famous by a Robert Frost poem:

Good fences make good neighbors.

Neighbors have an easier time being friendly if they have a very clear agreement about where their boundary is.  Collaborating with your neighbor to mark the boundary, and fence it if need be, is a peacemaking gesture.  This is as true of neighboring landowners as it is of nations.  And it’s certainly true of transit agencies.

What does it mean to have a clear sense of boundary?

It’s not just that both sides agree where the boundary is.  It’s also that it’s easy for both sides to live with the boundary, and work across it as need be.  For nations, it’s much easier to manage a boundary that runs across a natural barrier, so that the natural boundary reinforces the agreed boundary — the Rio Grande River between the US and Mexico, say, or the Great Lakes along the US-Canada border.  The worst possible national boundary is something like the 49th parallel, the US-Canada border in western North America, an arbitrary line that runs perpendicular to most mountains and valleys.  Only the extreme friendship and cultural affinity between the two countries makes this boundary workable.

All that is true of transit agencies as well.  Let’s talk first about local networks, and then, separately, about the relationship between networks of different scales.

Boundaries between Adjacent Local Transit Agencies

A bank of hills or a water body means that there are limited points of access across the boundary, called chokepoints, and this in turn means people are used to going out of their way to cross that point.  That means, in turn, that a well-placed transit connection point adjacent to the bridge or pass is an easy place for transit agencies on the two sides to converge.

On the other hand, a boundary that runs across a flat expanse of urban area, so that many people are literally across the street from the other side, is a problematic transit boundary.  In this case there is decentralized demand in all directions crossing the boundary at many points.  This makes it harder to bring both agencies to a shared focal point for connections between the agencies.  It also means there are lots of relatively short trips flowing over the border, and these benefit from a continuous network of service rather than an interrupted one.  As in many US states, California transit agency boundaries tend to default to county lines, and where these create that problem, it’s a mess for transit.

Some of this wisdom is already encoded in the boundaries of the East Bay agency AC Transit.  Near the Bay, the border between Alameda and Contra Costa counties cuts across dense urban fabric, so it would be an awful place for a transit network to end from the point of view of either side.


Fig1-WholeBayArea BS2_REV3_040915_0

Regional transit map, with boundary between Alameda and Contra Costa Counties highlighted red. Note that AC Transit extends across boundary next to the bay (SPUR report)

Recognizing this, AC Transit was constructed to unite the two sides of the county line where the urban fabric was continuous, while dividing from other agencies along natural hill and water boundaries, even where the latter are not county lines.  This is an important example for many US regions where counties are the default planning units, and arbitrary boundaries drawn in the 19th century (or before) risk turning into walls that sever transit access.

For AC Transit, the “good fences” solution was to put the border in a place that worked well for both sides — worked well for transit customers, that is, not for anyone’s desire for turf or empire.  That tends to mean looking for the natural chokepoint and putting the boundary there.

This observation also helps to clarify the city transit option.  Even in big urban areas, some cities have a geography that makes it easy for much of the transit to be city-controlled, typically because of natural chokepoints along the edges that help isolate the city-scale network from the regional one.  On the other hand, if the city boundary is logically pierced by long, straight local transit corridors that logically function both within the city and beyond it, a municipal network is less viable.

Screen Shot 2015-08-03 at 12.59.36 PMBurbank, California is a good example of a city where most main streets are parts of much longer logical lines running deep into adjacent cities, so its city limits would make especially poor transit boundaries.  Burbank therefore profits from its reliance on LA Metro, which runs long, continuous lines across city boundaries many of them converging on Burbank’s downtown.  The regional network is also, logically, the local one.

Screen Shot 2015-08-03 at 1.00.05 PMNearby Pasadena (considered together with Altadena) has good geography for a larger city role.  It has hill barriers on three sides — only the east edge is really continuous with other dense urban fabric — so fewer of its internal corridors necessarily flow into other cities.  (Areas whose density is so low that they might as well be wilderness as far as transit is concerned — San Marino in this case — count as natural barriers to some degree.)  Another important feature is that Pasadena has a frequent regional rapid transit line running through, so its local lines don’t need to extend far out of the city to make regional connections.

So Pasadena could run most of its local transit system if it wanted to, because a logical network would consist mostly of internal routes.  Burbank could not, because most of its local service is logically provided by routes that continue beyond the city limits.

Do not quote me saying that Pasadena’s transit should be more local.  I am not saying anything about what the regional-local balance should be in these cases, but merely observing how the geography makes the opportunities larger or smaller.  One value of Pasadena being served by the regional agency, for example, is that it can eventually be part of a larger high-frequency grid, with all the liberty that brings.

Local – Regional Transit Boundaries

All that is about what happens between local networks.  But another “good fence” can be a clear division of labor between local and regional services.   Regional services that are designed as rapid transit (widely spaced stations for fast operation between them, relying on local transit connections to get closer to most destinations) do not need to be the same agency as the local service meeting them; in fact, this can be a very clean “fence.”  Obviously you have to work on the specific problems of integration: information, fares, etc., just as adjacent local agencies do.  But there’s little need to merge or change boundaries in these situations.

There will always be seams in a transit journey, just as there will always be the need to make connections.  The conversation should not be about how to get rid of seams but how to put them in the right places, so that they work for both sides, and how to manage them so that travelers can flow through them easily.

Another way of thinking about the geographic issues I’ve been laying out here is that if you require a connection to continue your trip, there should be a rich payoff in terms of destinations you can reach.  The same is true for any hassles created by seams.  It’s like planes: it’s a drag to change planes, and especially to change between airlines, but it’s kind of cool, while you are changing planes, to look at the departure board and think about all the other places you could also get to via this connection.  What’s more, all those connections are crucial to making your flights viable for the airline, even if you don’t use them.

The logic of connections is the logic of good seams in general.  They happen in places where it already makes sense for transit services to be discontinuous — either because of a natural boundary or because of a clear division of labor between regional and local service.  Those “good fences”, once found, can make for happy neighboring transit authorities, which will find it easy to work together for the sake of the customer’s liberty.

Sure, let’s regionalize the right things: fare media, information systems.  (An often-neglected one is service change dates, so that timed connections between agencies don’t get broken because the agencies change their schedules at different times.)  Some mergers may make sense, such as between BART and Caltrain to create a regional rapid transit agency.

Big transit agencies and little ones are both excellent things.  The trick is to get the fence right.


UPDATE: For a book-length academic analysis reaching a similar view, see Donald Chisholm: Coordination without Hierarchy.  1992, UC Press.  H/t David King.

One of my most fun presentations ever …

… especially if you're into architecture, urbanism, philosophy, or literature.  

It's from a keynote to the Oregon Transportation Summit, sponsored by TREC at Portland State University last year.  There are a few local Portland geography references, but nothing you can't follow …  Great questions too. 

I'm introduced at 10:34 by Professor Jennifer Dill, and I start speaking at 11:35

Maybe I was so "switched on" because it was so good to be at home in Portland.  That happens when you travel as much as I do …