In 2015, the primary transit agency in Silicon Valley south of San Francisco, Santa Clara County VTA, hired Jarrett Walker + Associates to lead what the agency would call the vta”Next Network”. A key piece of this effort was designing a new transit network, to be implemented with the opening of a BART extension in San Jose.
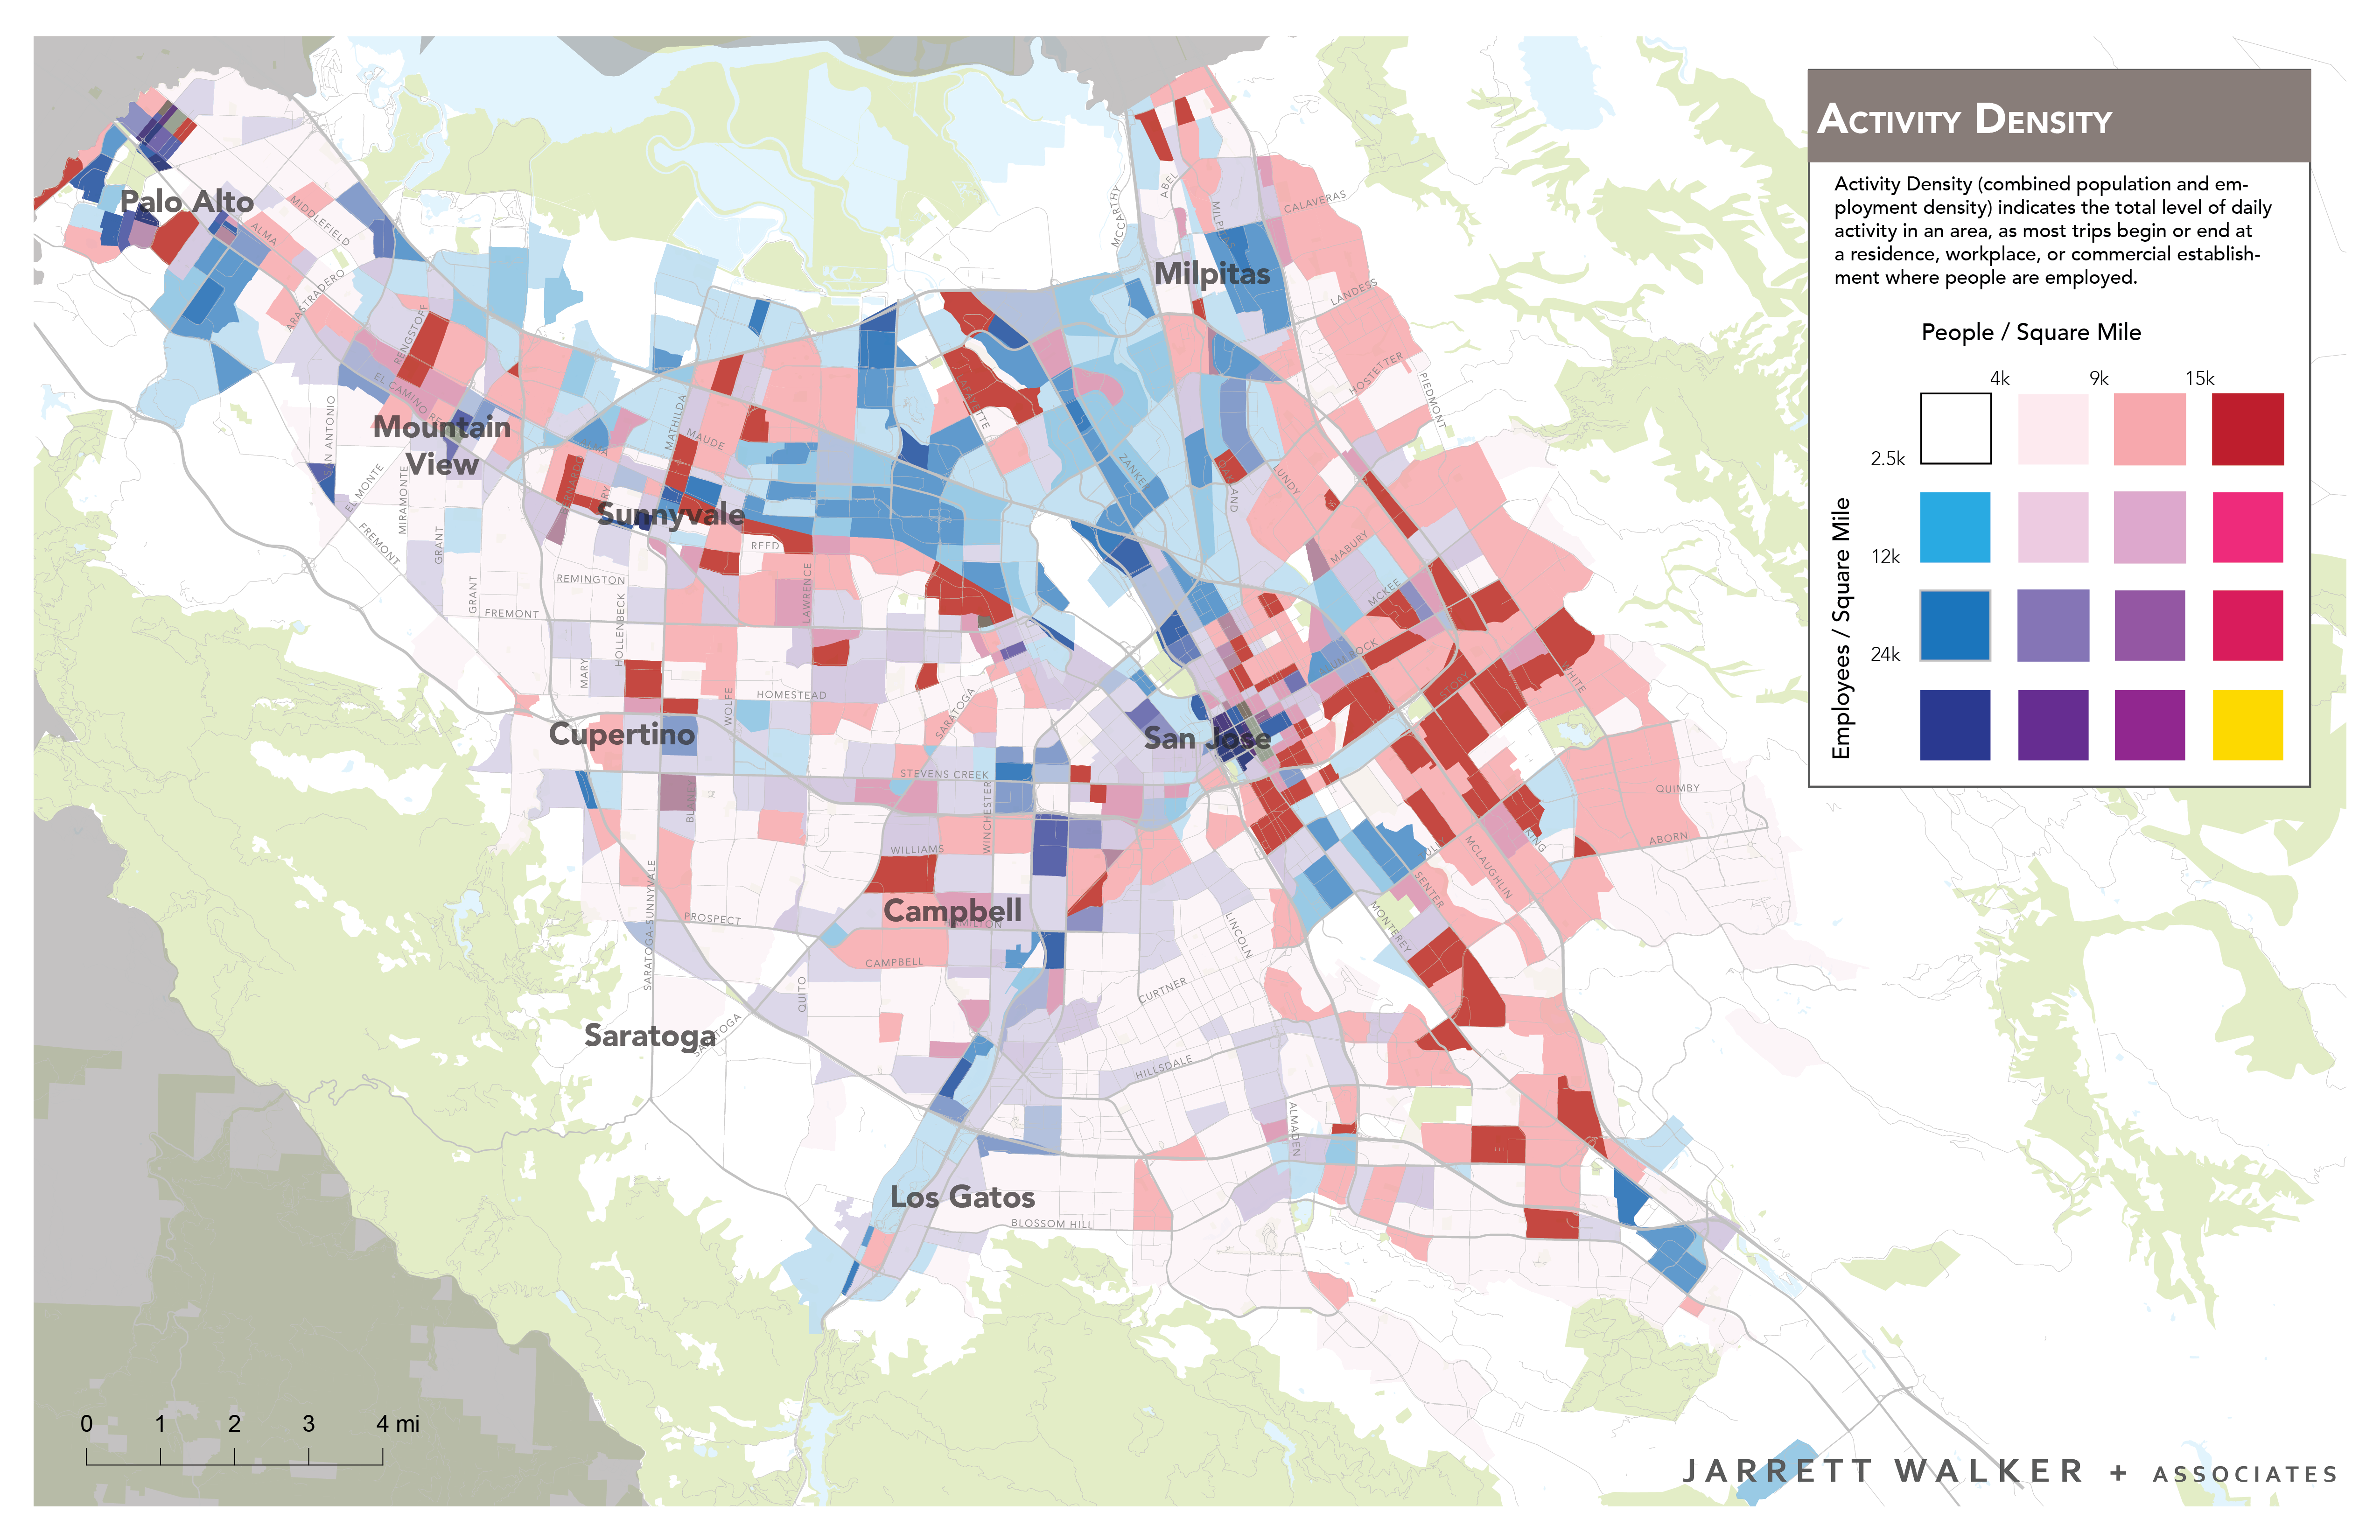
JWA led this complete re-thinking of the countywide transit network, engaging the public, major stakeholders, the County Board of Supervisors, and local elected officials from cities like Cupertino, Mountain View, San Jose, and Palo Alto. As part of the process, JWA led VTA staff in the creation of a set of Conceptual Alternatives illustrating how VTA could move in divergent directions in the future. single biggest problem presented by the county’s geography is that almost everyone lives south or east of where they work. Jobs are concentrated in the northern part of the county, mostly in a suburban business park format, producing a very inefficient northward and westward one-way commute pattern that (prior to Covid-19) was the dominant transportation problem of the county. This activity density map shows jobs in blue and residences in red. (Click to enlarge and sharpen any image.)
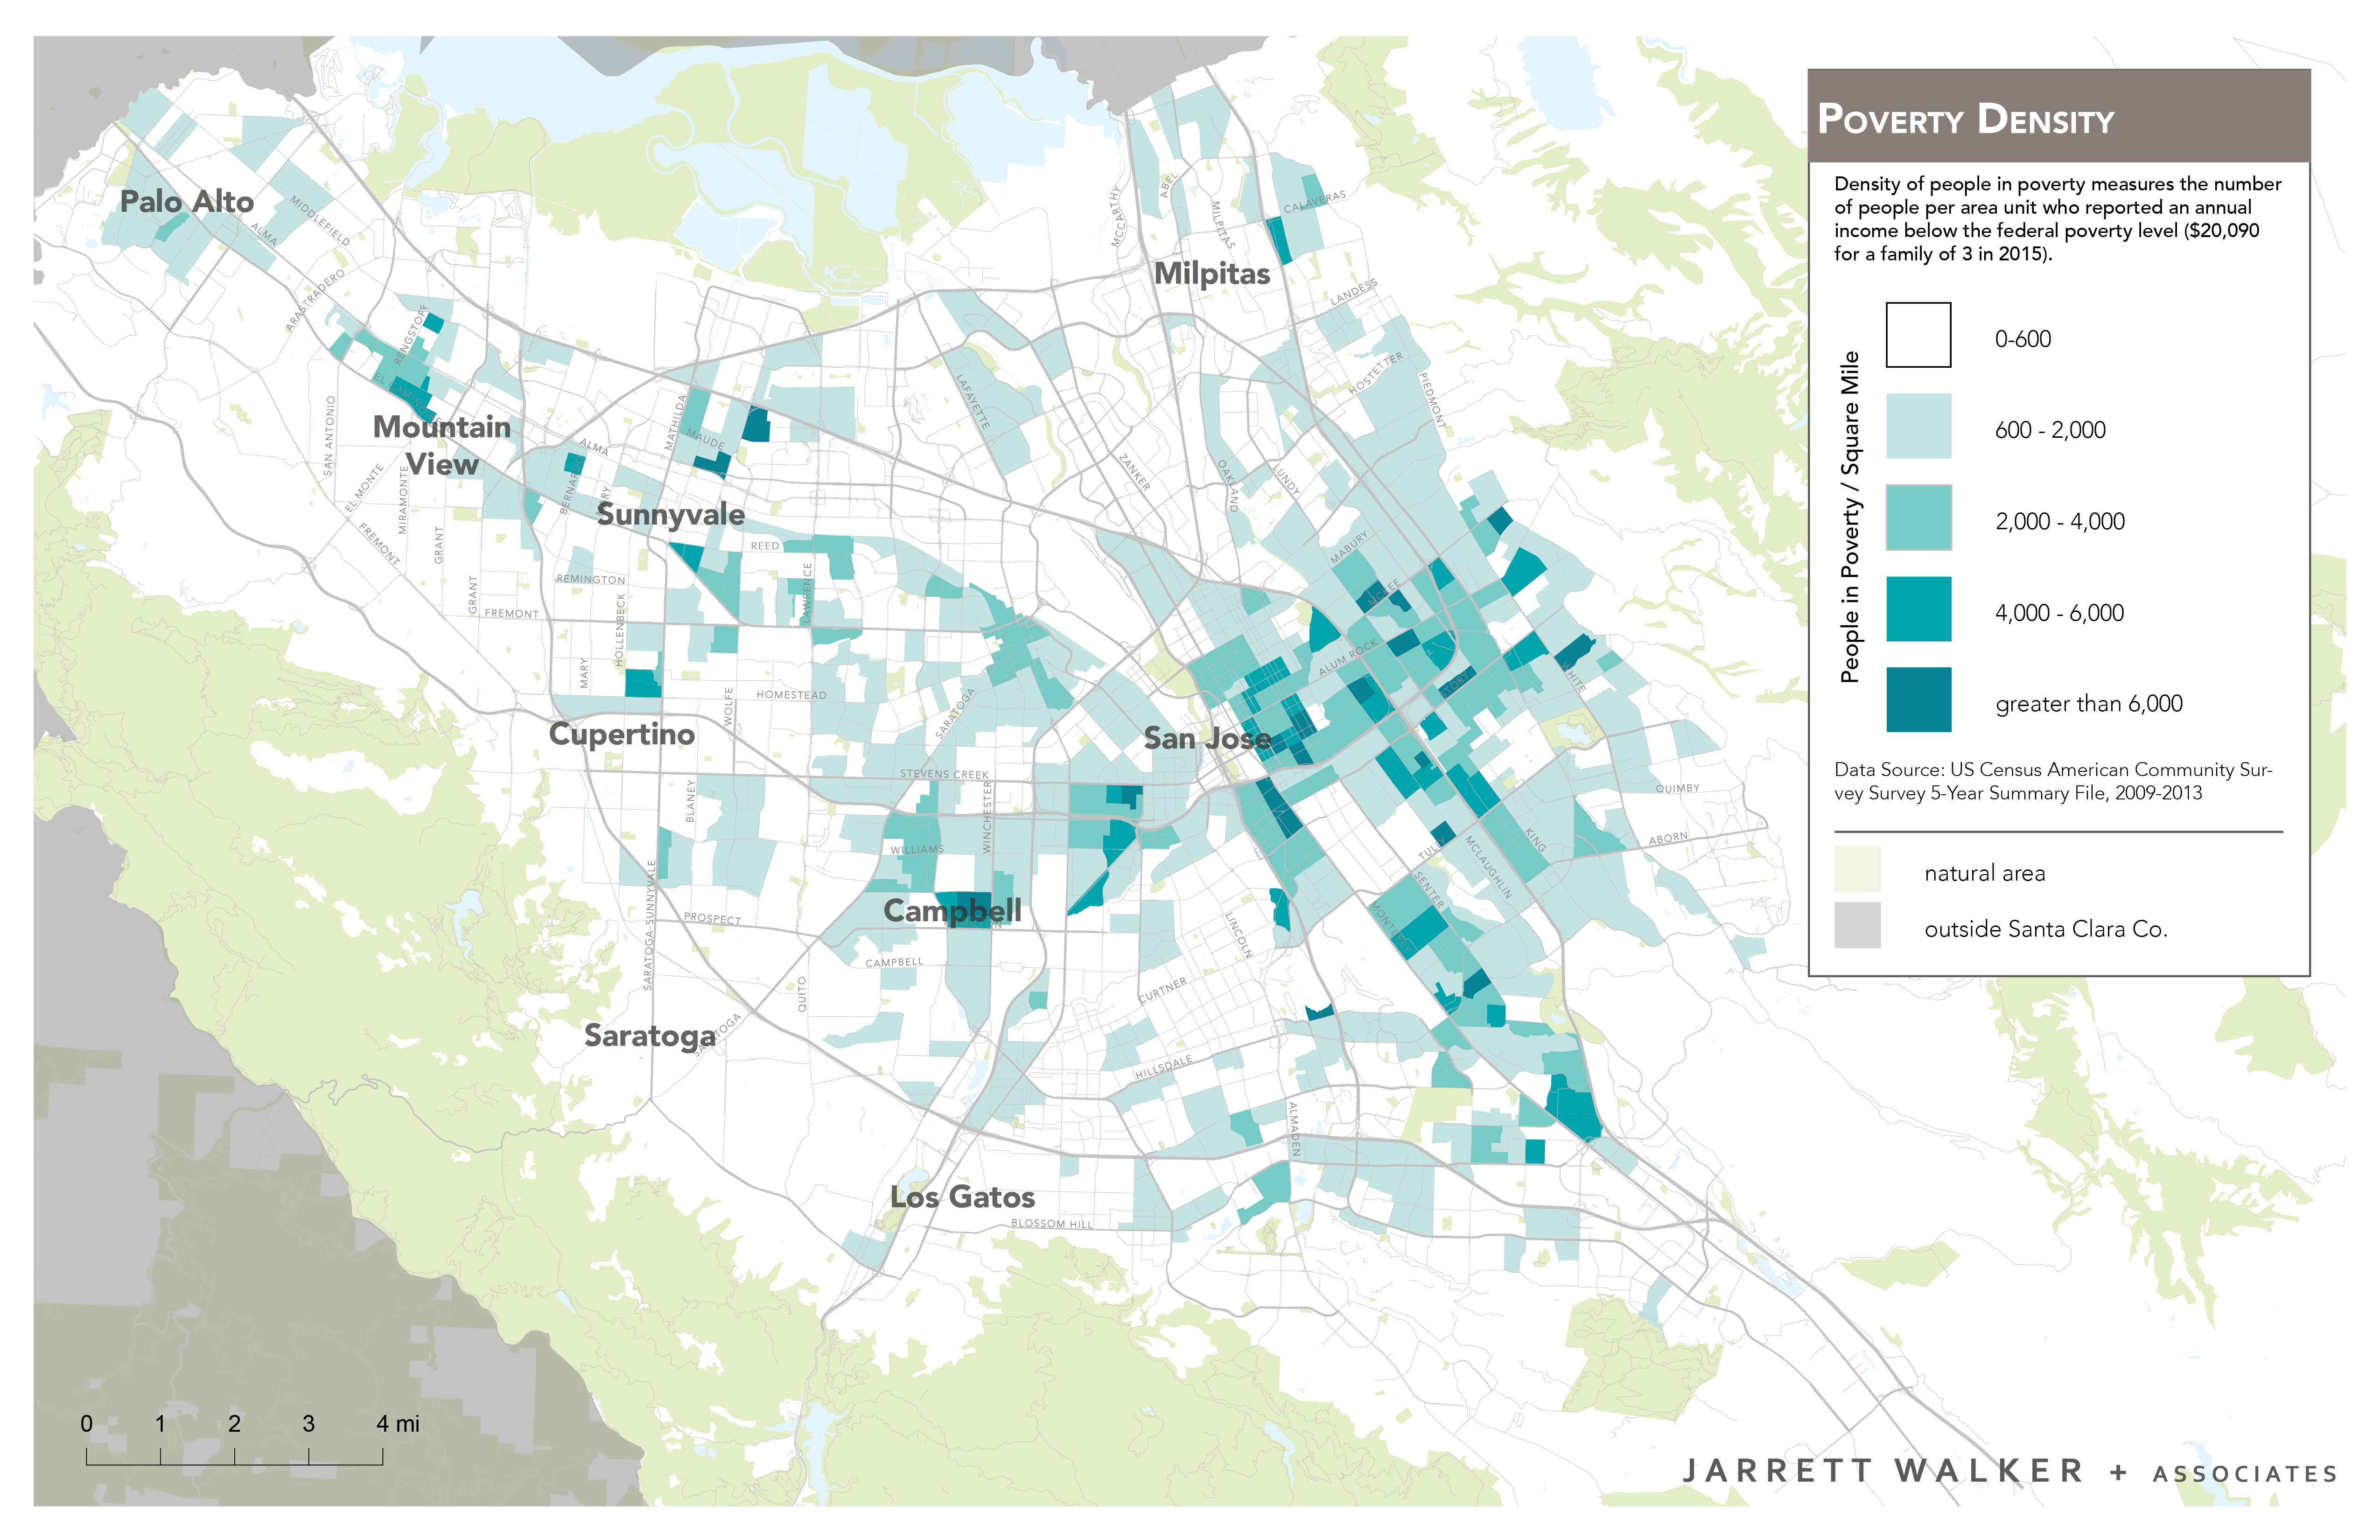
While Silicon Valley is easily stereotyped as an affluent area, there are large low income populations, especially on the east and south sides of San Jose:
The network as it existed in 2016 looked like this. Note the legend! The colors indicate frequency with red or orange indicating service every 15 minutes or better all day.
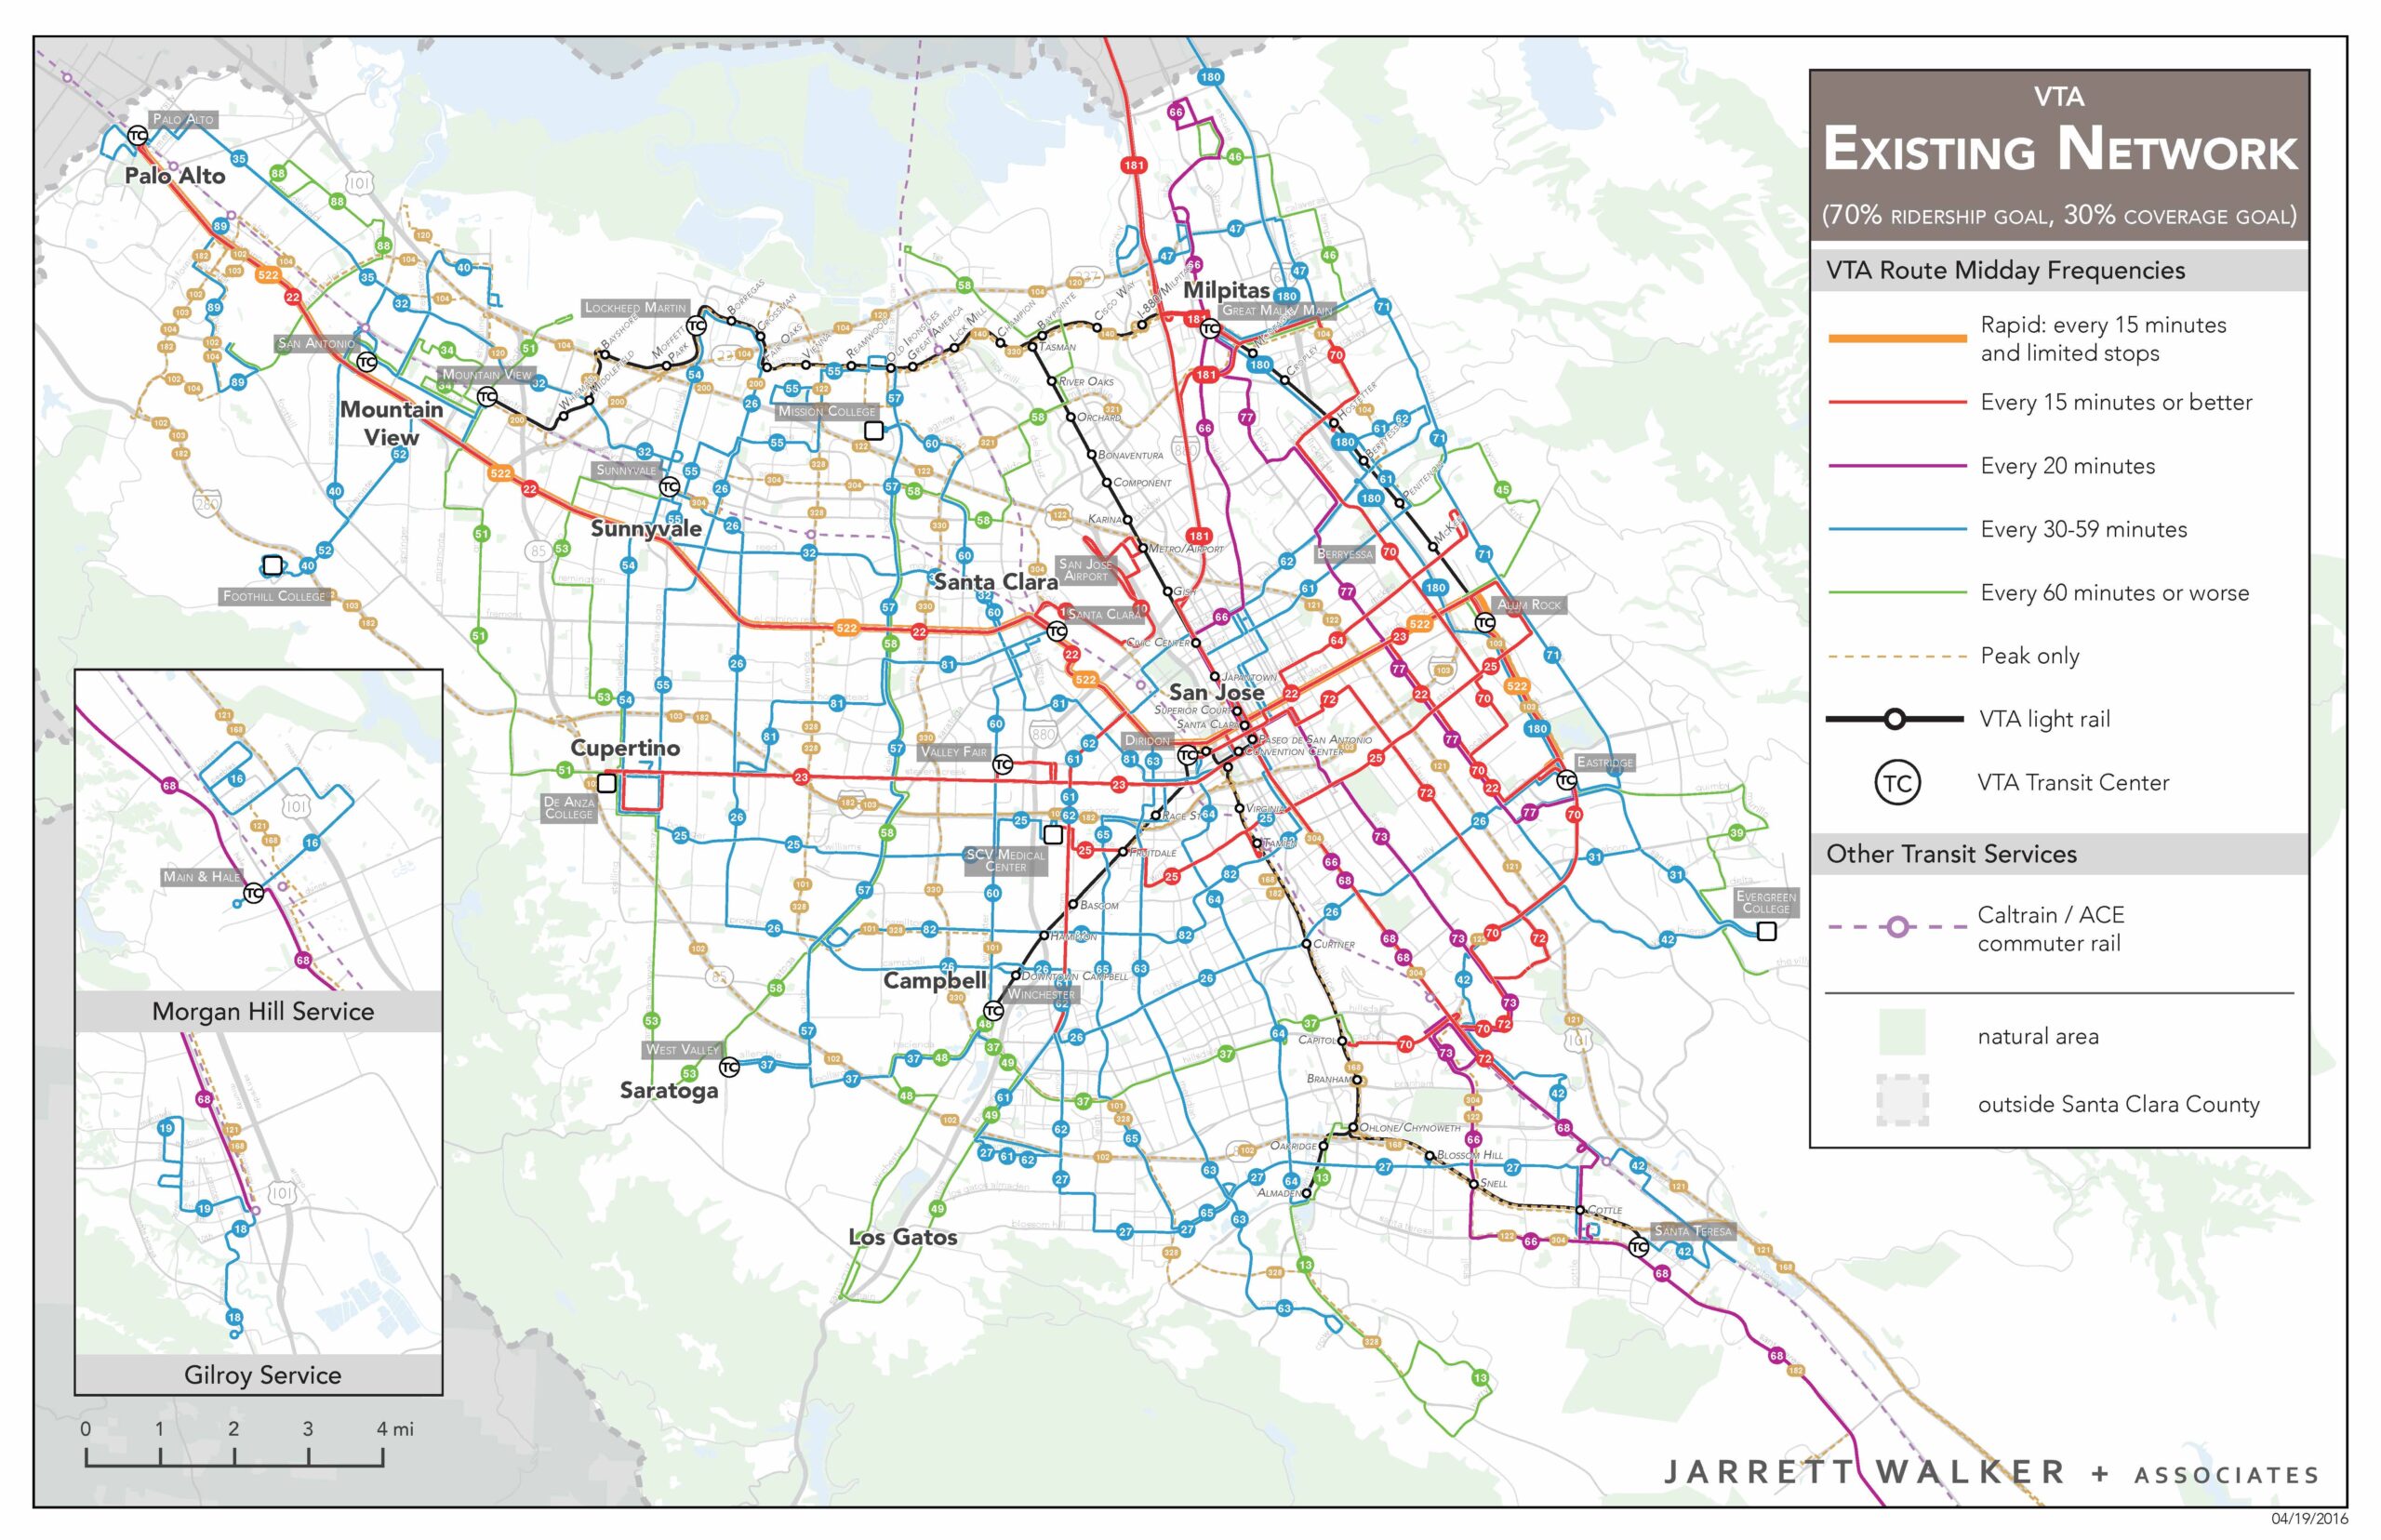
The VTA network in 2016.
VTA did not have the funds to grow the quantity of bus service, so they needed clear thinking about the ridership-coverage tradeoff. VTA presented their goal as increasing ridership, but the highest-ridership way to reallocate bus service would have left some areas with no service at all.
We assessed the existing network and found that about 70% of the service was where it would be if the only goal of the network were ridership. Most of the other 30% was providing coverage: predictably low-ridership service to low-demand areas.
So we designed three contrasting networks, all with the same total budget, showing how service would be reallocated depending on the desired balance between the goal of ridership and the competing goal of coverage. These are:
- Network 70. 70% of the operating budget devoted to the goal of ridership, 30% to coverage.
- Network 70. 80% of the operating budget devoted to the goal of ridership, 20% to coverage.
- Network 90. 90% of the operating budget devoted to the goal of ridership, 20% to coverage.
The contrast between these networks is clear and striking. As you turn the dial toward ridership, more frequent service appears where there are lots of people and jobs, but service also disappears where there are few people and jobs. Here are maps of the three concepts:
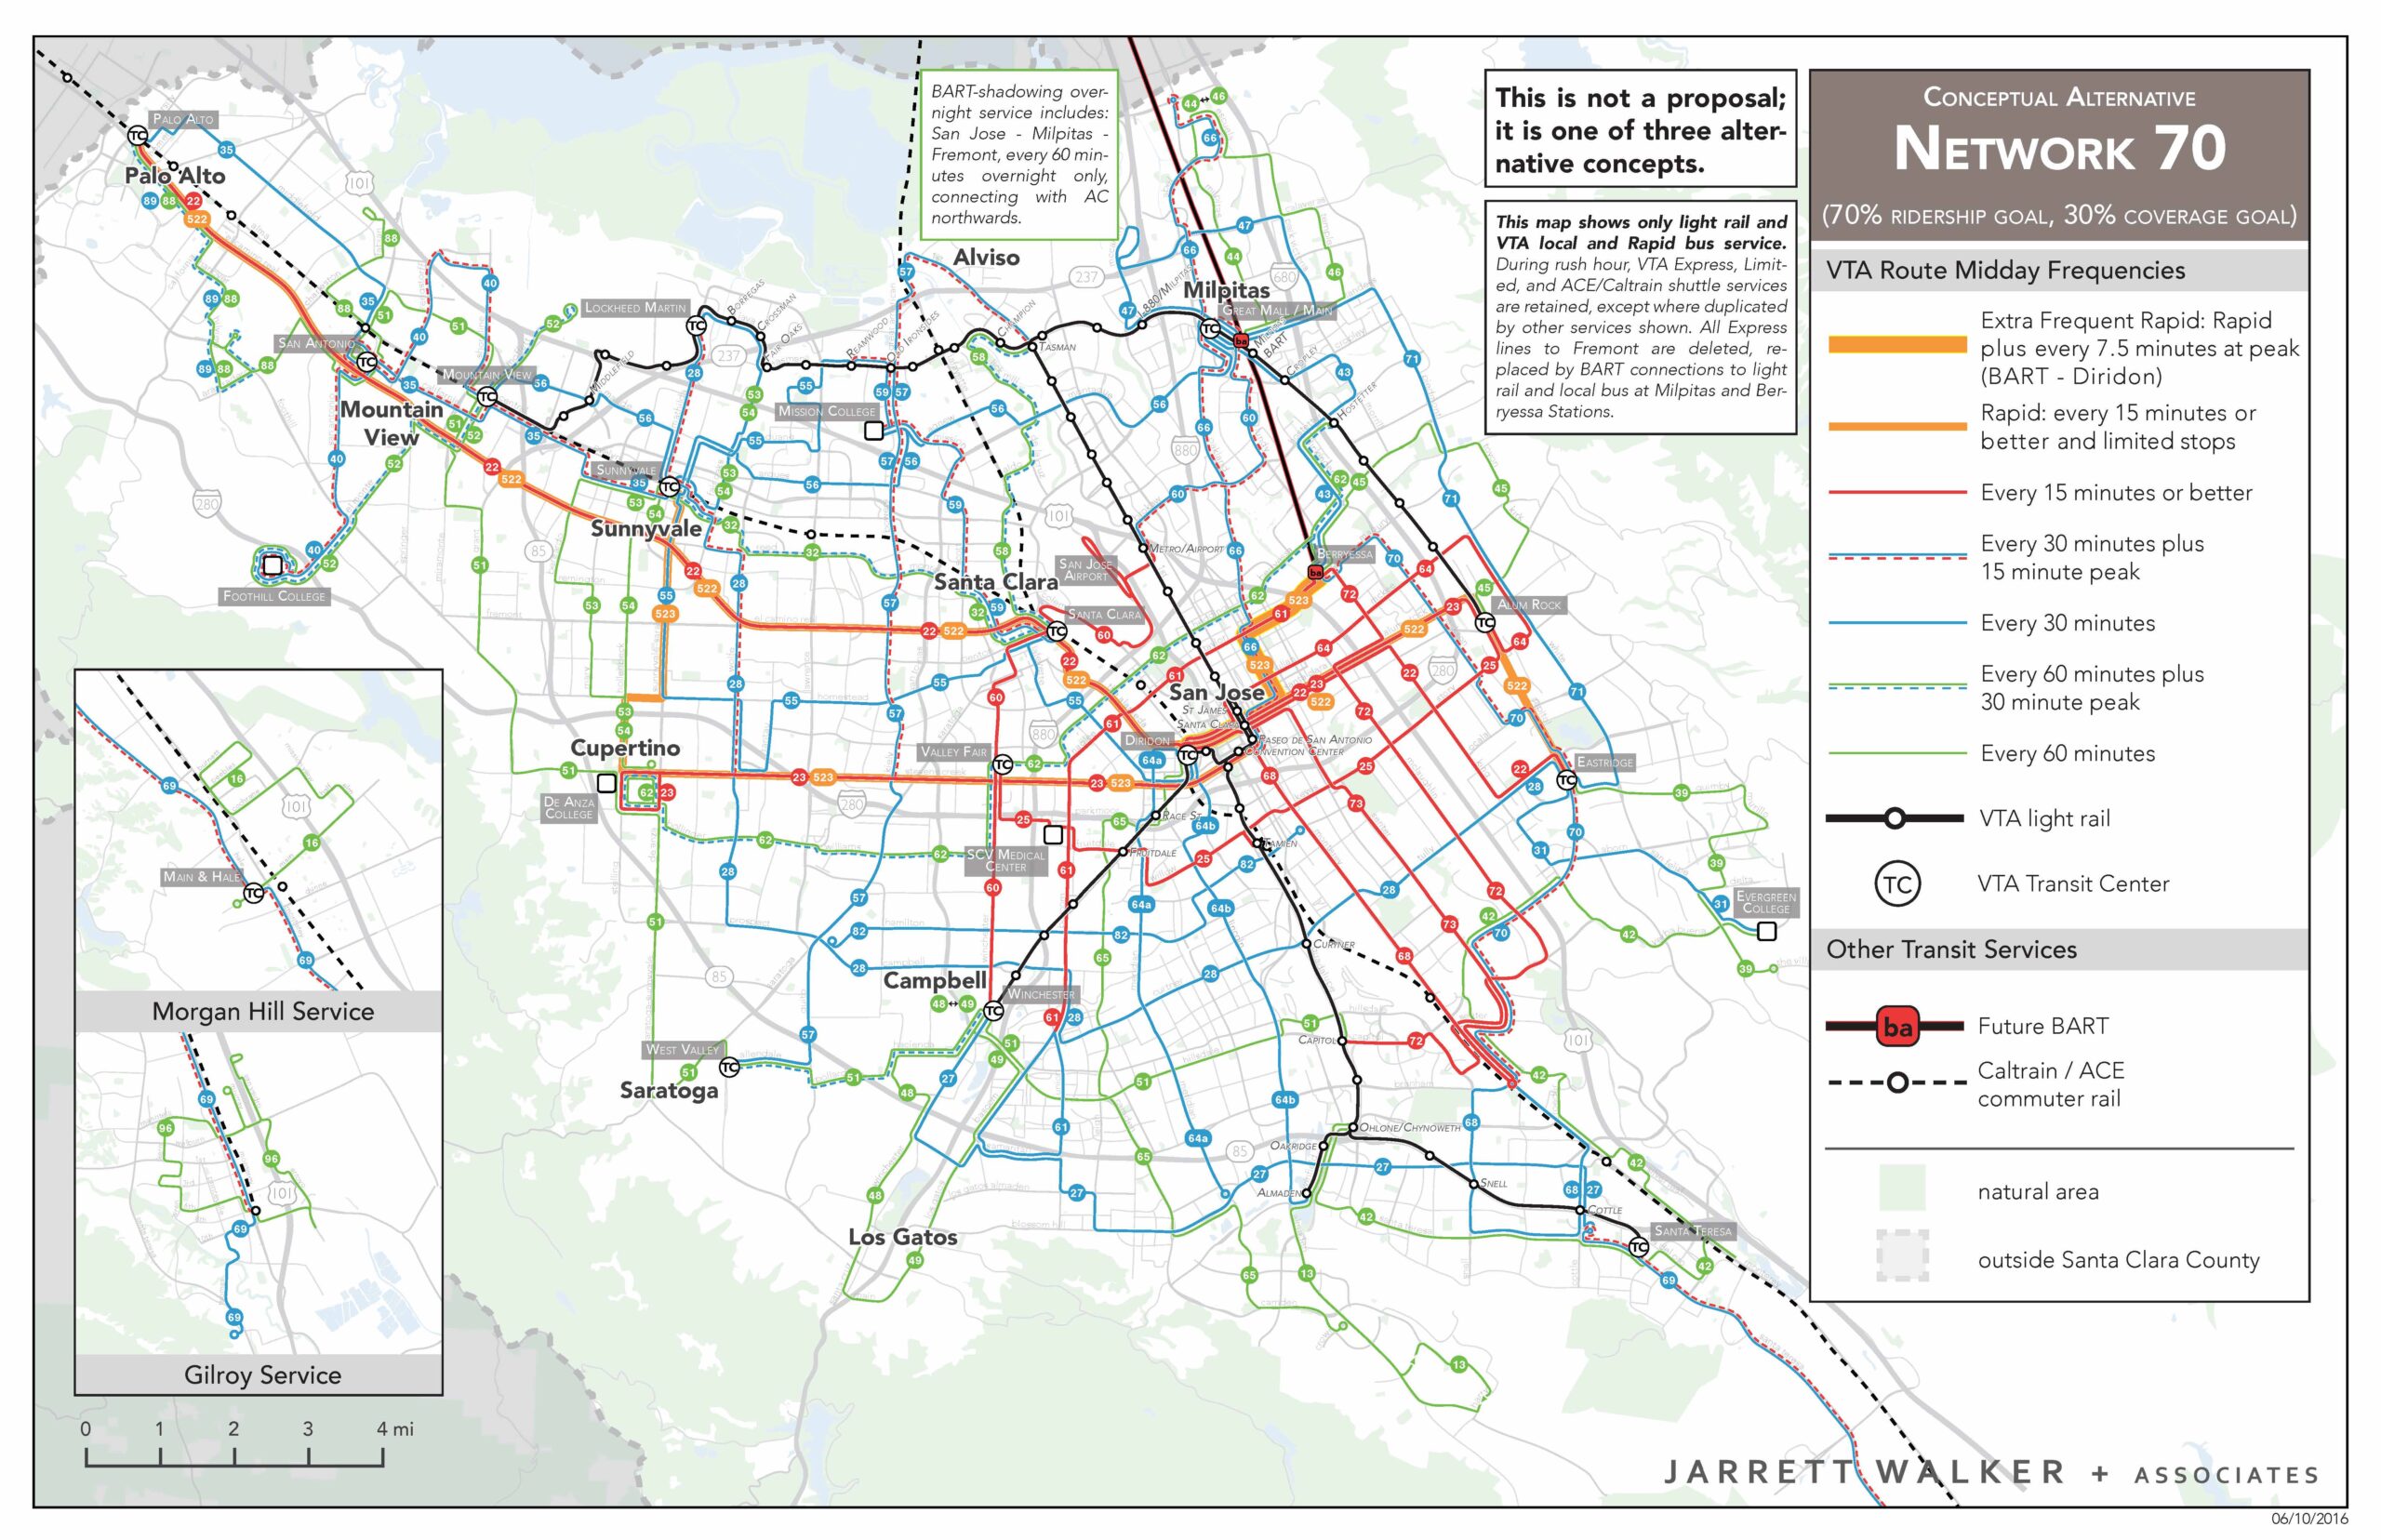
Network 70 Concept: 70% justified by ridership, 30% by coverage
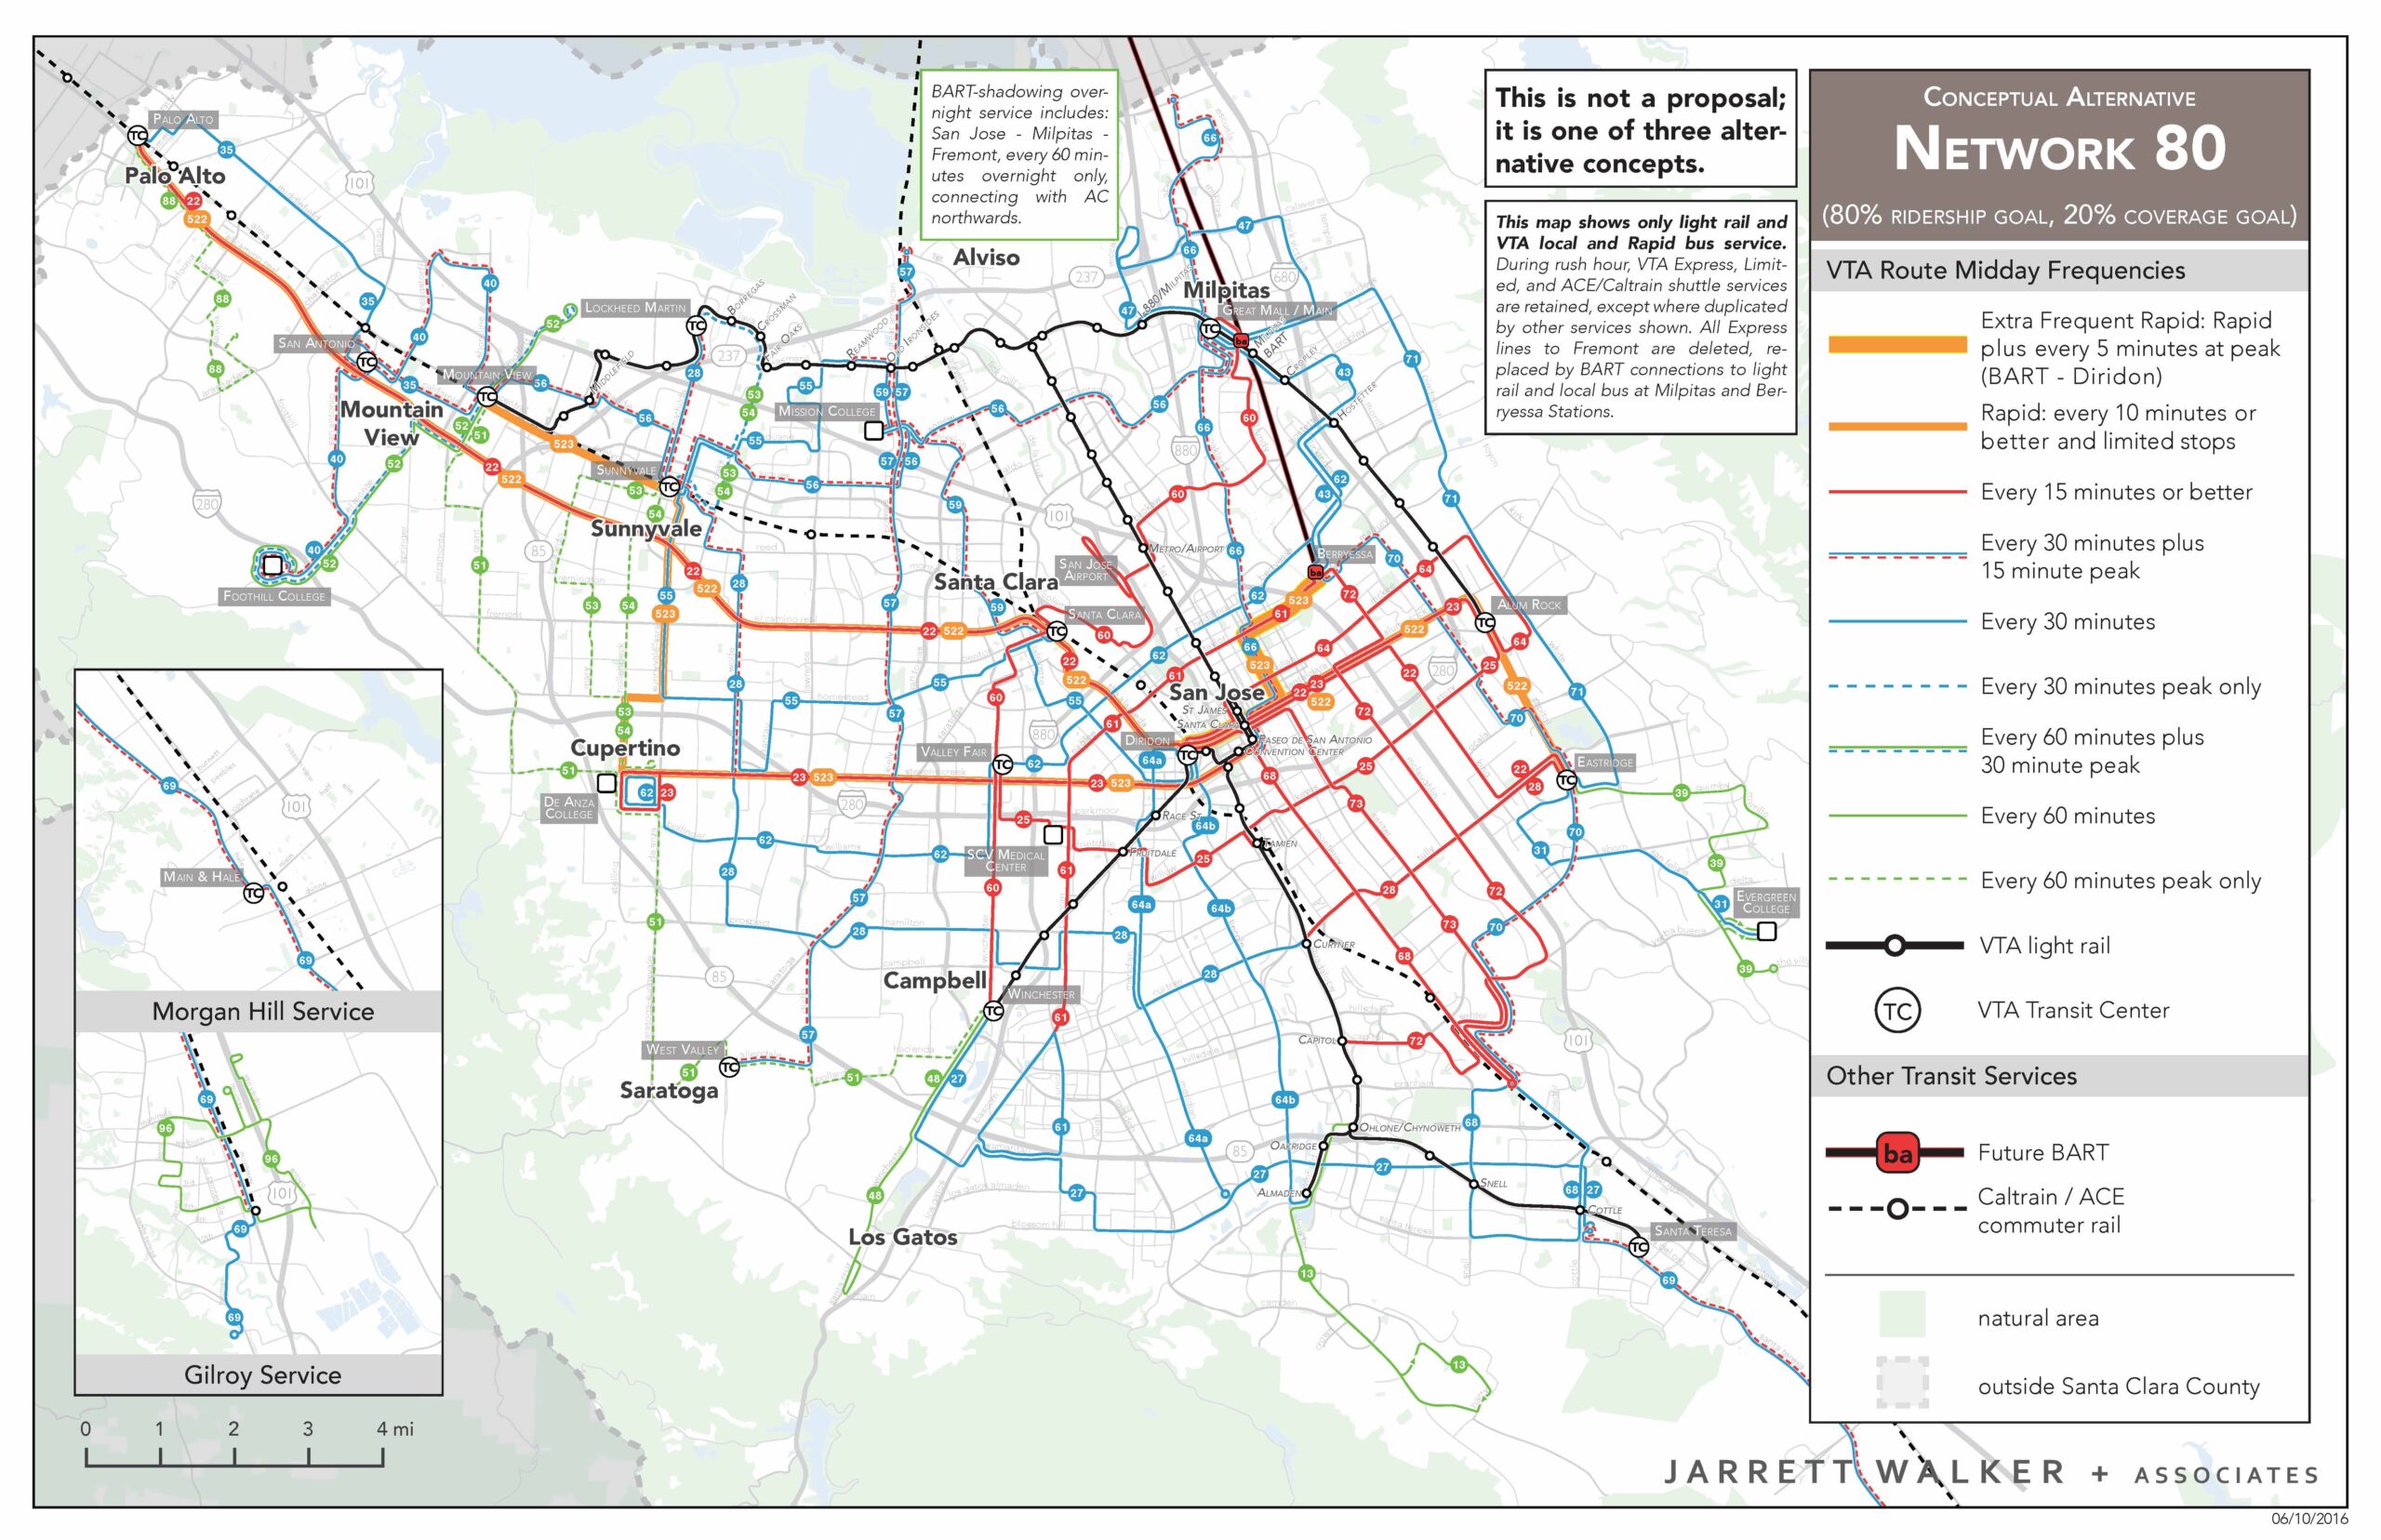
Network 80: 80% of service justified by ridership, 20% by coverage
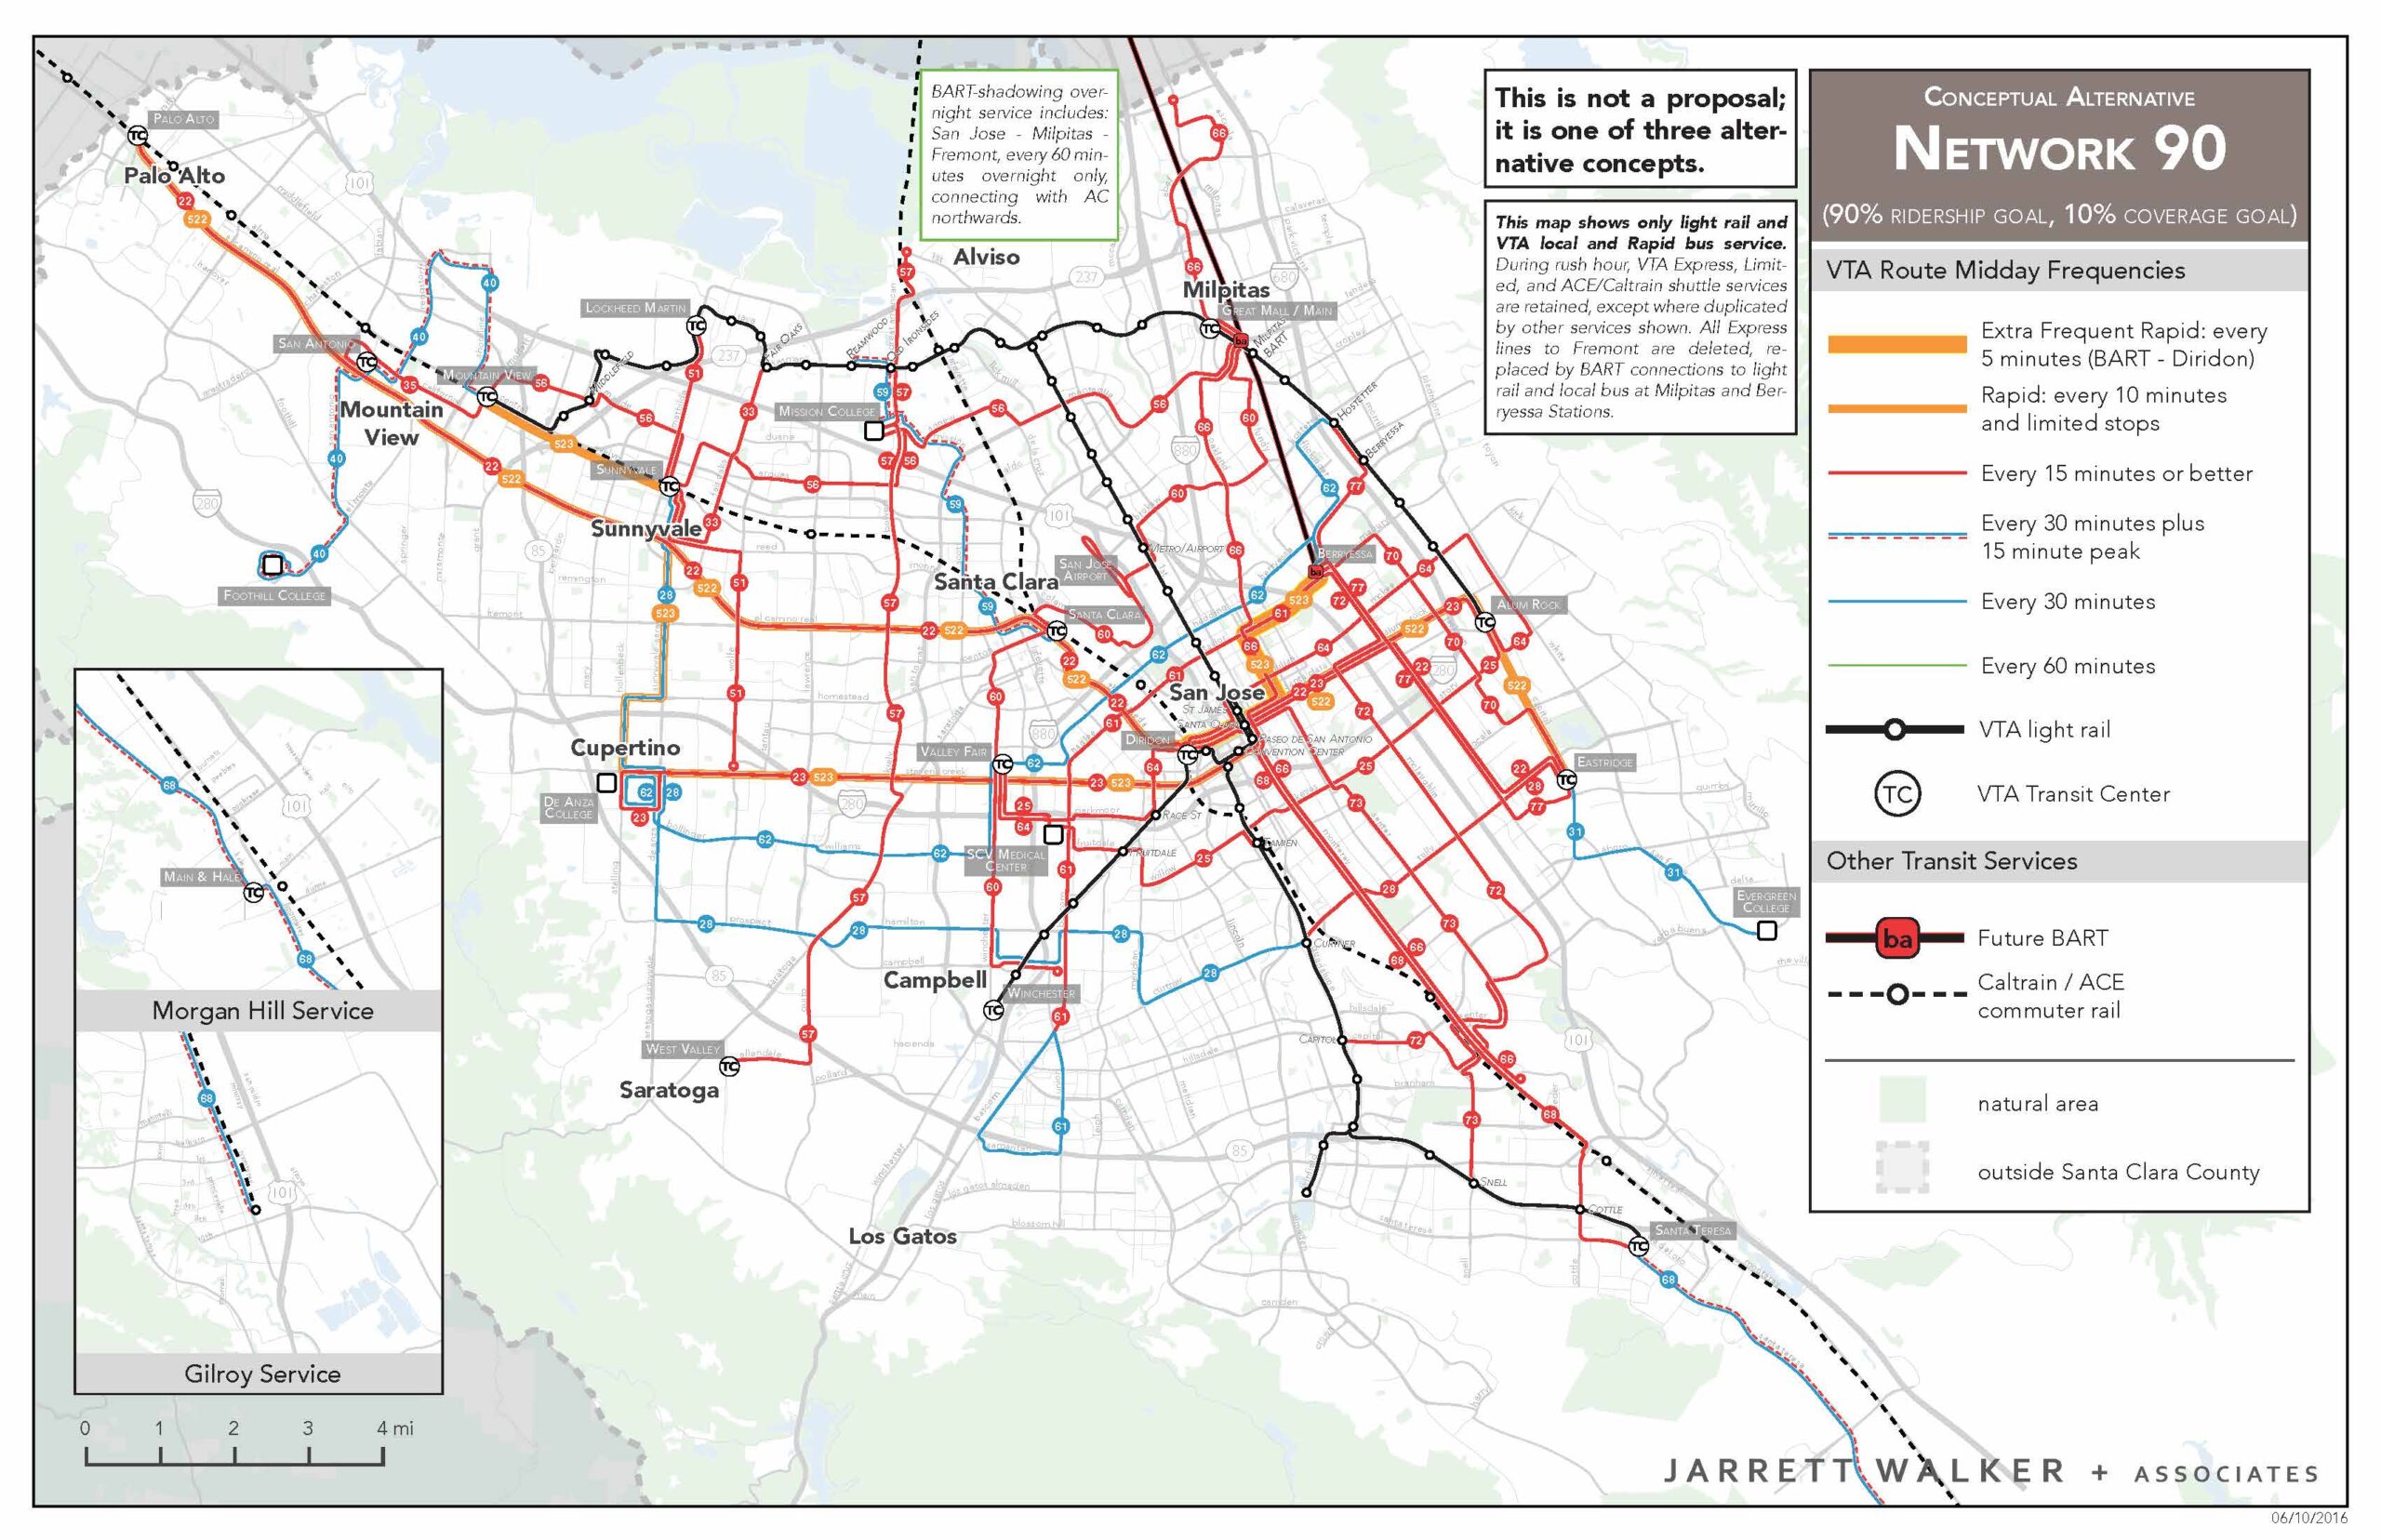
Network 90: 90% of service justified by ridership, 10% by coverage
The networks were all different from the pre-existing network because they presumed the extension of BART from Oakland southward to Berryessa station in eastern San Jose. This extension replaced some bus services that we were able to reallocate. All the networks were redesigns that also improved other inefficiencies in the network.
The use of colors to represent frequency is critical. Without that, Network 90 would look like less service, when in fact it is just more geographically concentrated service.
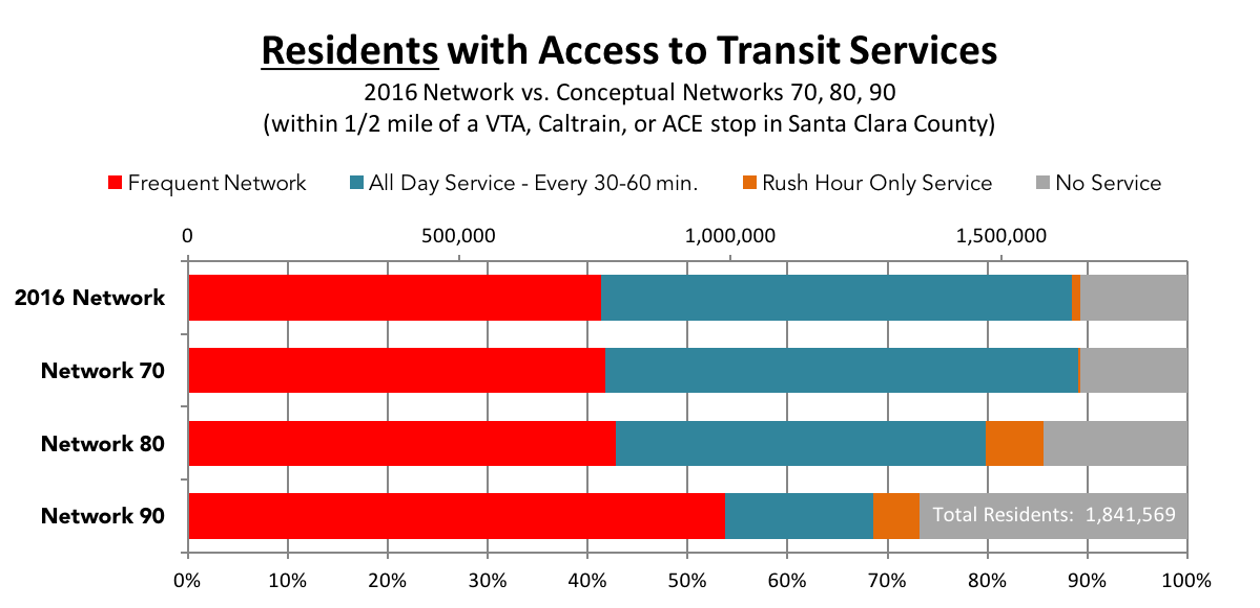
One way to see the impact of the alternatives is to look at how many people are near service of different frequencies. The most extreme ridership-oriented network increased the number of people on high-frequency service (the Frequent Network, which runs every 15 minutes or better at all hours) but also increased the number of people with no service. That’s a net positive for ridership, because the ridership induced by high frequency is generally higher than the ridership lost by deleting the lowest-ridership services.
These alternatives formed the basis of a robust outreach process, including both workshops with community leaders and surveys of the general public. A workshop of community leaders converged on a recommendation that the final plan should be 85% ridership, 15% coverage. Feedback from the general public was almost perfectly polarized, about even numbers preferring each of the three options.
The Board directed us to proceed with designing a network with a split of 85% ridership, 15% coverage. That final plan is here:
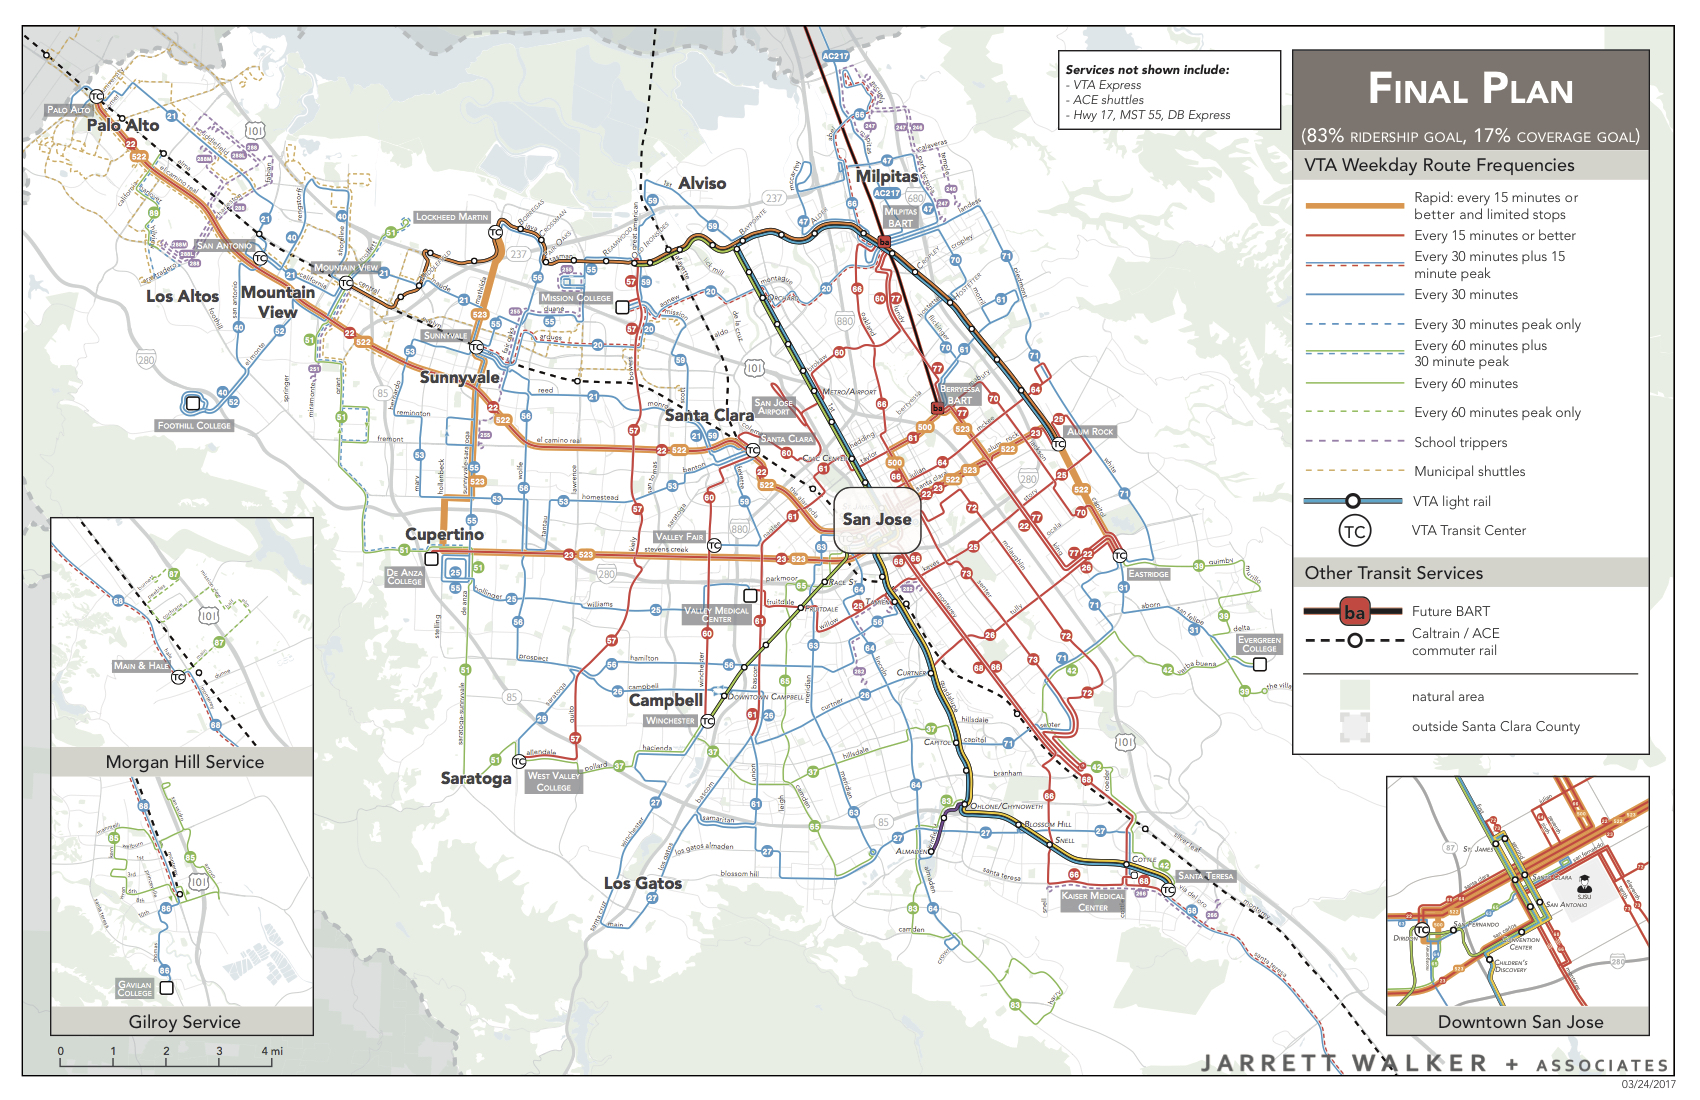
The final Board-adopted plan of 2019
As things turned out, the BART extension that the plan assumed was delayed. After delaying implementation several times waiting for the extension to be finished, VTA finally implemented a modified version of the plan on December 30, 2019, with bus routes temporarily replacing the BART extension. The BART extension finally opened in June of 2020 and the bus service was revised to more closely resemble the final plan.
Obviously, the new network ran for only 9 weeks before the COVID-19 pandemic began. However, in this period, productivity (ridership/quantity of service provided) was up 4% from the same weeks of the previous year. This is very unusual, since normally a major service change causes a slight downtick in ridership, since people who are inconvenienced by the change disappear at once while people who find it convenient take a while to find it and develop new habits of riding. More recently, VTA has seen impressive growth outside the traditional peak. In January 2024, VTA found that their frequent bus network (the red lines on the map, which are the part of the network that is trying to maximize ridership) had nearly returned to pre-pandemic ridership, and reached 108% of pre-pandemic ridership on Sundays.
The new network is now well established. We are honored to continue to have the opportunity to work with VTA, mostly recently in support of their long term planning of high capacity corridors (both rail and Bus Rapid Transit.)