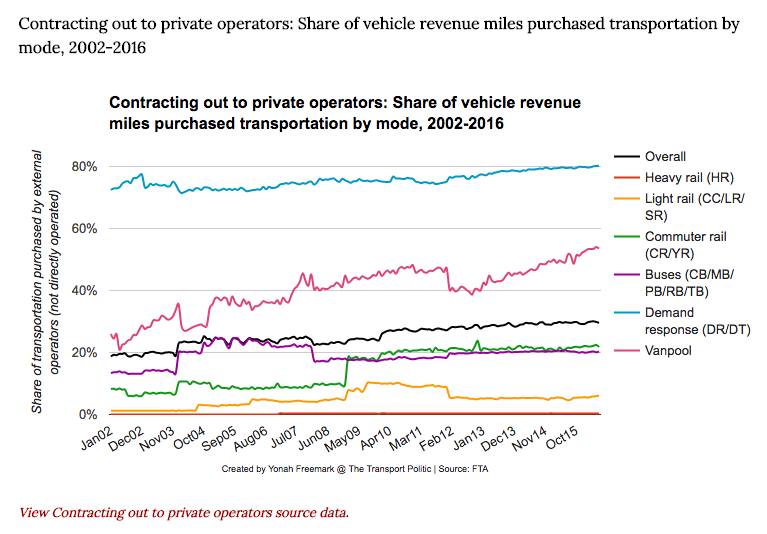
One of our longtime favorite transportation bloggers, Yonah Freemark over at the Transport Politic, has added an excellent new feature to his site: a set of interactive charts detailing key US transportation indicators called the Transport Databook. This does a great job of taking measures that are readily available in public data, though not always easily accessible, and compiling them into simple one stop shop for this kind of information. And the source data is also available in a condensed form that is likely to be easier to use for anyone unfamiliar with the original sources. These charts cover a wide array of transit and transportation trends beyond the familiar ridership, service hours, or VMT stats. For instance:

We’ve already noticed parts of this work fueling a number of Twitter conversations, and hopefully, this site continues as a good resource for people interested in informing themselves about long-term trends in transportation data.
Comments are closed.