The history of transit ridership in the US is what it is:
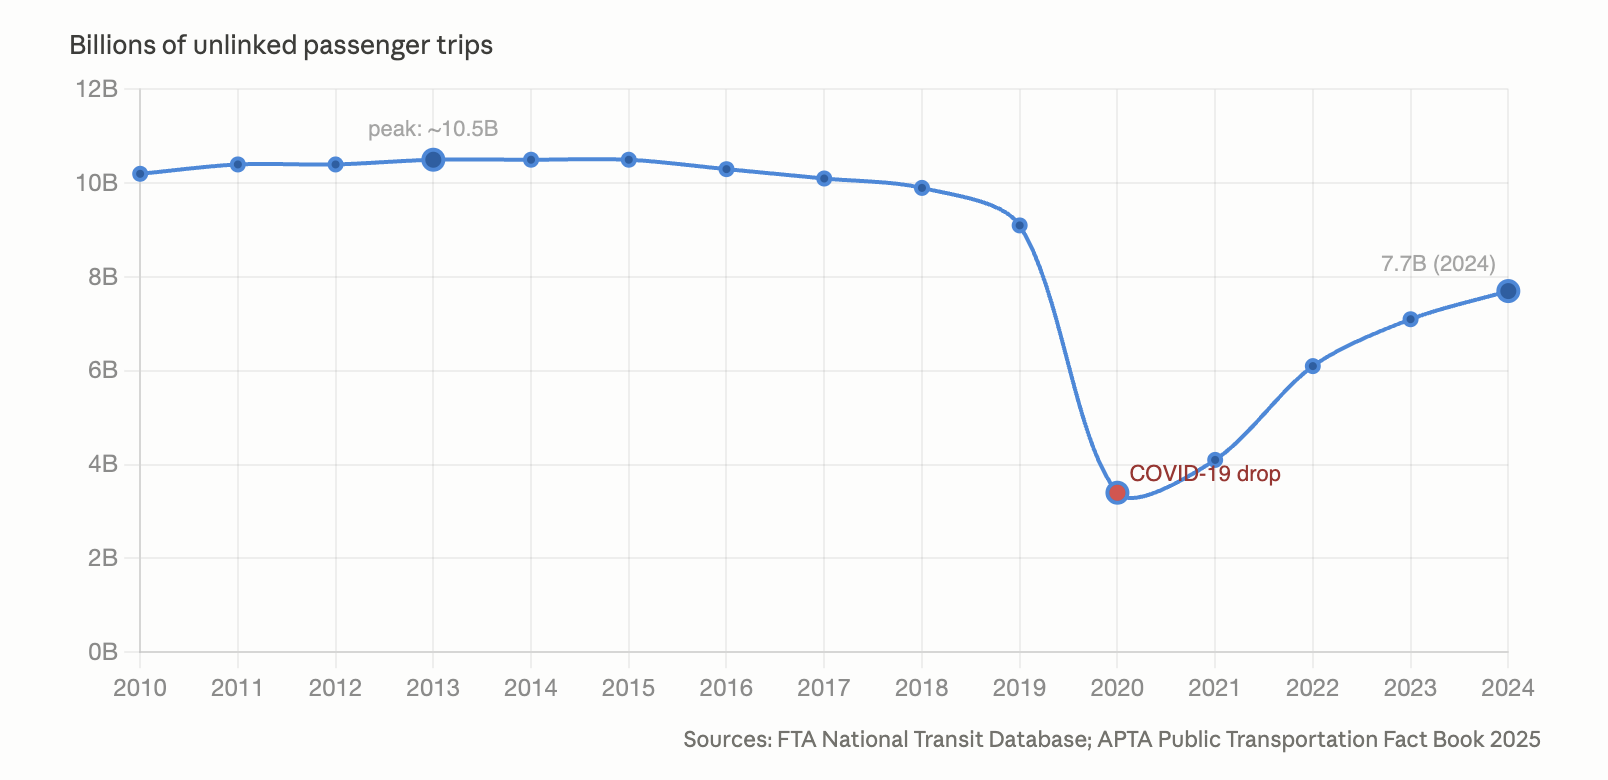
But it matters enormously how we talk about it. Many US transit agencies will be facing the voters in the next two years, seeking new funding to plug their structural deficits and forestall destructive service cuts. Many agencies are already involved in fights for more funding in their state legislatures, sometimes winning, as in Illinois, but often losing, as in Pennsylvania and Oregon.
Most of the voters or legislators in these debates are not well informed, so they can be swayed by the rhetoric used. So transit agencies need to be carefully choosing their language. And we should be talking as an industry about what messages are helping and what aren’t.
I found myself provoked this morning by this well-intentioned tweet from the fine folks at the San Francisco Peninsula regional rail agency Caltrain:
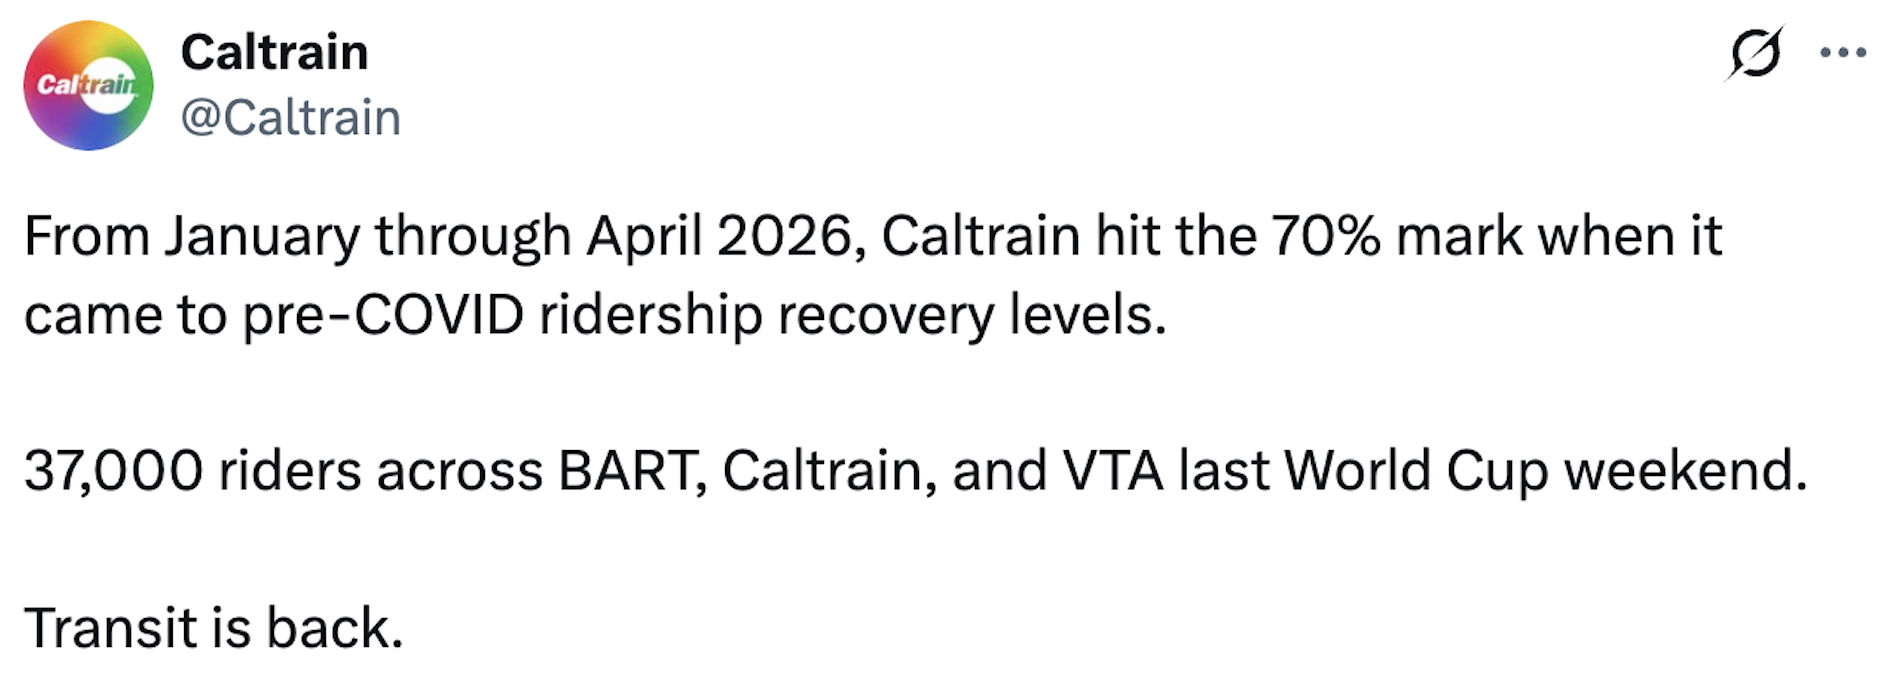
It made me ask: When are we going to stop describing our ridership as a percentage of pre-COVID? Because as long as that’s below 100%, which I expect it to be for a long time, we are playing into a narrative of relative failure, instead of talking about our real success.
In my experience, most reporters and commentators begin with these false assumptions about transit:
- That ridership is the only measure of success.
- That ridership is under the agency’s control.
- That their goal is to get “back” to where they were in 2019.
When journalists interview me, they usually start with these assumptions and I have to say stop, wait:
- Transit has competing definitions of success, so low ridership doesn’t mean failure. The ridership-coverage trade-off is only one example. The boards that govern US transit agencies routinely tell staff to do all kinds of things that are not good for ridership. This is their right, but it means ridership is not the only indicator of success. (Our consulting work is all about making these conversations clearer, so Boards understand the consequences of their choices.)
- Most ridership factors are outside agency control. Work from home caused an overall decline in travel demand, and especially in the kind of concentrated peak demand into major centers that transit can serve easily. Nothing a transit agency can do will change that. It’s clear now that we’re never going back to the office in pre-COVID volumes. The best transit agencies are shifting their service to address other markets where there’s potential to grow ridership, but that means:
- We are attracting new riders, not getting riders “back”. Any new growth in ridership will be in new and different markets. Smart agencies have already made these adjustments (we‘ve often helped) by shifting service to weekends and to more regular all-day patterns, instead of the old intensive peak. (Increasing numbers of agencies are above pre-COVID Saturday ridership as a result.) The great mass of briefcase commuters is gone but there are many others who will use our service if it is useful. So it makes no sense to talk about getting “back” to 2019 performance. Even if that were possible, it’s not a fair description of what we are doing now.
When a transit agency describes their progress in terms of how far “back” to 2019 they are, they concede several things that they shouldn’t be conceding. They imply that 2019, rather than the future, is their north star. The imply that history really can be rolled back. Worst of all, they allow people to fantasize that all this is possible if transit agencies just work harder, from which it’s easy to conclude that if that doesn’t seem to be happening, it means transit agencies are misgoverned and the only way for a voter to object is to vote no on funding them.
Instead, transit agencies need to be much more forthright about explaining:
- what they do and don’t control
- what they’re doing with the control they have
- what is happening in larger travel trends
- why 2019 expectations for transit no longer make sense.
Then, they should tell a data-driven story starting around 2022, when the new world of urban transport demand began to stabilize. Managements turn over frequently in US transit agencies, so you probably can’t judge your current management on what happened more than a few years ago. In any case, the story should be how transit agencies are building for the new world, not how they are bringing back the old one. The first story is about success. The second, no matter how you spin it, will always sound like failure. Nobody can bring back 2019, and nobody who suggests they can is going to look like they’re succeeding.
I just do not see how the “back” narrative leads anywhere good for transit agencies, and would love to hear from those who differ from me.
37,000 riders in an entire weekend between BART, CalTrain, and VTA is an order of magnitude lower than what I would have guessed for the massive population that those trains cover. That seems like a massive failure to say the least.
I don’t think the tweet is referring to systemwide ridership for two train services and Santa Clara County’s transit system. Google’s AI returned to me BART’s Saturday ridership at 109,000 and VTA’s Saturday ridership at 59,000.
I think the 37,000 refers to passengers those three systems specifically transported to Levi’s Stadium in Santa Clara for World Cup games.
37,000 refers to the total inbound and outbound ridership for the first FIFA World Cup game. Those are VTA counts, which would also include transfers to/from BART and Caltrain.
https://www.sfgate.com/travel/article/world-cup-bay-area-transit-22309667.php
“Hendler Ross said ridership numbers tally up each leg of a trip separately, so a person making a round trip actually counts twice. In 2026 alone, VTA has broken its previous ridership record (23,400 for Taylor Swift’s Era Tour concert on July 28, 2023) three times: over 30,000 riders for the Super Bowl in February, over 37,000 on Saturday and now 39,592 riders for Tuesday night’s match.”
great news. I wish VTA success in holding on to these special event riders. Here in Seattle, it has become part of the culture that your first thought when going to a sporting event is to think and plan for light rail. It is likely that is other cities as well.
I’m not sure what that 37,000 number means. BART statistics say that they actually get over double that many riders on an average Sunday: https://www.bart.gov/about/reports/ridership
2025 Calendar Year Average Ridership:
Weekday: 180,649
Saturday: 108,449
Sunday: 78,691
My guess is that the 37,000 is somehow specifically counting World Cup related trips on all three agencies, rather than all trips.
Specific to the situation in Oregon, how does TriMet and other state agencies need to shift their approach to getting funding from the State?
Nobody is optimistic about getting funding out of the state at this point. The solution may have to be regional, or even a City of Portland investment in transit operations.
Many cities/regions had increase in population since 2019. Some have new extra services We should talk about rides per capita, hours per capita, milage per capita and compare the last 30 years.
In Greater Vancouver BC in 2019 we had 100 rides per capita in 2025 it was down to 75.
We need also to compare mode share of Transit and Walking and Cycling vs Driving a car.
In Greater Vancouver 70% of trips are still by car .
Modal share is likely the most important one because lower rates of commuting don’t effect it much. I suppose if commuting was a high percentage of the transit trips then it could make the trend look worse than it really is but the impact on the numbers would be muted.
My guess is Greater Vancouver still does better on those metrics than most North American cities. One consideration is density. If you have a lot of people living in a low density area (like Vancouver does) then it will be difficult to get good numbers, even on those more meaningful metrics. My guess is Vancouver transit does really well when you consider all of the various factors and metrics.
As a transit advocate in my city, I look at ridership as an indication of how well our system is doing. But that may be wrong.
I have the sense that our transit could and should be better than it is. What are some meaningful measures of success besides ridership? I want to hold our transit leadership accountable to some standard if possible (and/or justify my assertion that ours is inadequate and riders deserve better).
There are other metrics. You can have coverage metrics, like what percent of the population lives within X distance of service. Or, you can measure “unique riders”, which is like ridership, but each rider only counts once, no matter how often they ride.
A system that is designed to maximize one metric may not necessarily maximize another. For example, Jarrett loves to talk about ridership/coverage tradeoffs. There are also tradeoffs between total riders and unique riders, for example, serving airports may have only a modest effect on total riders, but it has a huge effect on unique riders, as it leaves every local resident who flies, as well as every out-of-towner who visits, as a potential customer.
Laura
Access to opportunity is a measure that tracks with ridership potential but also connects to people who don’t care about that: https://humantransit.org/basics-access-or-the-wall-around-your-life
J
Interesting point about commuter trips being down overall. I’d be curious to see the transit usership curve compared with vehicle trips over the same period. It would be interesting if they both followed a similar trend.
I would also think that unique riders–ridership numbers may be more useful than total. As many workers are now only going to the office 2-3 times a week, but more “unique people” are taking transit. This is particularly true in Seattle with the large number of people on light rail for non-work trips. Saturday has often been the busiest day of the week. People going to all sorts of places for all sorts of reasons, just not the same people every day to work and back.
A different issue with the “back to 2019” narrative is that 2019 wasn’t peak ridership for most systems. Nationally, ridership peaked in 2014. So if (and you make a good argument that you shouldn’t) you want to get back to anything, that should be your reference point.
>> We are attracting new riders, not getting riders “back”. Any new growth in ridership will be in new and different markets.
This is a key point. It is easy to assume that things would go back to they were before the pandemic but that isn’t the case. Working from home was a trend that accelerated during the pandemic and a lot of those commuters aren’t coming back. There are commuter rail systems that will never get the ridership they did in the past. This doesn’t bode well for other systems focused on those type of riders. It is quite likely that BART will never get the ridership it had ten years ago. In contrast, DC Metro — a more traditional metro — is approaching that number. It has lost plenty of commuters but is making it for it with more ridership for other trips. Then you have systems that are expanding while all of this is going on. Seattle just so happened to build its most important rail segments during the pandemic (or after) which means the number of riders on Link look especially good. (In contrast, overall transit ridership is still down in the region.)
The same thing is true with bus networks. Agencies are adjusting to this new reality. They just aren’t going to fill up the commuter buses every morning and evening. They have to get more riders in the middle of the day to make up for this shortfall. Doing so can actually be cheaper. But there are other issues like funding and routing that definitely impact ridership. (That is the case in Seattle.)
Then there are other factors like population growth as Nathan mentioned up above. Ridership is an easy number to get but it really doesn’t tell the whole story.
>> We are attracting new riders, not getting riders “back”. Any new growth in ridership will be in new and different markets.
This is a key point. It is easy to assume that things would go back to they were before the pandemic but that isn’t the case. Working from home was a trend that accelerated during the pandemic and a lot of those commuters aren’t coming back. They aren’t driving to work or taking transit. There are commuter rail systems that will never get the ridership they did in the past. This doesn’t bode well for other systems focused on those type of riders. It is quite likely that BART will never get the ridership it had ten years ago. In contrast, DC Metro — a more traditional metro — is approaching pre-pandemic ridership. It has lost plenty of commuters but is making it for it with more ridership for other trips. Then you have systems that are expanding while all of this is going on. Seattle just so happened to build its most important rail segments during the pandemic (or after) which means the number of riders on Link look especially good. (In contrast, overall transit ridership in the region is still down.)
The same thing is true with bus networks. Agencies are adjusting to this new reality. They just aren’t going to fill up the commuter buses during rush hour. They have to get more riders in the middle of the day to make up for this shortfall. Doing so can actually be cheaper. But there are other issues like funding and routing that definitely impact ridership. (That is the case in Seattle.)
Then there are other factors like population growth as Nathan mentioned up above. Ridership is an easy number to get but it really doesn’t tell the whole story.
Amazing explanation. this topic is becoming more important in 2026. I will share this with my friends.
#2 is so critical. In Houston, critics compare ridership data to 2001. But there are at least five reasons why that basis for comparison could be expected to result in a negative comparison on this indicator alone:
A. Calendar year versus Fiscal Year. Well, actually they start by presenting the data on a calendar year basis rather than a fiscal year basis so that the reported numbers do not agree and then accuse the agency of reporting inaccurate numbers. It was very hard to move on to the next few explanations when our Board Chair and President and CEO had accepted the allegation of inaccuracy before they even asked staff to provide an explanation.
B. Inclusion of Special Events. During 2001, Harris County was constructing nrg Stadium on the same site as the Astrodome. With all of the construction equipment on site, there was little to no parking available for the Houston Livestock Show and Rodeo, a 23-day special event that attracts large crowds to both the livestock show (day and night) and the rodeo which features primarily country-western entertainers performing before what as then among the largest venues with sell-out crowds nightly. The only way to get to the Astrodome was via public transit which meant that everyone attending these events – millions of unlinked passenger trips – were added to ridership reporting. Needless to say, this led to dramatically increased ridership in 2001 relative to 2000 – and then contributed to a dramatic decrease in 2002 relative to 2001 when construction was completed and thousands of parking spots became available for non-transit riders.
C. Dedicated Service for Texas Medical Center employees. During 2001, METRO operated three dedicated shuttle routes for TMC employees. Per a poorly written MOU, TMC was paying METRO based upon seriously outdated rates. When METRO adjusted these rates, TMC balked at continuing the services. Then the individual hospitals chose to offer their own independent shuttle services, viewing these as a marketing approach designed to attract doctors and nurses. Discontinuation of these dedicated services resulted in a loss of more than 2 million annual boardings.
D. Changing Work Demographics. Starting in 2008, several bus routes began to see significant decreases in weekday ridership as the original batch of baby boomers turned 62 and elected to retire. They were still riding the services to get to the grocery stores and doctors appointments on an irregular basis but no longer needed to ride twice daily five days per week to go to work.
Add the that the reality that post-COVID-19 many businesses elected not to return to rented downtown Houston offices but rather allow employees to work remotely and you have five logical explanations for ridership decreases, none of which were / are a reflection of declining service quality but rather external factors over which an agency has little to no control.
“When are we going to stop describing our ridership as a percentage of pre-COVID? […] we are playing into a narrative of relative failure”
Caltrain IS a failure. Caltrain has only just reached ⅔ of pre-pandemic average weekday ridership, despite spending over $2 billion on electrification and a new fleet, reducing travel times by 5 to 10 minutes for typical trips, and bringing half-hourly all-day service to all stations. The improvements are nearly 2 years old, and ⅓ LESS RIDERSHIP is the best result that the board, the executives, the management, the planners, the consultants, and the vendors could deliver?
The Bay Area’s local bus systems, which never benefitted from such lavish capital investment, and which are providing much less service than before the pandemic, due to declining operating subsidies, are approaching pre-pandemic ridership levels.
I’ve gotten around on public transit all my life. I’ve been scrutinizing schedules, fares, operating budgets, and capital projects, and participating in the public process, for 30 years. I’m tired of making excuses for the transit industry!
Ridership is one of the few objective indicators of success. Transit agencies do have control. If they plan, build, and operate systems that match people’s needs, people will ride. In what other industry do we celebrate output without regard for demand?
So, what should Caltrain do differently now?
Thanks for the question.
Caltrain spends lavishly on consultants and for-profit vendors. Why should I offer free advice? 🤣
In all seriousness, it’s a question of what the region, not Caltrain, should do differently. Caltrain is a 3-county fiscal and political monster. Two counties are deeply suburban and the line ends in San Francisco, the only dense urban area served. Rail at any cost drains capital (abundant) and operating money (scarce).
1. For a dramatic reduction in ongoing operating and future capital costs, replace the Gilroy-San José train with a quality express bus: single-door (neighborhood collector, half of trips in Gilroy, half in Morgan Hill, then interleaved freeway express to San José), one fare structure, one schedule, one agency for both modes. Today, a minimum of 3 pricey peak-only train crews and 3 legacy diesel trains are needed to operate 4 commute-only round-trip trains used by 400 people TOTAL. A different agency operates a naïve weekday daytime express bus in a straight line up and down the freeway. The train stations/bus stops are isolated park-and-ride lots. There’s one payment card but the fare structures are separate. The bus schedule doesn’t list trains onward from San José and the train schedule doesn’t list buses arriving from Gilroy.
2. End all trips at San José Diridon rather than sending half the trains down to Tamien, a station with negligible ridership. Other people have modeled this and demonstrated that it would save another whole train crew. Of the few riders who use Tamien, those who ride Light Rail or drive can switch to Diridon.
3. Fill seats by encouraging short rides. To do so, replace coarse fare zones with modern, distance-based fares, or overlay a price cap for short cross-zone trips (easy with the payment card, known locally as Clipper, the proprietary ticket app, and the proprietary ticket vending machines). Today’s arbitrary zone boundaries mean that nobody makes trips like Mountain View-Santa Clara ($6.25 for 12 minutes), Redwood City-Palo Alto ($6.25 for 8 minutes), or Redwood City-Menlo Park (the coup de grâce, $6.25 for 5 minutes) spontaneously on Caltrain, even though there are plenty of empty seats.
4. Fill seats by allowing youths under 19 to ride for free with no ticket or payment card. This proved to be a politically popular way to inflate train ridership and build support for renewing the SMART tax in Marin and Sonoma Counties. The Caltrain youth fare is $1 before transaction and enforcement costs, so the revenue loss would be negligible.
These are the simple ideas, to start. Unit operating cost (the choice of denominator is a separate conversation) net of fares is an objective success metric to complement ridership. With ridership as bad as it is, almost 2 years post-electrification, reducing unit operating cost without shedding riders (1, 2) is especially wise. Politics, the personal ambitions of the board members, executives, and managers of various agencies, and the influence of consultants and vendors, are the barriers.
Paul. I agree with a lot of this, but all these suggestions are pretty marginal to the main SF-SJ product of Caltrain, which I would emphatically say is not a failure. It’s a successful service with some silly things that politicians have tacked onto it over the years, which is something different.
Thanks for replying.
Make no mistake, the ridership loss would be marginal, but the cost reduction, substantial! Those peak-only Caltrain crews are extremely expensive.
Base San José/San Francisco Caltrain service itself is scheduled inefficiently, with excessive crew idle time for turn-arounds in San Francisco. Richard Mlynarik is one person who has built computer models of Caltrain crewing under various timetables. Without reducing service between San José and San Francisco, Caltrain could knock off more than ⅕ of crew costs with his suggestions, which go further than mine. The number of electric trainsets needed for regular service would also drop. Of course, the capital is stranded. Both Caltrain and BART own more new rolling stock than they have riders to fill, let alone money to operate.
Removing Gilroy service would put an end to diesel operations and the diesel fleet. Politically, I’d float a Caltrain diesel ready-reserve as an emergency preparedness measure and raise money for it separately. That was precisely the playbook that the Metropolitan Transportation Commission and the State of California used to unburden Bay Area cities of their ferry services. And so the Water Emergency Transportation Authority (WETA) was born!
The inescapable failure at Caltrain is that a $2.44 billion electrification project attracted little net new ridership.
To distinguish natural post-pandemic ridership recovery from the effects of Caltrain electrification, we can compare BART with Caltrain. The comparison is approximate, but BART’s Blue, Yellow, and especially Green Lines link San Francisco to deep suburbs, just like the sole Caltrain line (even without South County diesel service). The reduction in Downtown San Francisco office and retail occupancy affects Caltrain and BART equally. Some of the very same employers have conducted mass layoffs on the San Francisco Peninsula (Caltrain) and in Pleasanton (BART Blue Line). Multi-family housing towers have popped up in Downtown San José (Caltrain), Downtown and Uptown Oakland (BART), and Warm Springs and Milpitas (BART Green Line).
Although weekend ridership has increased on BART and Caltrain, it’s still a fraction of weekday ridership, so I’ll focus on weekday results.
Weekday BART ridership is ½ the historic peak achieved in the fiscal year ended June 30, 2016 (and regrettably, less than half the pre-pandemic level). For more than 2 years, BART has been operating essentially the same level of service as before the pandemic. On weekdays, evening and night service is unchanged, midday service is greater on the Yellow Line, and daytime service is very slightly reduced everywhere else.
Weekday Caltrain ridership is ⅔ the pre-pandemic level. It was almost 2 years ago that the electrification project was completed and Caltrain doubled mid-day weekday service to half-hourly and shaved off 5 to 10 minutes of travel time. (N.B.: most trips are not end-to-end.)
⅔ less ½ is only ⅙ , a terrible return on a $2.44 billion capital investment, to say nothing of the ongoing increase in operating costs. This is why I hold out for ridership as one honest measure of demand. If you build it, they don’t necessarily come.
Corrections to my August 19, 2026 22:12 post:
I wrote the opposite of what I meant to about BART. Weekday ridership is ½ the pre-pandemic level and regrettably, less than ½ the historic 2016 peak.
Grammar: …more rolling stock than they have riders to fill *it with*
In summarizing weekday service changes, I should have added that Caltrain doubled not only mid-day but also evening and night service.
Cheers!