 It is a difficult year for transit agencies all over the US, as a range of converging problems is pushing budgets out of balance. I discussed the problems in more detail in this post on Portland, but they are common across the country: the expiration of Covid relief funding, rising costs of security, and difficulties in hiring that lead to paying more for the essential staff that keep transit networks running.
At our firm, we’re in the midst of this. We helped Louisville with a large redesign in the context of a service reduction, and are now working on similar projects in Milwaukee and Denver. Milwaukee’s is live now and is worth a look. Here is their project page. If you know anyone in Milwaukee, please make sure they look at this page, and take our survey, before October 26.
In order to stabilize the transit system for the next three years, through 2030, Milwaukee County Transit System needs to reduce service 25%. Nobody at the agency wants to do this, but they don’t believe they have a practical alternative. Obviously, a new funding source is needed, like the one the State of Illinois just created for greater Chicago, but the political consensus around that has not yet been built. We expect this process, showing what it would mean to not solve that problem, will help focus attention on solutions.
Meanwhile, we have to plan for the situation we have. So we’ve drawn two contrasting scenarios for what a 25% reduction could look like, depending on the goal of the transit network:
- The Ridership Concept tries to protect as much ridership as possible, by focusing the network where demand is greatest and protecting frequent service there.
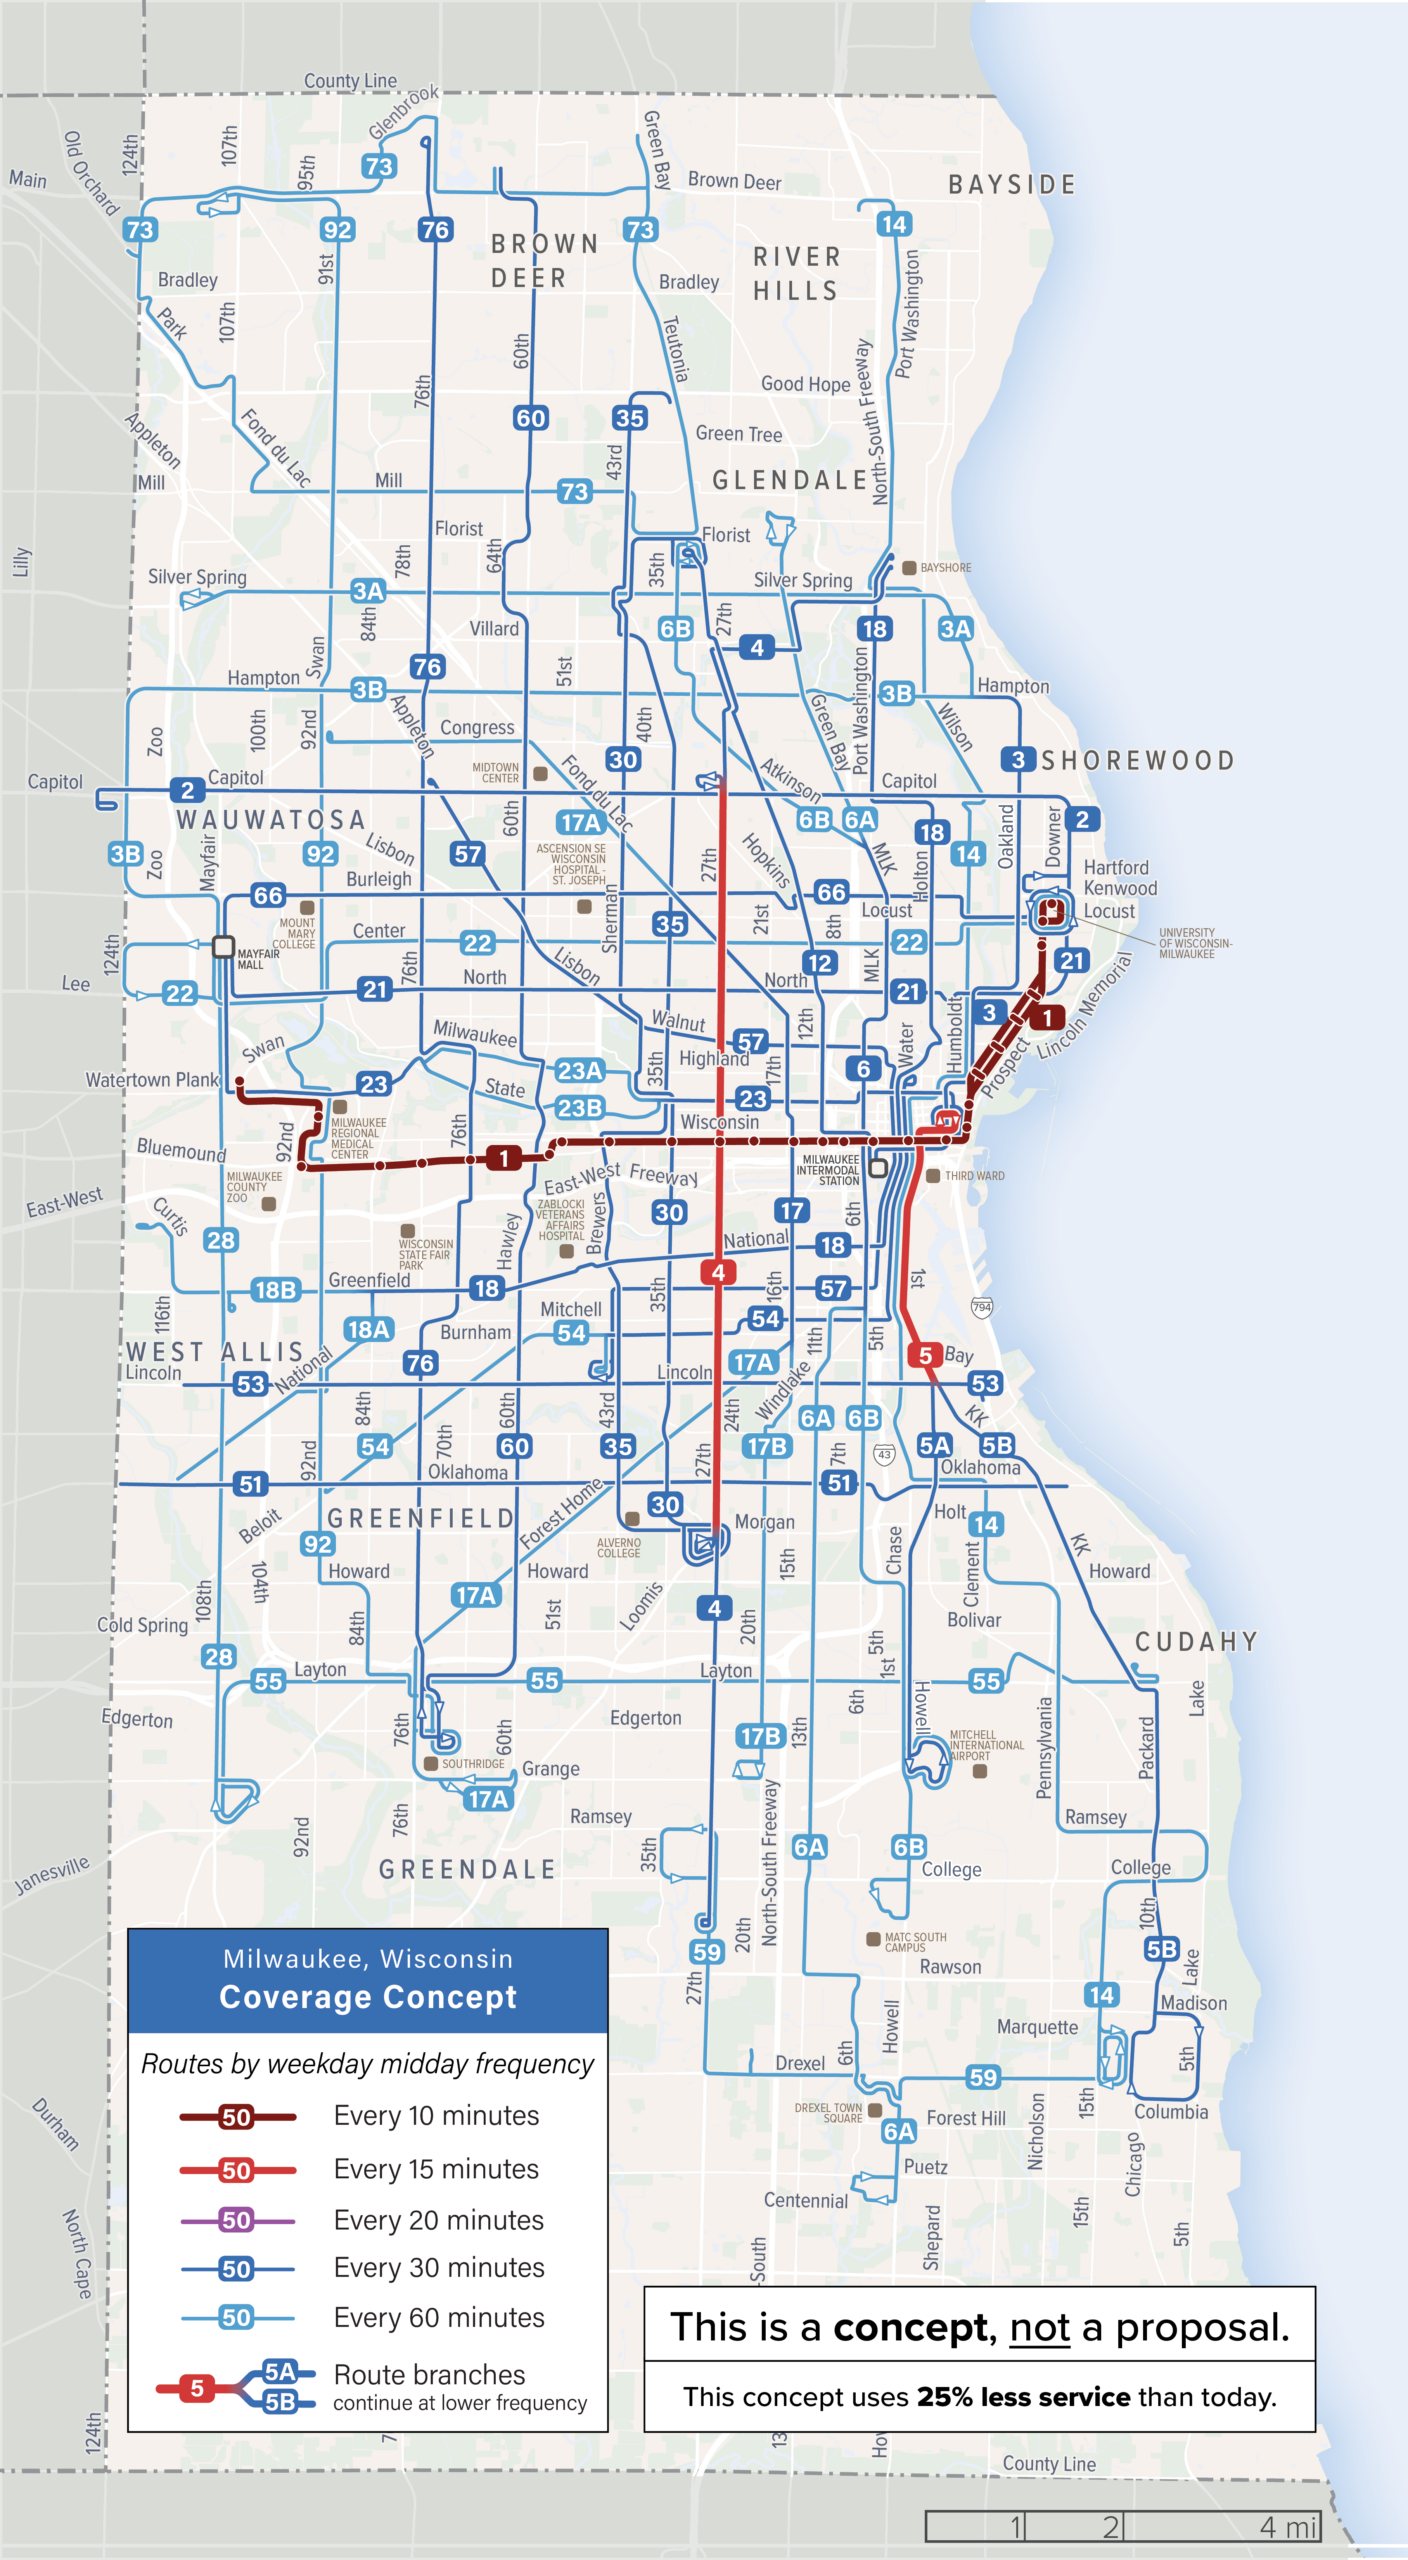
- The Coverage Concept tries to retain service to everyone who has service now, but this means that frequencies are reduced, which will cause deeper drops in ridership.
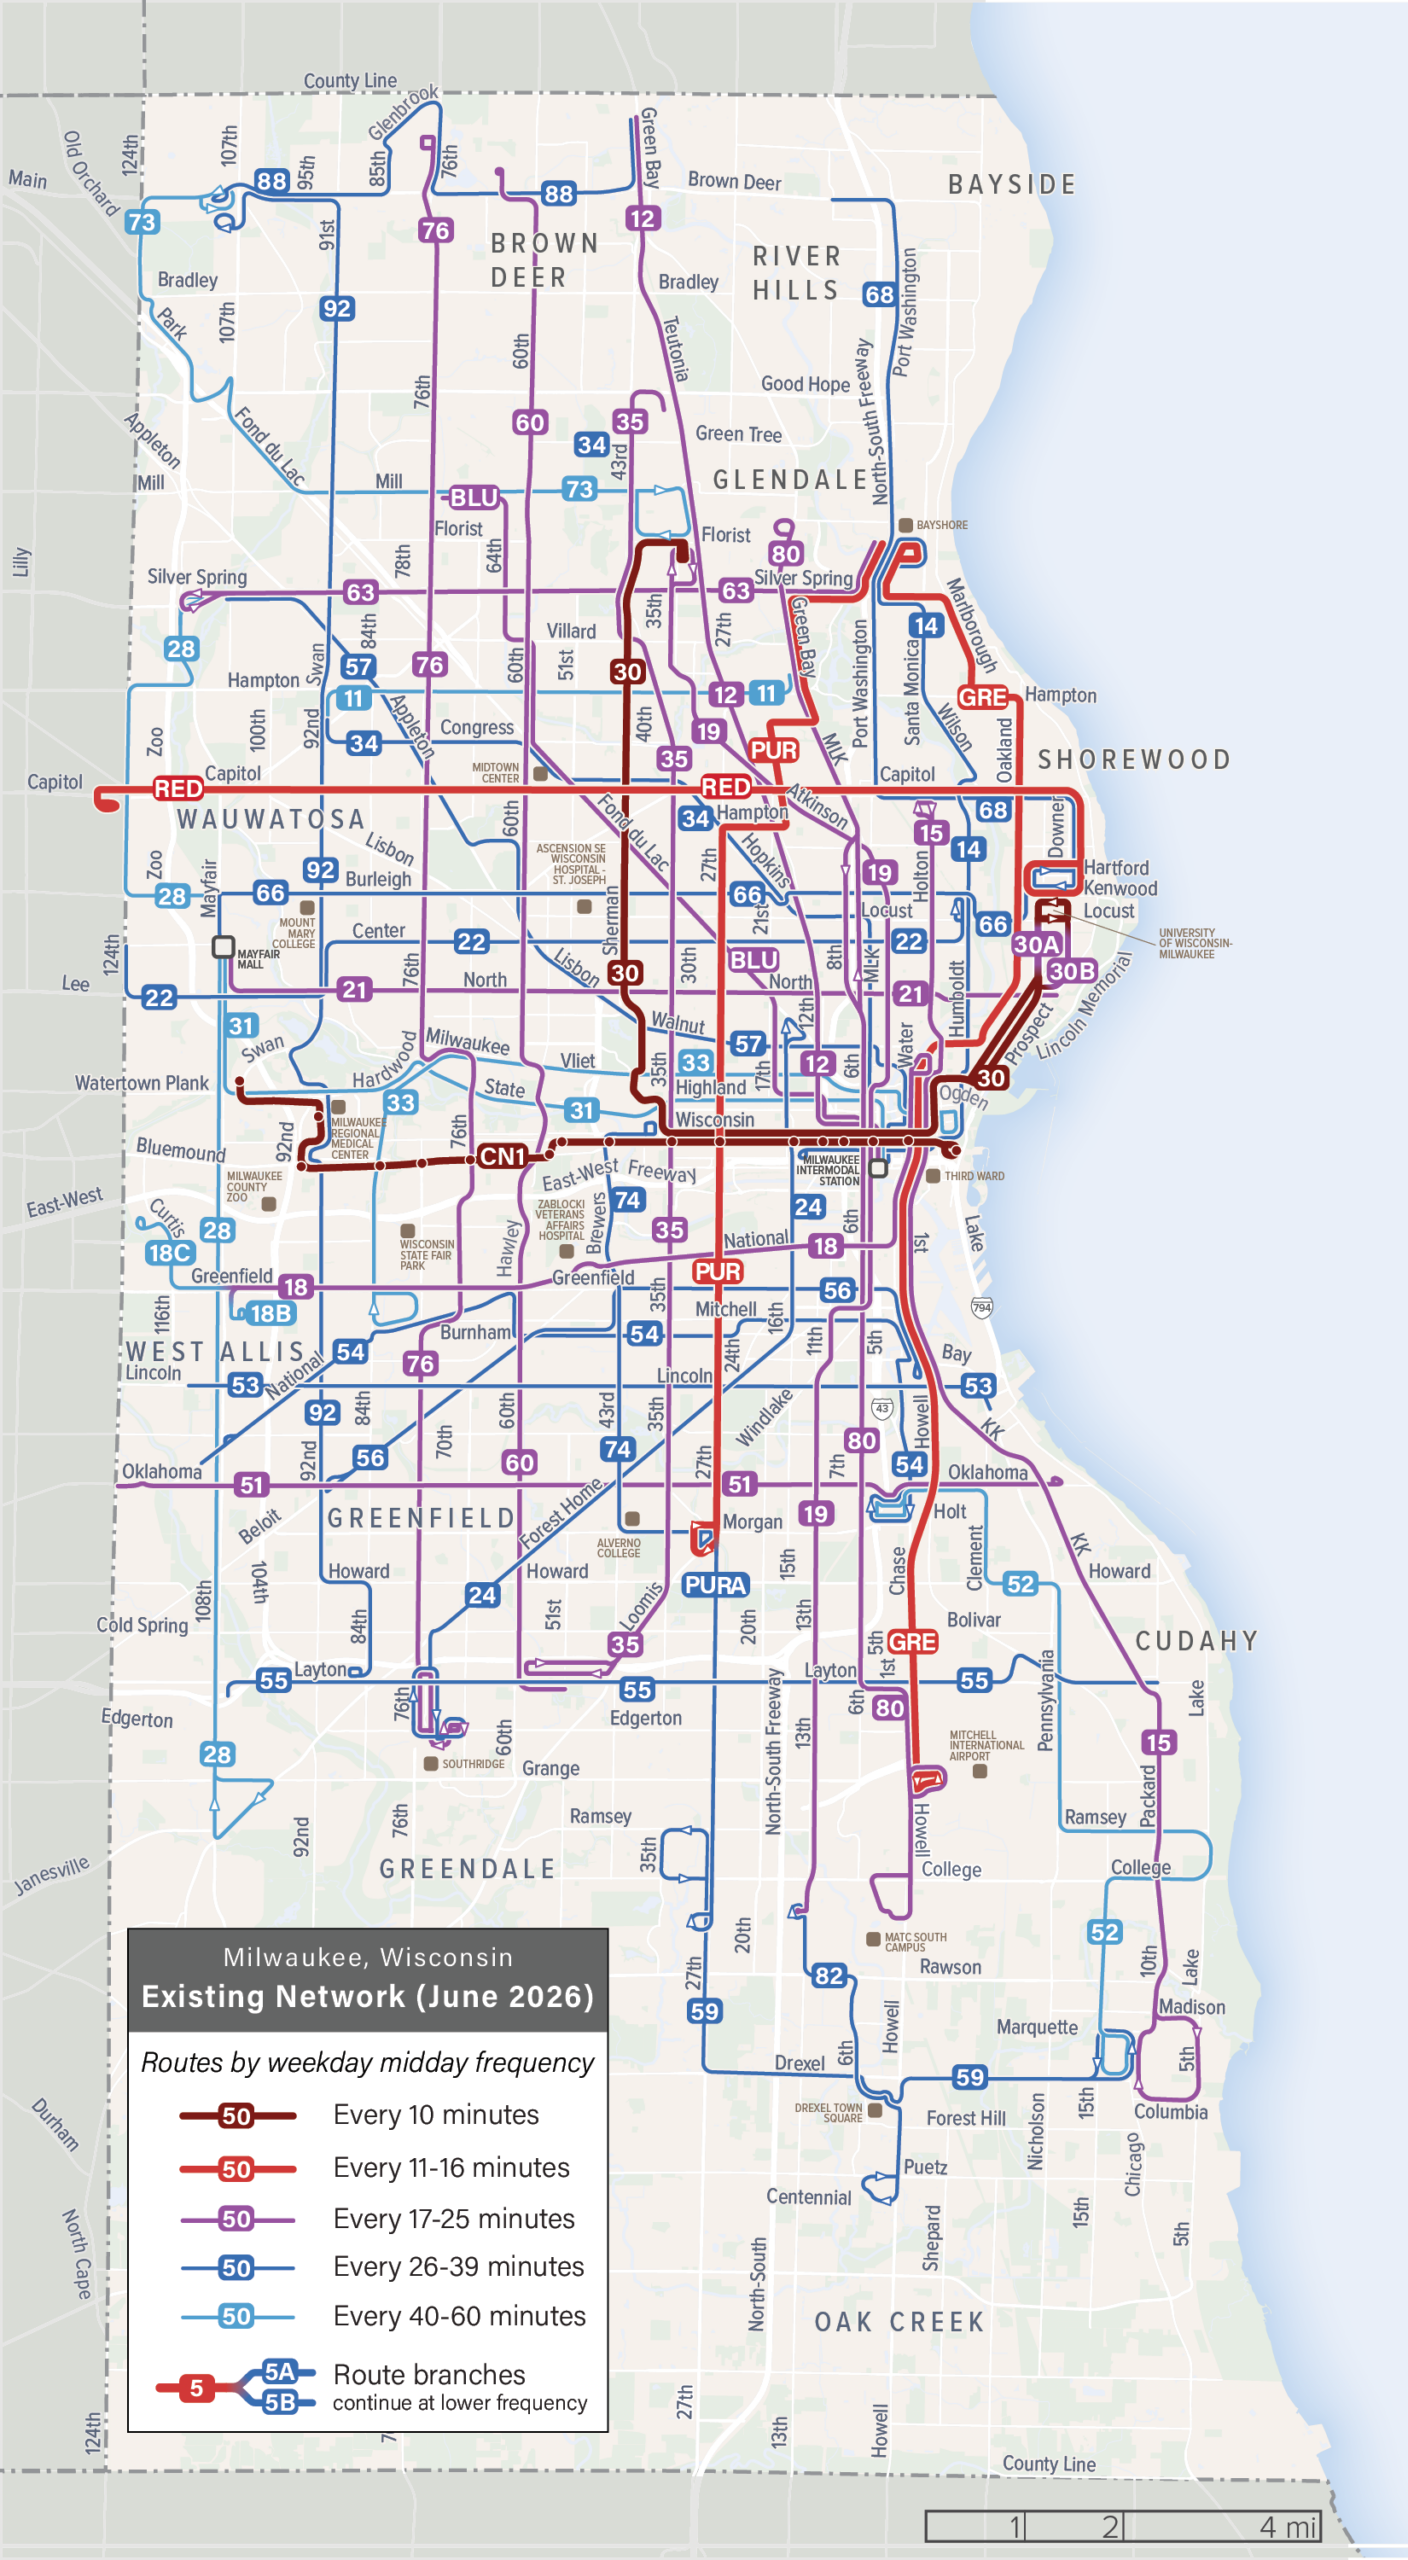
Here are the maps. First, the existing network. Pay close attention to the legend. Colors indicate frequency, and frequency matters enormously:
Now, here is the Ridership concept, which reduces coverage in order to sustain the crucial frequency of the highest ridership services, which tend to be in the older inner area.
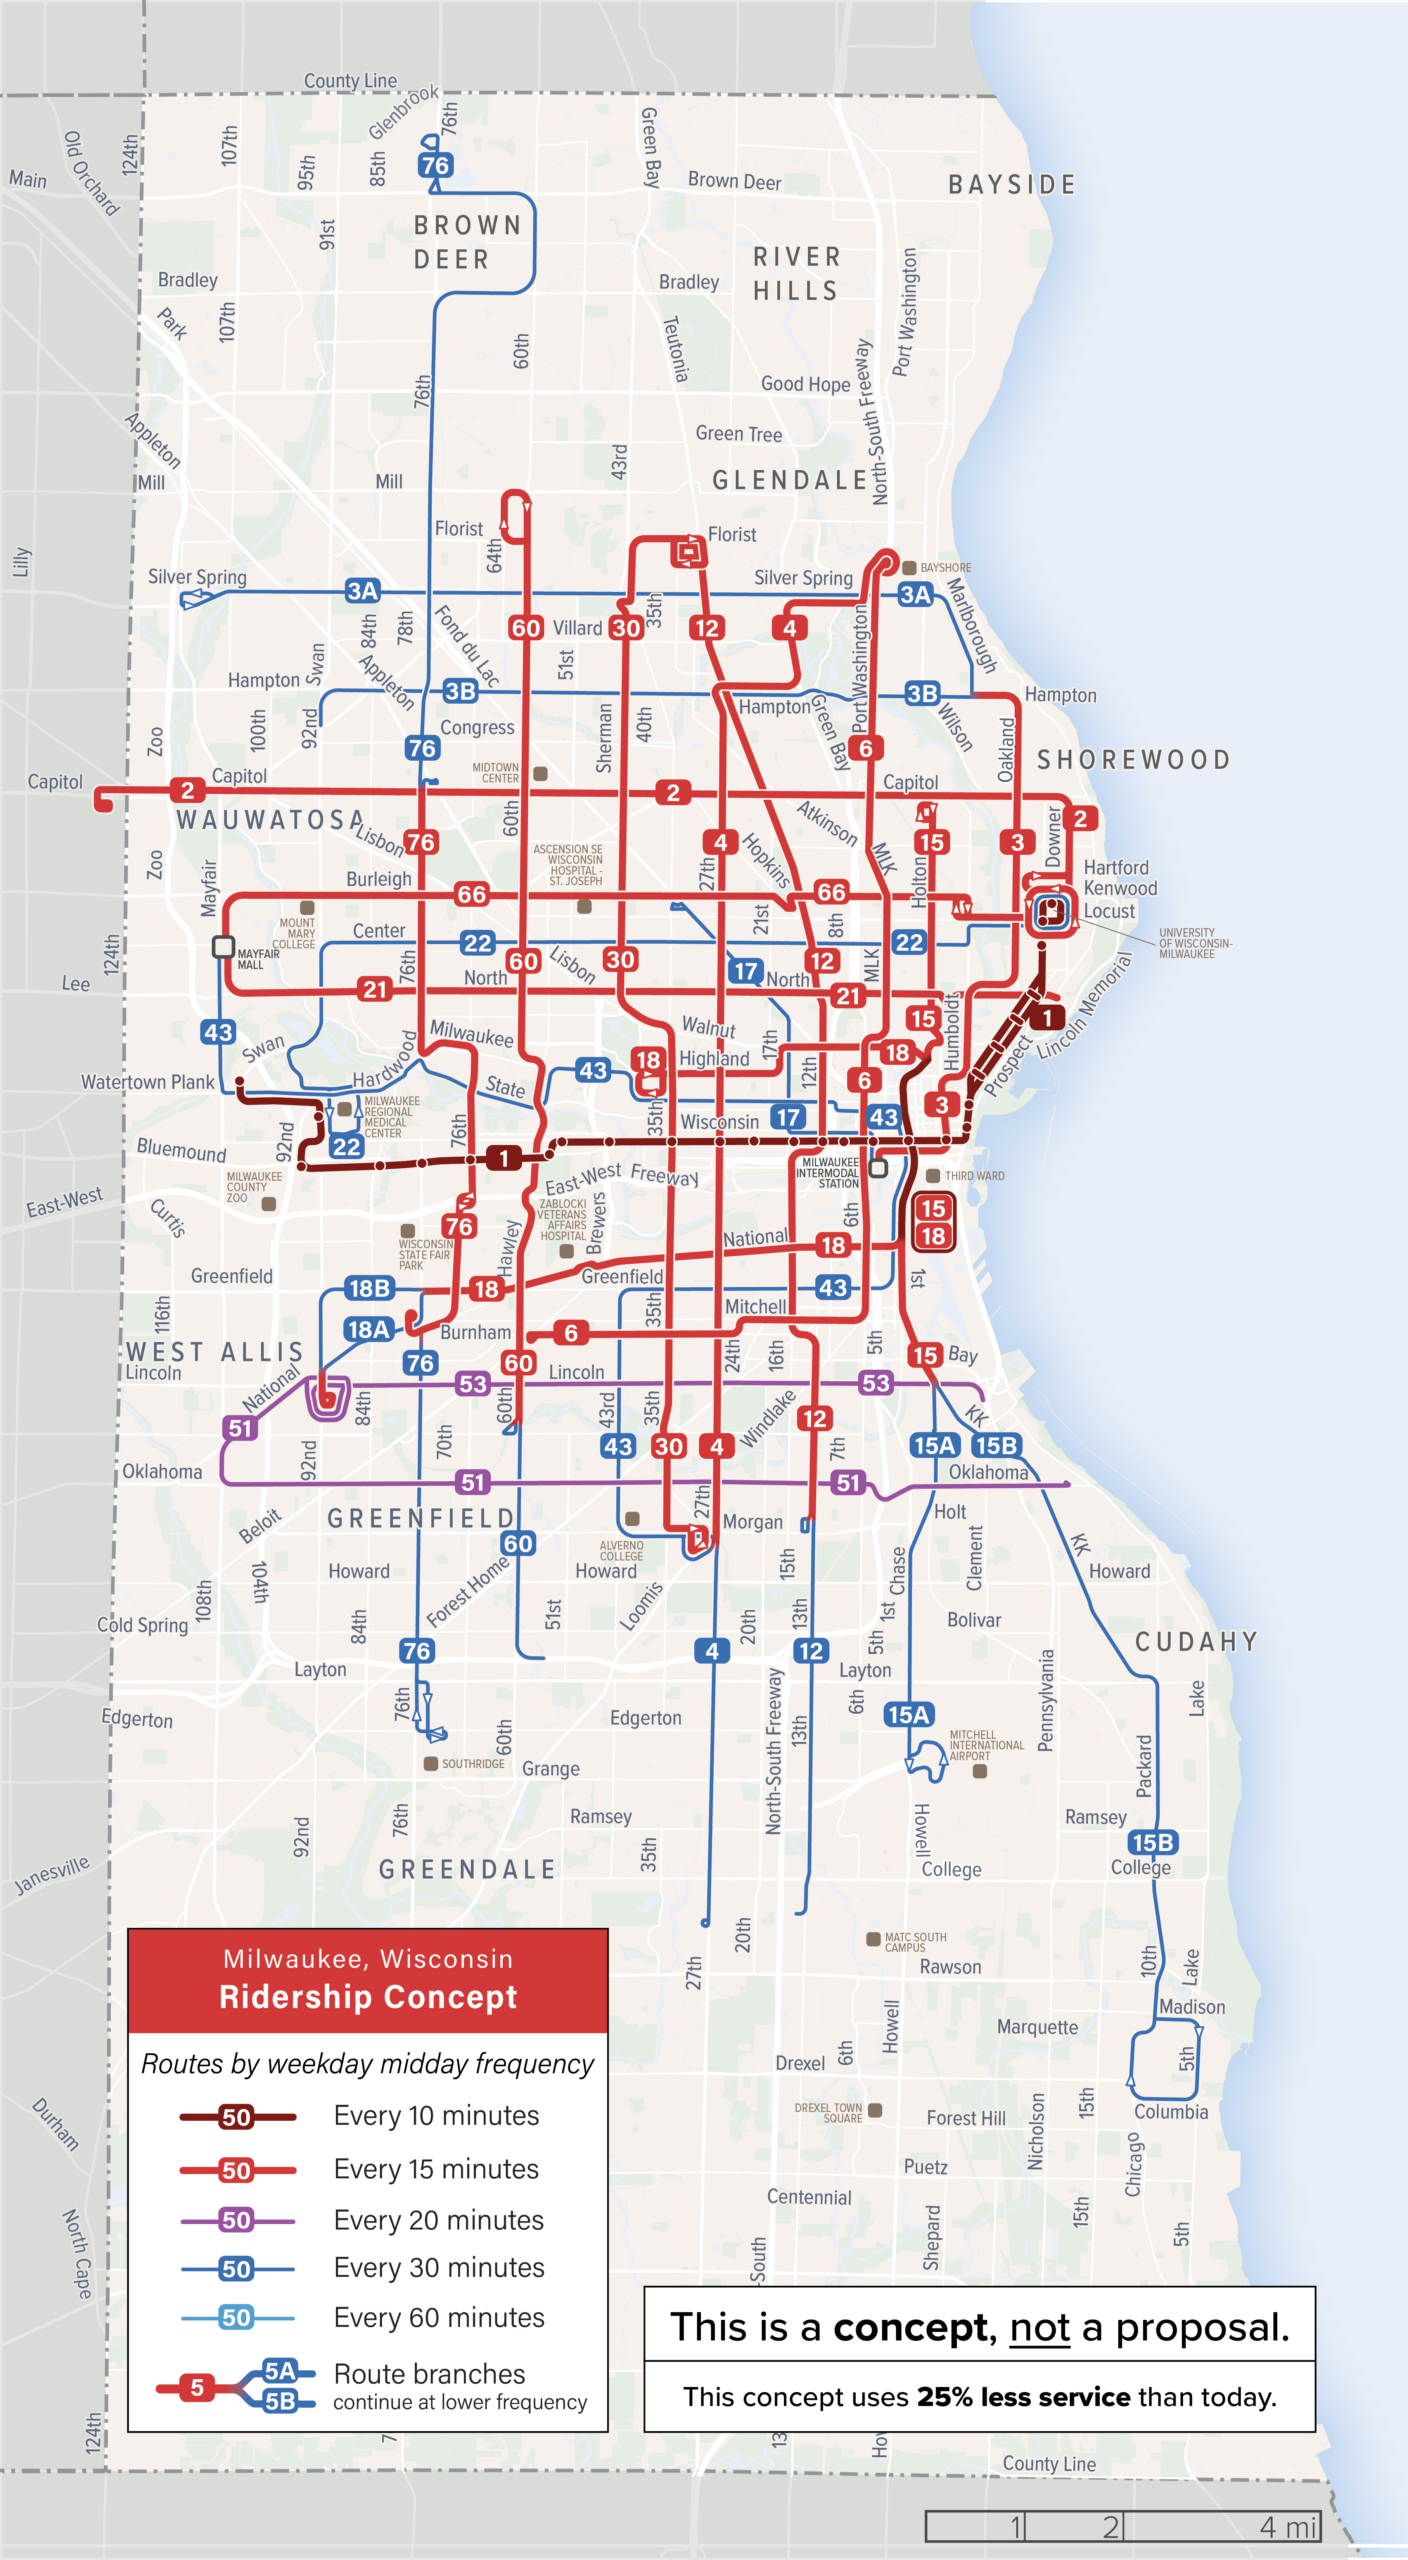
Note the focus on preserving and in some cases even restoring the high frequency grid. Many grid services were recently reduced from 15 minute frequency to 20 minutes, and the resulting loss of ridership was notable. The 15-minute frequency really is the point below which service becomes much less useful, and we always see the difference in ridership.
And here is the Coverage concept:
The two maps also have some ideas in common, such as:
- eliminating duplications like the two overlapping routes between downtown and the University.
- extending the BRT service (“CN1” in existing, Line 1 in our concepts) beyond the limits of the BRT infrastructure, to create an “open BRT” that is more useful to more people. For more on the principle at work here, see here.
Because they are both 25% services cuts, both maps will be shocking. But once you get over the shock, they are asking you an important question: What’s your definition of success for the transit system? We need to know that first before we design a draft plan. And even if there is finally a new funding source, the ridership-coverage trade-off will still matter. So again, if you know anyone in Milwaukee, send them here. If you want to go deeper, here is our full report.
I appreciate that you’ve been given a kind of impossible task here but as someone who’s been involved in transit organizing in Milwaukee and spent years completely reliant on transit, I notice a few issues with all of these proposals:
– I get the desire to make the most out of the BRT infrastructure, but traditionally the CN1 and the 10 that preceded it have had lower ridership that the 30 and a handful of north side routes. It seems like a waste of service hours to provide 10 min frequency west of 35th St. Extending the BRT service to UWM is a great idea that has been proposed many times.
– The current Green Line (Oakland Ave./Brady St.) and 30 provide serve different markets in one of the densest, most transit supportive areas in the Midwest. People move to this area to use transit. Keeping service on both streets is important.
– The route numbers in Milwaukee have a history and should be kept where possible. If you’re re-numbering, using the street number (eg 27 on 27th) would be useful.
– One unique aspect of MCTS is the amount of really good night service it provides. Some routes extend to well after 2:30am and are used by post bar crowds. The report suggests eliminating all of this. It seems like maintaining a skeleton network of night service would be worth a daytime frequency reduction.