In June 2018, Richmond, Virginia and its transit agency, GRTC, launched a new BRT line and a redesigned bus network that we helped design. That new network was intended to help increase ridership, and it did. From June 2018 through February 2020, ridership increased every month, a huge positive growth, topping out at 29% increase in ridership from February 2020 versus February 2018. The pandemic has reduced ridership but much of the ridership decline is concentrated in commuter express routes.
During and after the redesign process, the adjacent suburban counties participated in a longer-term planning process to consider expansion and improvement in each jurisdiction and those conversations coalesced into a ripe political moment to find dedicated funding for GRTC. In early 2020, the Virginia General Assembly created a new regional entity, the Central Virginia Transportation Authority, with dedicated revenues from sales and gas taxes, and 15% of their funding will go to GRTC.
Much of the new money goes to other things, including reducing the contributions that local governments already make. In the end, the measure funds about a 20% increase in bus service. Many local transit advocates argued for a higher percentage of the regional funding to go to GRTC, but the resulting legislation was a compromise between many differing regional interests. Initially expectations were high for how much this new funding could expand service across the region, but given how many different things the new funding is trying to do, it’s ultimately not a really big expansion of service.
As a result, the hard choices arising from transit’s basic geometry still need to be thought about, particularly the ridership-coverage trade-off. How should the region prioritize its new investment? Should it expanding routes as far as possible across the region, even if that means lower frequency service that we know few people will find useful? Or should it invest in more frequent services that will help more people get somewhere soon and connect most people to a lot more jobs and opportunities?
Those are the basic questions before the public, stakeholders, and leaders of the region in the Regional Transit Plan Concepts that we’ve helped to design for GRTC.
The Coverage Concept spends the new dollars on spreading service farther to more places, but does so mostly with service running just once an hour. While it would extend service to 50,000 more people, those long wait times mean that the jobs reachable in 45 minutes for the average person would go up by only 4%.
| Residents close to service | Jobs reachable in 45 min | |
| Coverage Concept | +50,000 | +4% |
| Ridership Concept | +15,000 | +16% |
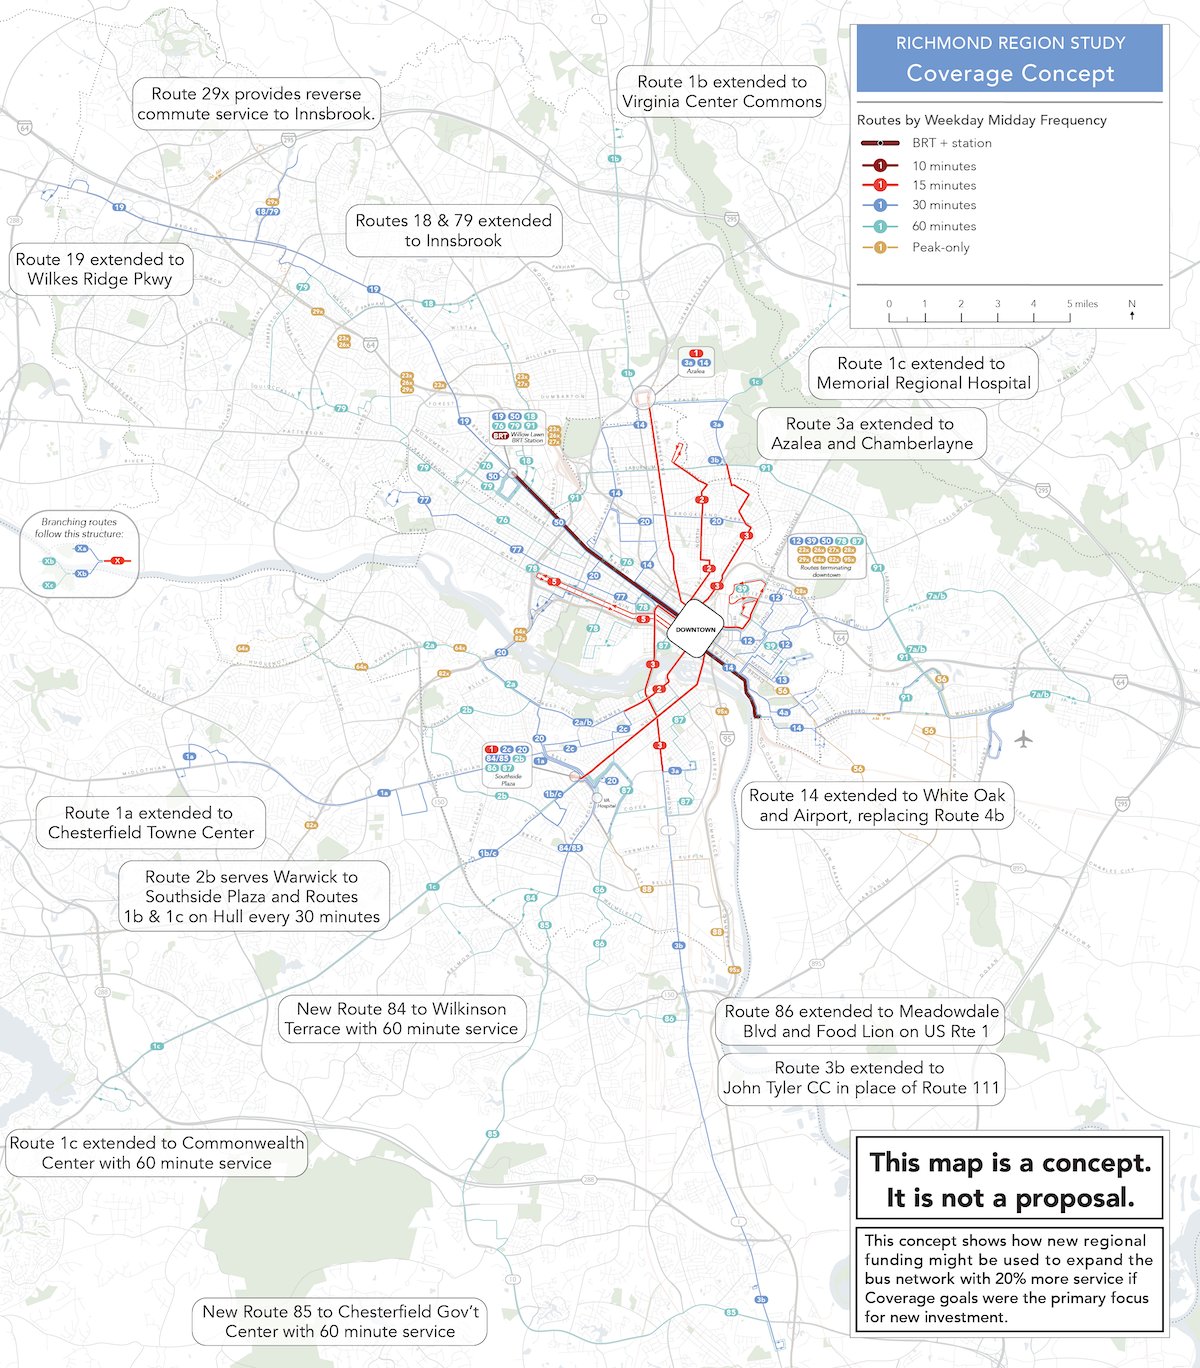
This concept shows how new regional funding might be used to expand the bus network with 20% more service if Coverage goals were the primary focus for new investment.
The Ridership Concept concentrates investment in services running every 10, 15, or 30 minutes in the most dense and busy places in the core of the region. It expands access to jobs by 16% for the average resident, but only extends service to an additional 15,000 residents.
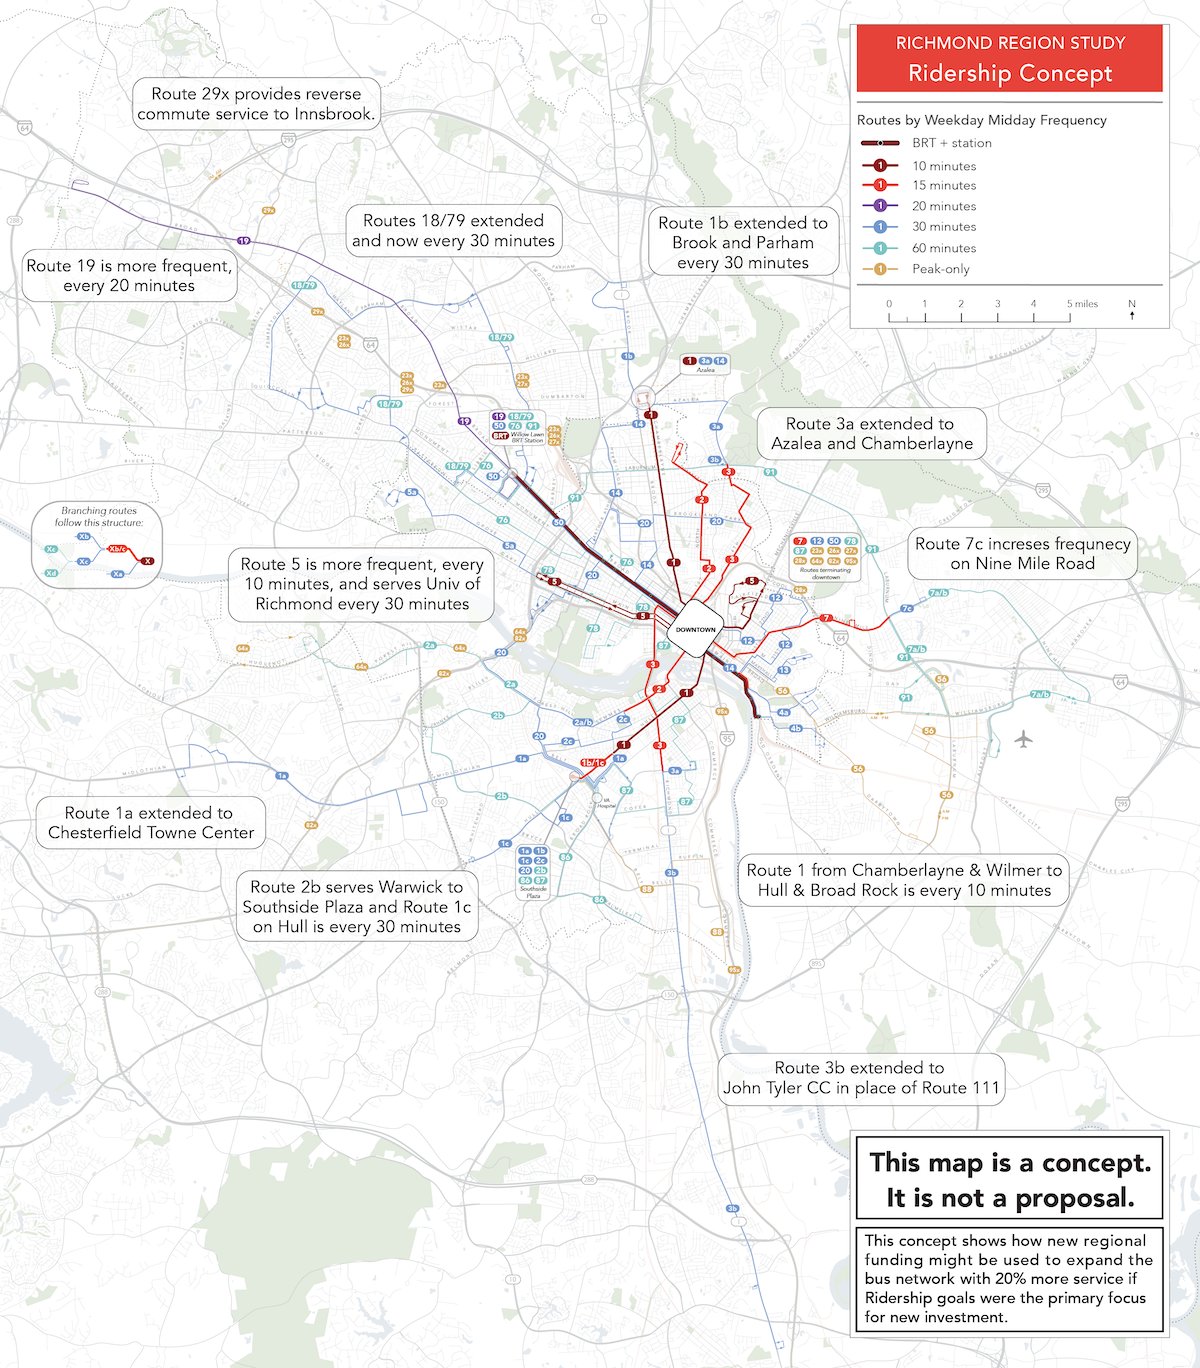
This concept shows how new regional funding might be used to expand the bus network with 20% more service if Ridership goals were the primary focus for new investment.
So regional leaders face the eternally difficult trade-off of how to invest limited dollars in transit. If you live in the Richmond area, weigh in with the online survey so GRTC and your regional leaders can know how you want your transit system to expand. If you know someone in the Richmond region, send them the link to the project website and this post. These concepts are here to help people decide what values they want transit to prioritize. We can help the community understand the options and the outcome, but it’s ultimately their decision.
As a regular reader who finds this blog useful and interesting but never left Europe I have 2 and a half both suggestions and questions:
1. Wouldn’t it be good if you placed the two maps side by side because most screens have more width than height?
2. Wouldn’t it be good if there was a short summary of how both concepts suggests the same?
3. But – maybe if you decide to have a concept of, say, 61% coverage and 39% ridership, a different route would be established or extended – and both “extreme” concepts would look more similar than the third one??
As a professional land use planner, I always have trouble convincing people that a ‘concept’ is not a hard proposal. These kind of conceptual maps can be useful, but I often find folks get bogged down in details and ‘what does this do for me’. The key questions being asked are sometimes lost or missed.
This is why we always want to go to the public with more than one concept!
Do I understand that the chart column represent the increase in Residents close to service and the increase in Jobs reachable in 45 min? I’d like to know the total number of people who can now reach jobs in 45 min for each plan, ie, how many people the 4% and 16% change equates to. That seems like a different but useful metric to assess the plans.
While I realise access to jobs is important, do you also measure access to other things?
Good question. Post on that coming soon.