Today, the National Transport Authority of Ireland launched the planning process that will lead to a redesign of the bus network in Dublin. We are incredibly honored and excited to be their lead consultant on this effort. I explain the planning issues (for a Dublin audience) here.
Our project is part of BusConnects, which is a three-pronged effort to improve Dublin’s buses:
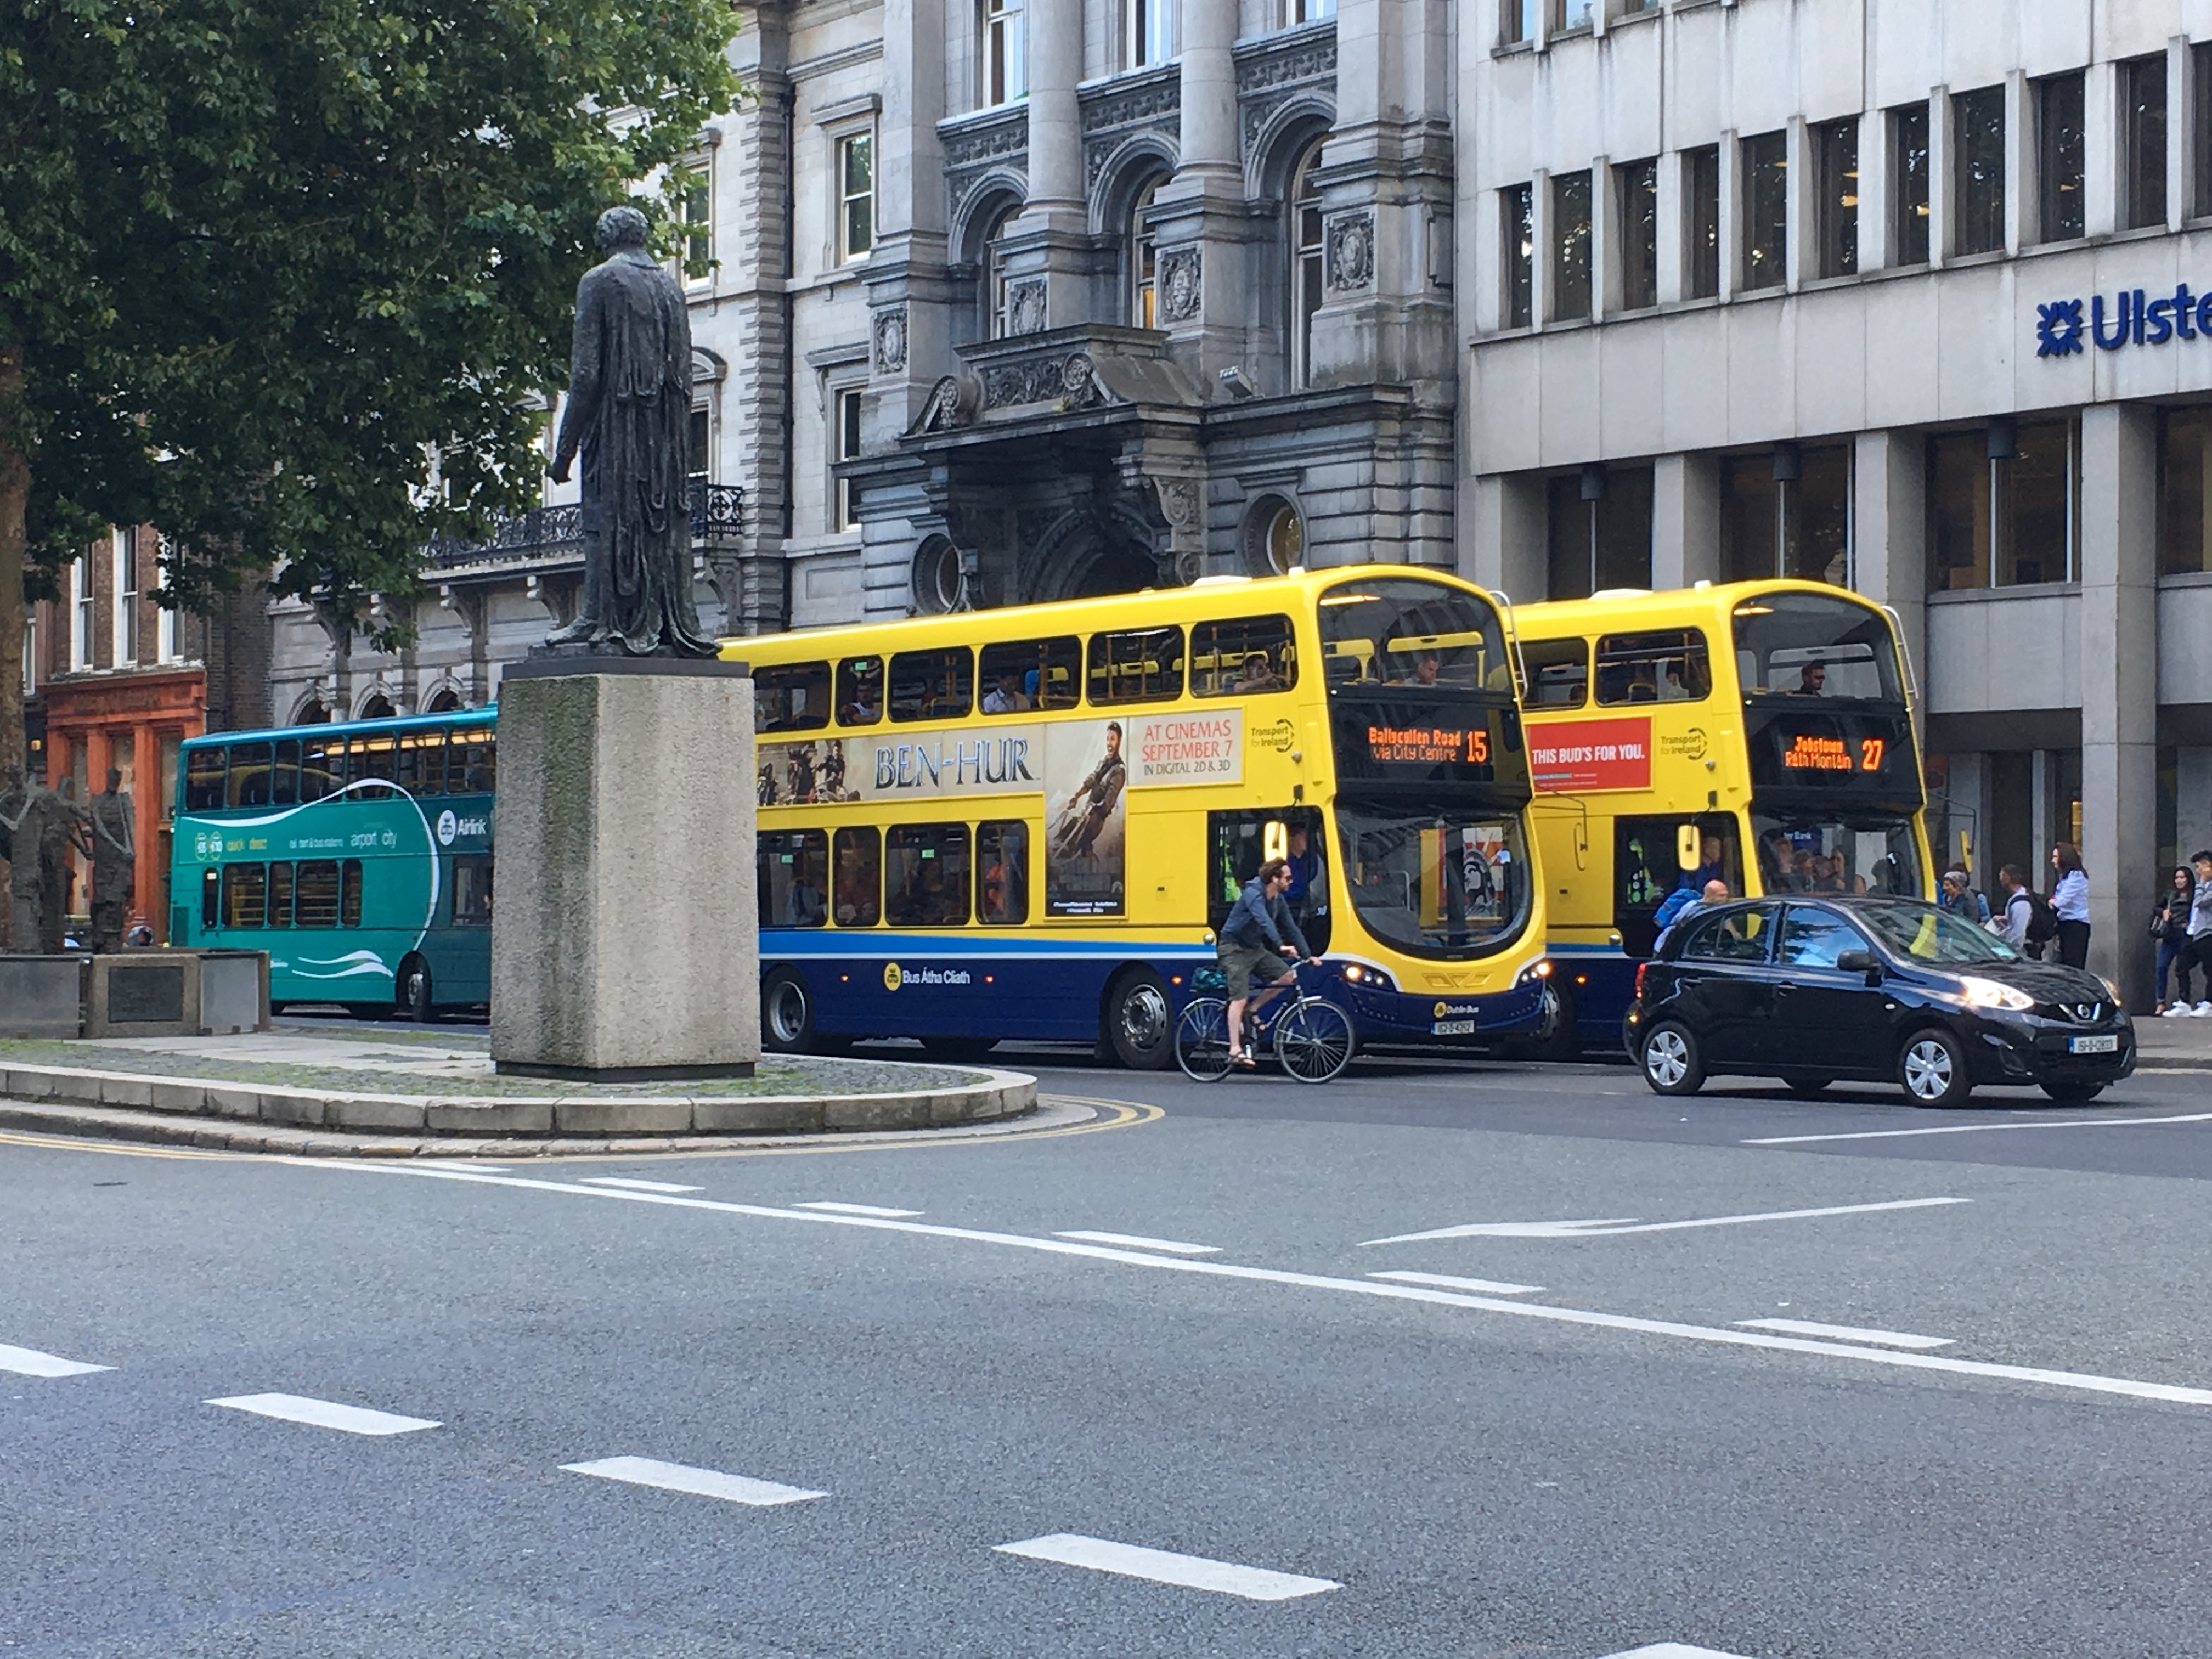
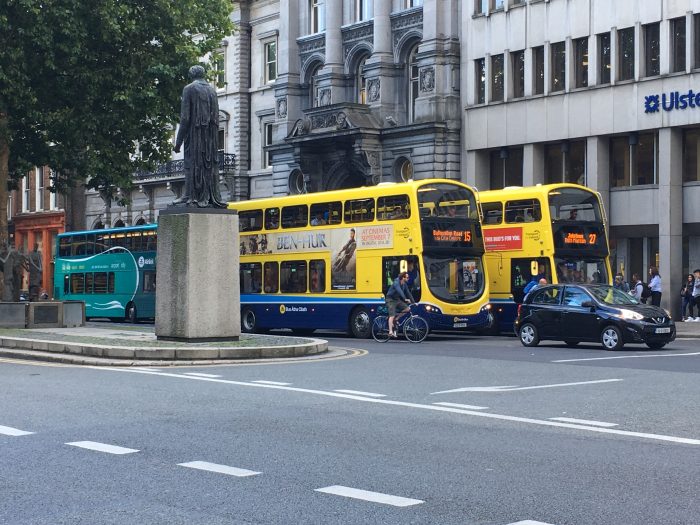
Dublin has less rail transit than most European cities of its size. There is no subway, two surface light rail lines, and one corridor along the coast where commuter rail runs every 15 minutes. So most of the city is on buses, and the buses must succeed for the city to succeed.
The bus service is abundant; almost 1000 buses are on the streets during the peak period, in an urban area of 1.2 million. But as is the case in almost all growing cities, the service may need revision to reflect some emerging needs. These include:
First, all frequent lines run into the City Centre, so trips between suburbs out can be difficult. Orbital routes exist but they are not frequent enough for the connections on which most orbital travel relies. This becomes a bigger issue as suburban employment centers – some of them well suited to public transport – emerge.
Second, the system is very complex. We drew what may be the first really clear map (link coming soon) of the entire network, but we put a grey box over the City Centre, where a clear map may be literally impossible. Here is the best version available. You see the problem.
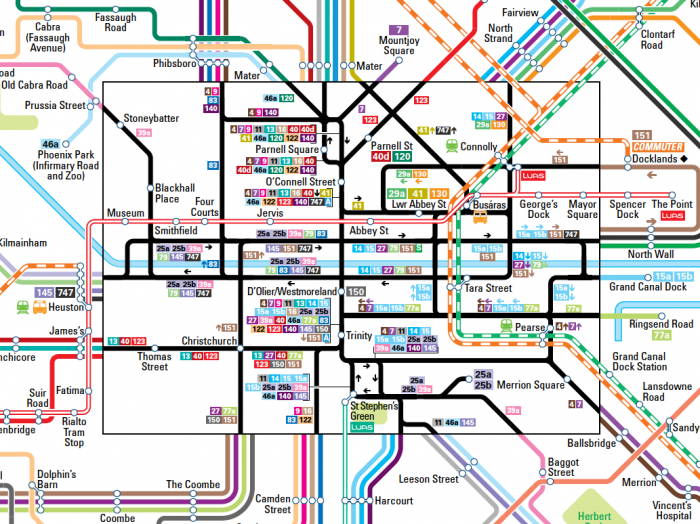
As a result, we think Dublin may be missing opportunities to encourage patronage within the greater City Centre – especially for spontaneous trips and tourism — because while buses are everywhere, it is simply too hard to figure out how to use them. As consultants we can attest to this, because our work requires learning bus systems very quickly.
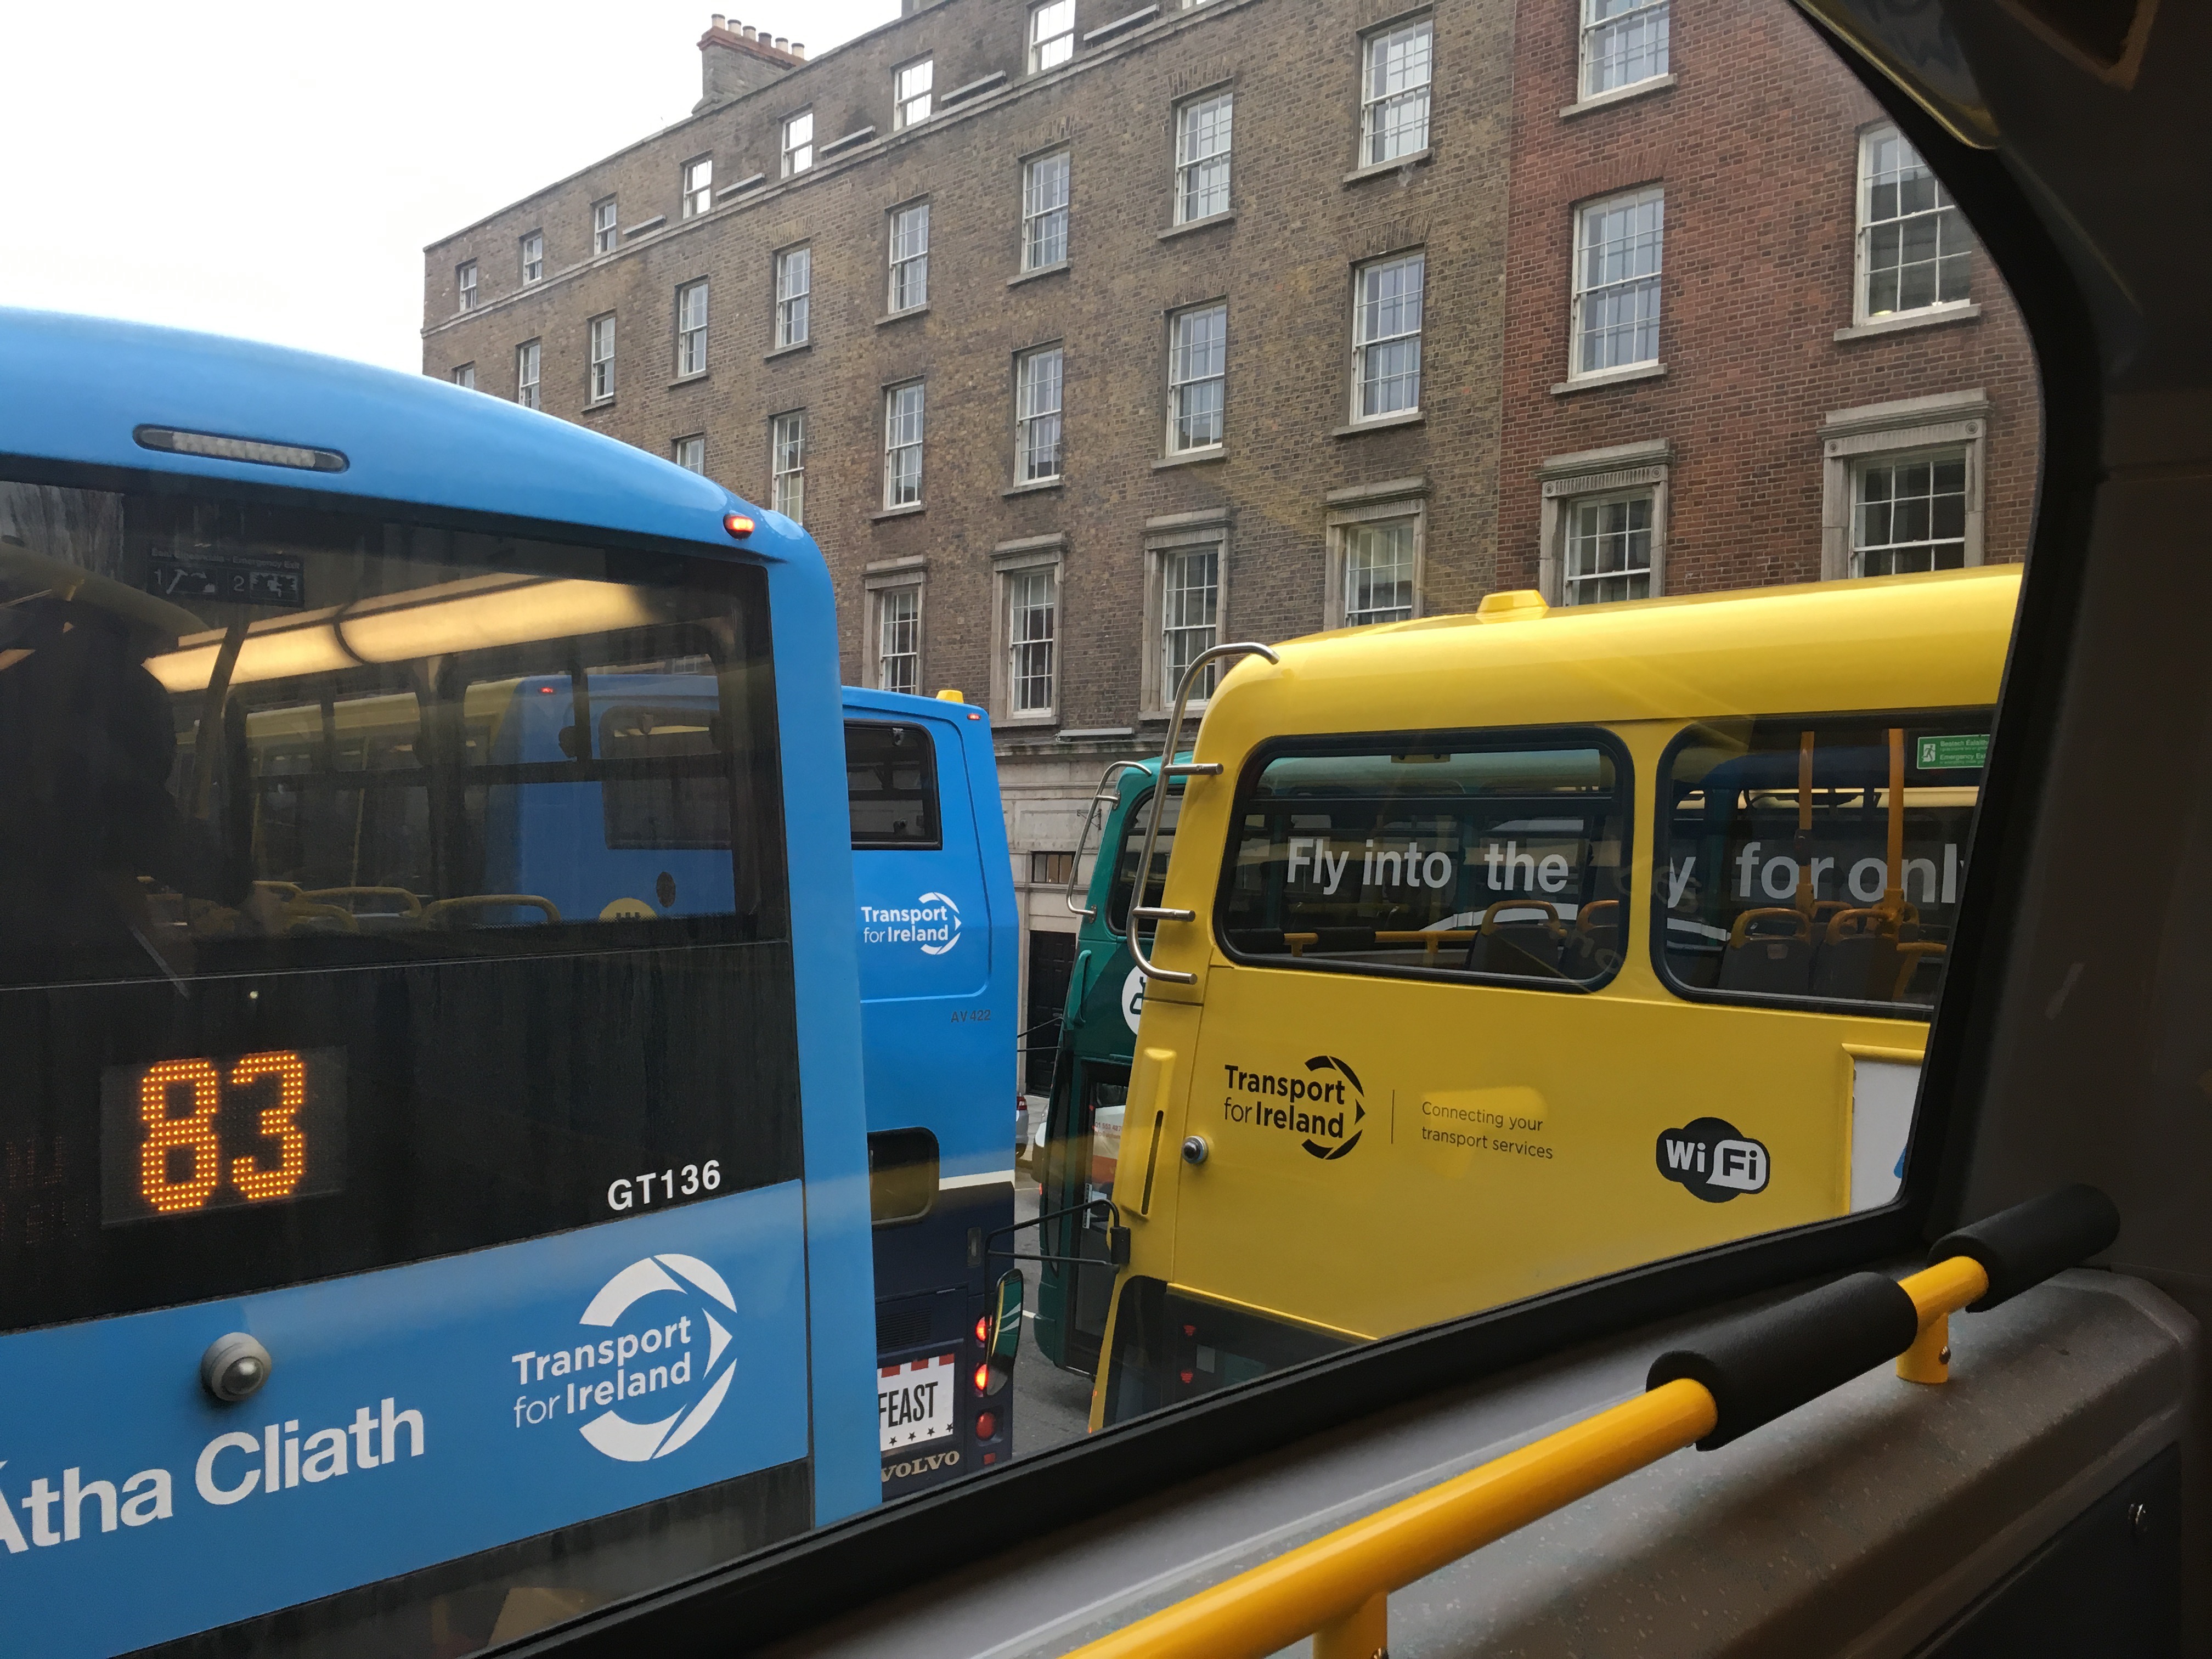
Finally, the City Centre has so many buses running through it that buses are frequently obstructing each other.

This problem has many solutions, including bus priority and ticketing improvements that parallel tracks are addressing. But we might be able to reduce these numbers a bit, especially with better orbital service that reduces the need to go through the city if you are not going there.
But as it turns out, the key to all of these problems is one question: Can we ask people to change buses if this means they can reach their destinations sooner, and reach other destinations citywide more quickly? (I explained that math here.) This is a hard question, because whatever we do to make it easier, changing buses is still an inconvenience.
So we’re asking the public what they think. For the next month, we’ll be accepting input through a web survey, which you can find here, along with our Choices Report that you can download. There, we share some specific possibilities, and ask the people of Dublin about their priorities. As usual we ask: Given how the math works, and the choices it presents, what should we do?