Amid all the gloomy headlines about transit funding crises, some transit agencies are reporting great news. Our firm has been behind many bus network redesigns that are bringing more people onto public transit, especially in the US. These plans have not just dramatically increased ridership. They’ve even increased the productivity (ridership divided by service provided, or roughly, “bang for buck”). That means more people using each bus, and more people benefiting from expanded access to opportunity. Here are three of our most recent examples. This table compares the average for the 12 months ending June 2025 to the average for the 12 months ending Dec. 2022.
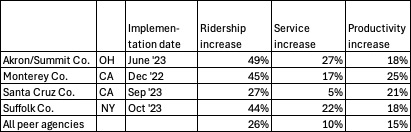
The last row shows how productivity grew nationwide in similar sized systems (all US agencies serving populations of 250,000 to 1.5 million). So clearly, some of the ridership growth might have happened anyway. But our redesigns all came in above that trendline, growing productivity more than the national average for peer systems.
This series of posts will provide deep-dives into some of these recent redesigns. In each case, I don’t want to just brag about our firm’s achievements. I want you to see why these were ridership-increasing projects, and why they contain insights that other agencies can use, especially if they are trying to achieve more with less.
For a long time, I’ve resisted providing high level summaries of ridership changes resulting from our work, for a few reasons:
- Ridership is not the only goal of most transit agencies. The competing goal of coverage is important to almost all transit agency boards in the US, so we have never unequivocally pursued ridership as the only goal. We encourage agencies to give us clear direction about what percentage of their service they want to devote to a ridership goal, but that’s never 100%.
- Ridership is affected by the network design but also by many other things: fares, service quality, the economy, pandemics, etc. In many projects we’ve done, other things happened at the same time that make it hard to sort out which thing caused what ridership change. For example, Alexandria, Virginia started free fares on the same day they started the new network. Our San Jose, California redesign was implemented a month before the pandemic, so we only got one (promising) month of data.
- We are most sure of the impact of a network redesign right after it’s implemented, before too many other things have happened, but we never see the full benefit then. It takes time for people to discover a new network and change their routines. Benefits that arise from better serving existing travel patterns mostly show up within a year, but there are two other benefits of network design that take years to appear: (1). People relocate in response to better service, and (2) actual development may occur in response to the redesign, especially because of policies that permit more density around service of a certain frequency. Those longer-term benefits are even harder to attribute to the network design as opposed to other things, because after more time, more other things have happened that also affect ridership.
So attributing the causes of ridership is always messy. We like to talk instead about expanding access to opportunity, because that explains why a network redesign improves ridership in most cases. So in the series of posts to come, we won’t just brag about our ridership numbers; we’ll look at exactly what each redesign did to produce that outcome, and what difficult tradeoffs were required.
Links to the individual articles are below. This post will be updated as we get more data.
- Akron / Summit County, Ohio
- Monterey-Salinas / Monterey County, California
- Suffolk County (Long Island), New York
Conclusion: How do Network Designs Increase Ridership?
(Thanks to Alex Boccon-Gibod of JWA for the peer analysis.)
Comments are closed.