General

Why Does Ridership Rise or Fall? Lessons from Canada

by Christopher Yuen

With only a handful of exceptions, transit ridership has stagnated or been falling throughout the US in 2017.  The causes of this slump have been unclear but some theories suggest low fuel prices, a growing economy fueling increased car ownership, and the increasing prevalence of ride-hailing services are the cause.

A few North American agencies have bucked the trend, including Seattle, Phoenix, Houston, and Montreal.  By far the biggest growth was at Vancouver, BC’s Translink, which saw a ridership growth of 5.7 percent in 2017.

But notice the big picture:  In a year when urban transit ridership fell overall in the US, it rose in Canada.
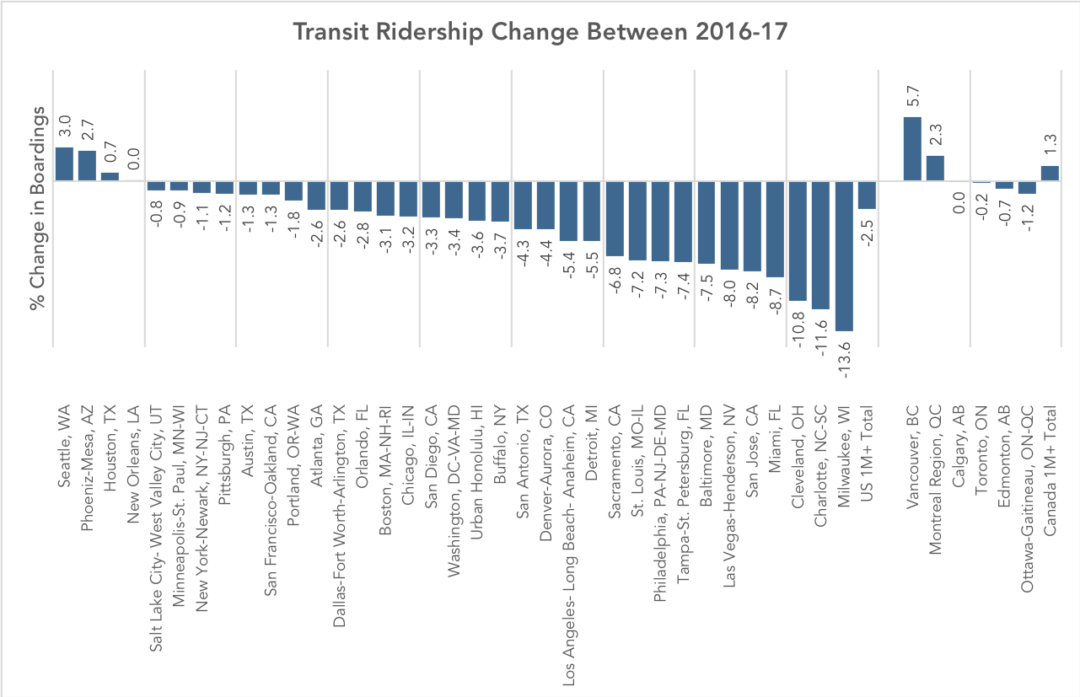
Transit ridership urban areas with populations of over 1M are included in this chart. Ridership of major agencies that serve the same region are added together. (Source: National Transit Database; APTA 2017 Q4 Ridership Report)

There are three interesting stories to note here.

1.  If You Run More Service, You Get More Riders

Canadian ridership among metro areas with populations beyond one million is up about 1.3% while regions of the same size in the US saw an overall ridership decrease of about 2.5% in 2017 despite the broad similarity of the countries and their urban forms.  Why?  Canadian cities just have more service per capita than the most comparable US cities.  This results in transit networks that remain more broadly useful in the face of competition from other modes.  Note, too, that Canadian transit isn’t cuter, sexier, or more “demand responsive” than transit in the US.  There is simply more of it, so more people ride, so transit is more deeply imbedded in the culture and politics.

2.  Vancouver Shows the Effect of Network Growth, Higher Gas Prices, Great Land Use Policy, and No Uber/Lyft

Vancouver’s transit ridership has historically been higher than many comparable regions as a result of decades of transit-friendly land-use and transportation policies, including an early regional goal to foster density only around the frequent network.  (The Winter Olympics also had a remarkable impact: ridership exploded in 2010, the year of the Olympic games, but then didn’t fall back after the games were over; apparently, many people’s temporary lifestyle changes became permanent.)  By North American standards, Vancouver is remarkable in the degree to which development is massed around transit stations.

But Translink attributes its 2017 ridership growth to continued increases in service, high fuel prices, and economic growth.  The 11km (7mi) Millennium-line Evergreen Extension just opened prior to 2017, directly adding over 24,000 boardings a day.  Fuel prices in Vancouver have also reached an all-time high, at $1.5 CAD / litre (4.4 USD/ gal), an anomaly in North America, although still lower than in Asia and Europe.  Economic growth has also been consistent, with the region adding 75000 jobs in years 2016 and 17.  Notably, ride-hailing services like Uber and Lyft are not available in Vancouver due to provincial legislation.

3.  There is Conflicting Evidence on the Impacts of Economic Growth on Ridership

Many commentators suggest economic growth to be a factor of the 2017 trends in transit ridership but there seems to be two conflicting theories, with economic growth cited as both a cause ridership growth and a cause of ridership decline. The positive link is obvious- economic growth leads to more overall travel, some of which will be made by transit.  Contrastingly, the negative link is based on the theory that increasing incomes allow for more people to afford cars.  Both theories seem plausible, but for both to be true, the relative strength of each must differ between cities.

Most likely, economic growth in transit-oriented cities is good for ridership, and growth in car-oriented cities, which encourages greater car dependence and car-oriented development, is bad.  This would explain the roaring success of Seattle, Vancouver, and Montreal, though it doesn’t explain why Houston and Phoenix are doing so well.

As North American cities work to reverse last year’s losses in ridership, they may best learn from Canada, and a select few American cities, to leverage economic growth for ridership growth.

Postscript by JW

For Americans, Canada is the world’s least foreign country.  There are plenty of differences, but much of Canada looks a lot like much of the US, in terms of economic types, city sizes and ages, development patterns, and so on.

So why is Canada so far ahead on transit?   All Americans should be asking this.  Ask: Which Canadian city is most like my city, and why are its outcomes so different?  We’ll have more on this soon.

Webinar: “To Predict with Confidence, Plan for Freedom”

On April 26, I’ll be doing a webinar on my recent Journal of Public Transportation paper, “To Predict with Confidence, Plan for Freedom.”  There’s some pretty transgressive stuff in this paper.  I hope you’ll join us; details on the webinar are here.

However, attending the webinar is not a substitute for reading the article.  It’s nine pages of friendly, non-technical prose.  If you read it, you’ll ask better questions in the webinar, which will help other people be smarter, including me.

In fact, I resisted doing the webinar a little bit, because like most philosophical arguments, mine isn’t improved by translation into PowerPoint, or by presentation as any kind of show.  On the contrary, you need to be able to sit with it, go back and forth, take it at your own speed, form your own thoughts.  This is what reading is for.  

Hope to see you, armed with your knowledge of the paper and your questions about it, at the webinar!

“To Predict with Confidence, Plan for Freedom”


The Journal of Public Transportation has a special issue out consisting of thinkpieces by a range of figures in the business.  I’m honored to be there alongside industry leaders like Susan Shaheen of UC Berkeley, Graham Currie of Australia’s Monash University, Kari Watkins of Georgia Tech and Brian Taylor of UCLA, as well as our favorite operations and scheduling consultant, Dan Boyle.

My contribution is called “To Predict with Confidence, Plan for Freedom.”  It basically outlines the argument of my next book, so this would be a great time to hear some critiques of it.  Here’s the opening:

What will urban transportation be like in 10-20 years? How will automated vehicles interact with social and cultural trends to define the city of tomorrow? Will the vehicles of the future be owned or shared? How will pricing evolve to motivate behavior? What will happen to public mass transit? What other innovations can we expect that will transform the landscape? This paper, which is merely the outline of a larger argument, suggests three interconnected answers.

  • We can’t possibly know. History has always been unpredictable, punctuated with shocks, but if the pace of change is accelerating, then unpredictability may be increasing too.
  • We can reach many strong conclusions without knowing. A surprising number of facts about transportation, including some fairly counterintuitive insights that would be transformative if widely understood, can be described and justified solidly with little or no empirical ground, because they are matters of geometry and physics or of nearly axiomatic principles of biology.
  • Prediction may not be what matters anyway. If we abandoned hope of predicting the future, we could still describe a compelling outcome of transportation investment, one that motivates many people who will never care about a ridership prediction or economic impact analysis. We could also predict it in the sense that we can predict the continued value of pi. That idea is freedom, as transportation expands or reduces it.

So if that catches your interest, read the whole thing, and share your comments below!

What If We Called it “Decongestion Pricing”?

Seattle’s KUOW picked up my argument on this today:

Transit consultant Jarrett Walker said the problem is with the name – “congestion pricing.” It’s like the term “death tax,” which was drummed up to discredit the inheritance tax.

Nobody likes death or taxes. Put the two words together and you get a thing politicians have trouble supporting.

Similarly, nobody likes congestion or paying the price for it.

“I’ve suggested the word ‘decongestion pricing,’ because that is what the price buys,” said Walker. “The price buys less congested streets, with more room for all people of all modes to get through. ”

An older, longer, more rambling discussion of this is here.


Excellent Principles for Shared Mobility

Robin Chase, the co-founder of Zipcar, is apparently the genius behind a set of Shared Mobility Principles that came out recently.  I can’t praise them too highly.  Like the founding statements of New Urbanism, these principles cut past the noise and confusion of marketing and show what it would be like to deploy new technologies with the goal of humane and civilized urban life, not just the goal of personal convenience or profit.

Even more important, it’s been signed by many of the main players in the tech transportation field, including Uber, Lyft, Via and many others.  That means you can quote these principles back to them when their actions conflict with these ideals.

As I watch how tech marketing is sowing confusion about public transit, and damaging local officials’ ability to think about it clearly, it’s a relief to see principles such as

1. WE PLAN OUR CITIES AND THEIR MOBILITY TOGETHER.

2. WE PRIORITIZE PEOPLE OVER VEHICLES.

3. WE SUPPORT THE SHARED AND EFFICIENT USE OF VEHICLES, LANES, CURBS, AND LAND.

From these principles alone you can derive the urgent need to invest more in high-capacity fixed route services covering most of our major cities, except the most low-density or inaccessible fringes.  And the results would be something very different from what I’m seeing every day: Tech campuses built in inaccessible cul-de-sacs, or facing away from the available fixed route service, on the fantasy that in the new world everyone will use little pods that go door-to-door.

Then, when you add:

5. WE PROMOTE EQUITY.

… we derive the urgent need for shared transportation to be efficient enough to scale.  Efficiency is equity.  An inefficient service will only be available to a few people, and with rare exceptions like ADA paratransit those people will be an elite.   So we can conclude that only a robust fixed route network, aimed at the “middle 80%” but not the elite, can scale to the point of being a tool for equitable liberty.

Anyway, even apart from how it relates to my own passions, this is good stuff. Read, and share, the whole thing.


Orlando and Space Coast: Speaking on April 3

I could have used a picture of an Elon Musk rocket at Cape Canaveral, but I’m more of a botany guy. Photo: Leonard J. DeFrancisci

In my first-ever trip to Central Florida, I’ll be speaking at the Florida Institute of Technology in Melbourne, Florida on the evening of April 3.  Please join me, but you need to register.  Do that here.

Basics: The Ridership – Coverage Tradeoff

Is your transit agency succeeding?  It depends on what it’s trying to do, and most transit agencies haven’t been given clear direction about what they should be trying to do.  Different people have different goals for transit, and those goals lead to different kinds of network.

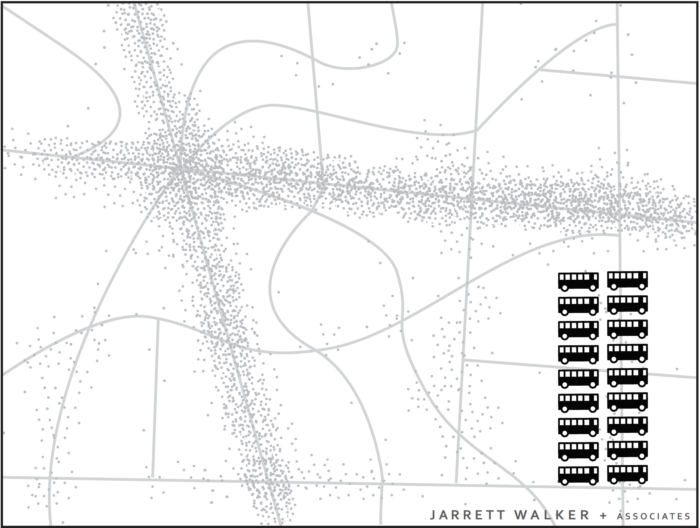
To see why, look at this little fictional town.  The little dots indicate dwellings, jobs, and other destinations. The lines indicate roads. Most of the housing and destinations in the town area concentrated around two main roads.

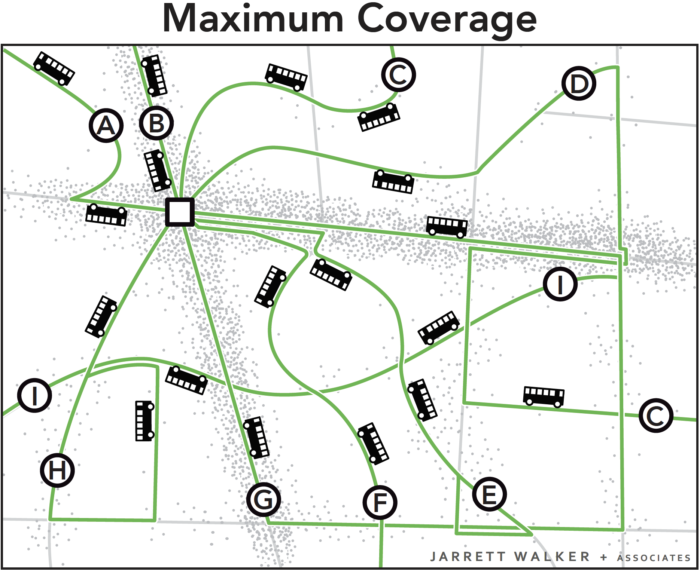
Imagine you are the transit planner for this fictional town. The dots scattered around the map are people and jobs. The 18 buses are the resources the town has to run transit. Before you can plan transit routes you must first decide: What is the purpose of your transit system?

Designing for Ridership

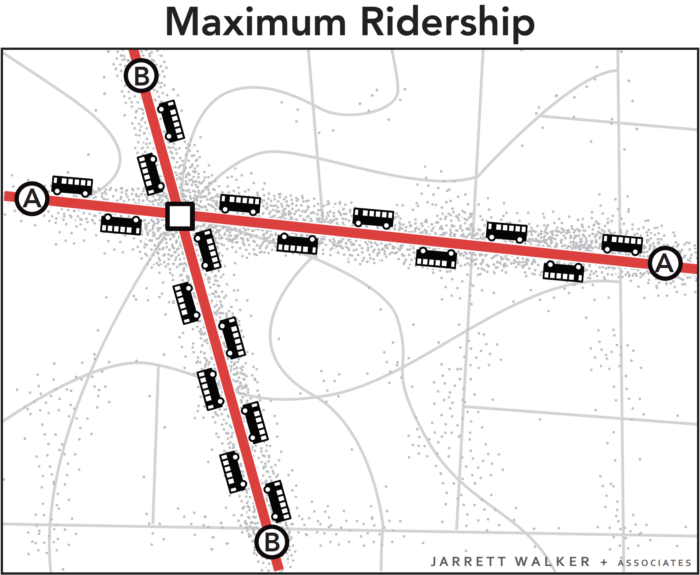
A transit agency pursuing only a ridership goal would focus service on the streets where there are large numbers of people, where walking to transit stops is easy, and where the straight routes feel direct and fast to customers. Because service is concentrated into fewer routes, frequency is high and a bus is always coming soon.

This would result in a network like the one below.

All 18 buses are focused on the busiest areas. Waits for service are short but walks to service are longer for people in less populated areas. Frequency and ridership are high, but some places have no service.

Why is this the way to maximize ridership?  Frequency tends to have huge payoffs.  Most people find a bus coming every 15 minutes to be more than twice as useful as a bus coming every 30 minutes.  Frequency also makes it easier to change between buses, which expands the range of destinations people can reach.  So when we concentrate frequency where the most people will benefit from it, we tend to get the best ridership results.  If you want to read more about this, see here.

Designing for Coverage

A network designed only for ridership would not go to many parts of the city at all.  If you think a transit agency owes some service to everyone in the community, you want a network designed for coverage.  To achieve this goal, the transit agency would spread out services so that there would be a bus stop near everyone. Spreading it out sounds great, but it also means spreading it thin.  The resources would be divided among so many routes that it wouldn’t be possible to offer much service on any of them.  As a result, all routes would be infrequent, even those on the main roads.  Infrequent service probably isn’t coming when you need it, so it isn’t very useful, so not many people would ride.

The 18 buses are spread around so that there is a route on every street. Everyone lives near a stop, but every route is infrequent, so waits for service are long. Only a few people can bear to wait so long, so ridership is low.

(By the way, in the coverage network I could have used on-demand or “microtransit” vans instead of buses on fixed lines.  This is another tool for providing low-ridership coverage service.)

In these two scenarios, the town is using the same number of buses. These two networks cost the same amount to operate, but they deliver very different outcomes.

Both Goals are Important

Ridership-oriented networks serve several popular goals for transit, including:

  • Reducing environmental impact through lower Vehicle Miles Travelled.
  • Achieving low public subsidy per rider, through serving the more riders with the same resources, and through fares collected from more passengers.
  • Allowing continued urban development, even at higher densities, without being constrained by traffic congestion.
  • Reducing the cost of for cities to build and maintain road and bridges by replacing automobile trips with transit trips, and by enabling car-free living for some people living near dense, walkable transit corridors

Coverage-oriented networks serve a different set of goals, including:

  • Ensuring that everyone has access to some transit service, no matter where they live.
  • Providing lifeline access to critical services for those who cannot drive.
  • Providing access for people with severe needs.
  • Providing a sense of political equity, by providing service to every municipality or electoral district.

Ridership and coverage goals are both important to many people, but they lead us in opposite directions. Within a fixed budget, if a transit agency wants to do more of one, it must do less of the other.

Because of that, cities and transit agencies that lack adequate resources need to make a clear choice regarding the Ridership-Coverage tradeoff.   In fact, we encourage cities to develop consensus on a Service Allocation Policy, which takes the form of a percentage split of resources between the different goals.  For example, an agency might decide to allocate 60 percent of its service towards the Ridership Goal and 40 percent towards the Coverage Goal.  Our firm has helped many transit agencies think through this question.  Here is an explanation of how this conversation played out in a typical US transit agency.

What about your city?  How do you think your city should balance the goals of ridership and coverage?   There is no technical answer.  Your answer will depend on your values.

Further Reading

Jarrett Walker’s Journal of Transport Geography Paper, which first introduced this concept, is here.