According to Newsroom NZ’s Simon Louisson, I am “the US Consultant behind the Wellington bus nightmare.” Wellington, New Zealand is having some problems with recent bus service changes. I have had no role in Wellington for the last six years, and did not even know the service changes were happening until I read about them in the media, but I, being a foreigner, must be to blame!
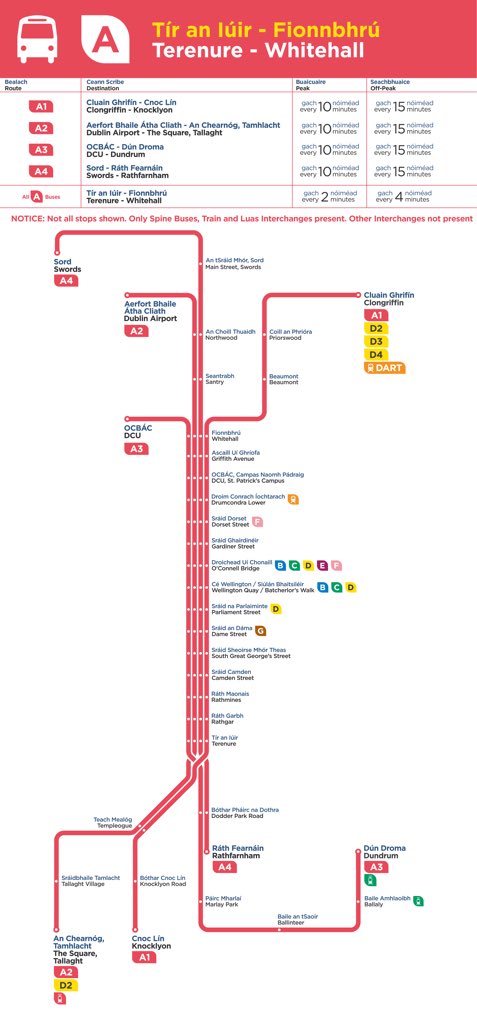
Jarrett Walker, the US consultant that has united Wellingtonians in their loathing for the chaotic new bus network, has also redesigned Dublin’s network and has met an even more rigorous negative response.
The entire article is false and defamatory, so if you read it, please also read this.
Through my employer at the time, the Australian firm MRCagney, I did a project for the Greater Wellington Regional Council on the design of the bus network in Wellington (the city only). This work was mostly in 2011, ending in early ’12. My role ended with the completion of the draft network plan. I had no role in how the plan was presented to the public, and when that didn’t go well in 2012, I assumed it was dead. That is always a possible and valid outcome of a public consultation process.
This year, a somewhat similar plan was implemented without my knowledge and involvement. The implementation has not gone well, for a variety of reasons, most of them not related to the network design. One of the big ones was a decision to switch operating companies at the same time in a way that changed the drivers’ working conditions, something I always advise against.
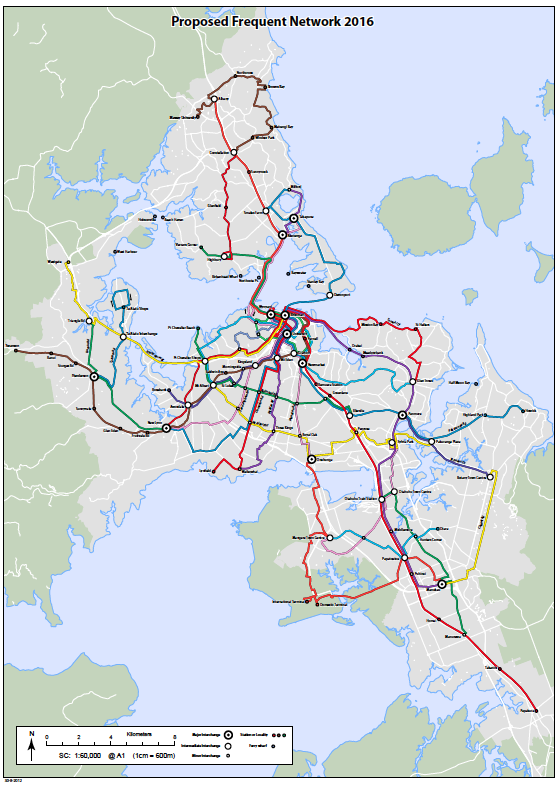
At it happens, my role in Wellington was exactly the same as my role in the Auckland redesign, which has been rolled out over the last several years to great success. In Auckland, too, I led the original design process six years ago, then had no further role except to offer encouragement.
But no facts will prevent Newsroom NZ from constructing me as a cartoon villain, through an astonishing series of blatant falsehoods about who I am and what I believe.
Jarrett Walker, head of JWA, is one of America’s foremost advocates of public transport over cars, but he sees the intense reactions of Wellingtonians and Dubliners as a welcome part of the process. His stance opposing ride-sharing has led Tesla manufacturer Elon Musk to call him “a sanctimonious idiot”.
My exchange with Elon Musk had nothing to do with ride-sharing. It was about Musk’s insulting and ignorant comments about public transport which I identified as an example of elite projection. And while it’s true that I anticipate negative feedback on my plans, that doesn’t mean my goal is to make people upset, as he seems to imply here. All I have said, in many ways, is what every politician knows: Changing anything will upset some people.
In paragraph after paragraph, Mr Louisson wanders around the internet finding things I wrote that sound vaguely incriminating to him, and uses these to construct false descriptions of my views:
Walker takes a very binary view of change. In his blog he says cities should either totally revamp a network or leave it as it is.
That appears to be a perversion of this post, which points out that network plans have a degree of interdependence that limits how much they can be revised without falling apart. People who need me to be a villain imagine me saying “my way or the highway,” which is nonsense. Plans get revised a lot through public consultation, and that’s a good thing.
And anyone who knows me will burst out laughing at this:
His company, Jarrett Walker [and] Associates, is very comfortable with the neo-liberal mantra of user-pays, and a strong commercial imperative underlies much of its design work.
Bonus points if you can figure out what text of mine was misread to fabricate this, because I can’t think of one. I have always advocated heavy state subsidy of public transport. As for commercial, that’s a confusing term that I never use myself, because it gives the impression that the only reason to serve lots of people is greed. (Tip: Sometimes you do it because you want to improve lots of people’s lives.) And even so, of course, I don’t bring an imperative to carry lots of people, because I encourage each city to think about the ridership-coverage tradeoff.
Mr Louisson formed all these insights without interviewing me, but you won’t find out why unless you get to paragraph 28:
Asked to comment on the implementation of the Wellington redesign, Walker seemed at pains to distance himself, saying in an email, “Unfortunately, I have not had any role in Wellington since 2012, and have not had time to study recent events there closely enough to have an opinion.”
While JWA’s work had involved developing a network redesign proposal, “I had no role in the public consultation at that time or in anything that has occurred since.”
My quoted words are indeed the only words I sent to Mr Louisson. I was trying to establish that it would not be interesting to interview me, because I could tell him nothing about what had happened to transit in his city in the last six years.
Does this make me “behind” a revised plan, implemented without my involvement or even my knowledge six years later? And does my unwillingness to comment on something I know nothing about license a reporter to just make up stories about who I am and what I believe?
Remember, if you don’t want your name dragged through the dirt in the media, it’s an easy thing to avoid: Say nothing. Do nothing. Propose nothing. Change nothing.
That’s why nothing gets done.
