by Christopher Yuen
MTA New York City Transit has just unveiled a plan today to completely revamp its bus network. Some elements of the plan that will be especially impactful (from their press release) include:
A completely redesigned bus route network. NYC Transit is performing a top-to-bottom, holistic review and redesign of the entire city’s bus route network – the first in decades – based on public input, demographic changes and travel demand analysis. Route changes will provide better connectivity and more direct service in every neighborhood, with updated stop spacing and the expansion of off-peak service on strategic routes.
Collaboration with NYCDOT, NYPD, & local communities. NYC Transit will collaborate with NYCDOT [the city’s Department of Transportation] to expand the implementation of bus lanes, exclusive busways, queue jumps, bus stop arrival time displays and bus priority technology on traffic signals and buses known as “traffic signal priority.” Many of these changes will also require robust community outreach. NYC Transit will also advocate for strengthened [police] enforcement of bus lanes, dedicated transit-priority traffic teams, and legislative approval to expand bus-mounted cameras beyond 16 existing routes to help enforce bus lane rules in more locations. (Most of the big wins in urban transit require transit agencies and city governments to work together.)
Speeding up boarding by using all doors. NYC Transit is pursuing new approaches to speed up bus boarding, particularly using upcoming electronic tap-to-pay readers to facilitate all-door boarding. While purchasing fare media with cash will always be an option with the new fare payment system being developed by the MTA, NYC Transit will also explore cashless options to speed up boarding time in select circumstances.
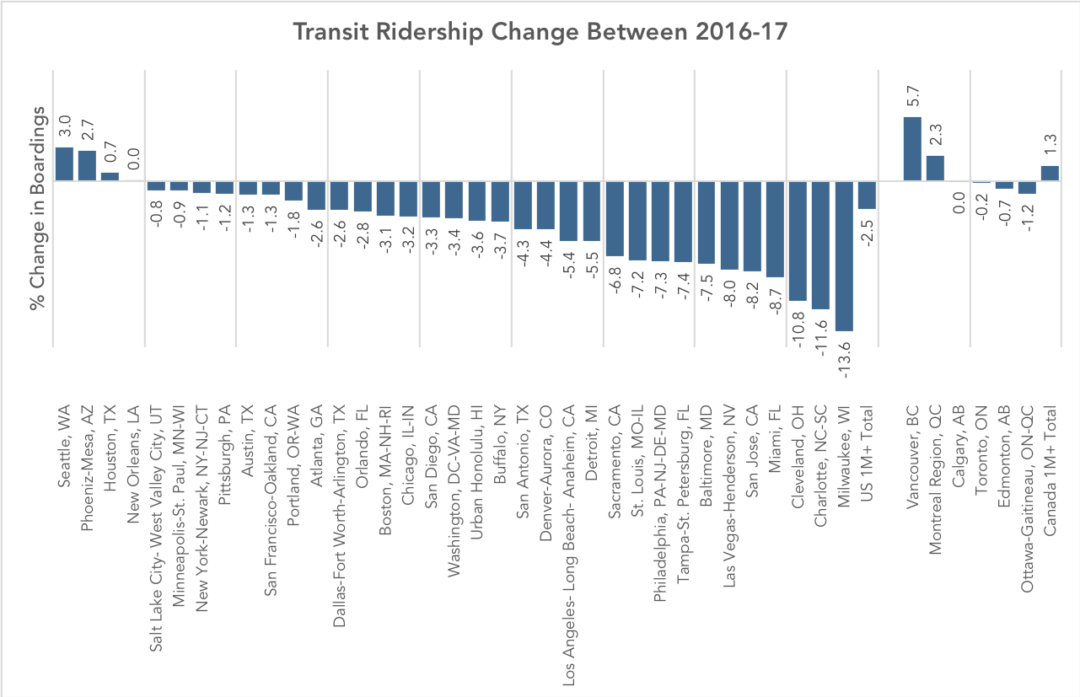
Transit routes are often tweaked in response to infrastructure changes, local desires, and complaints. Some of these changes serve specialized markets and may work well for some people’s specific trips, but over time, they erode the ability for a system to work well for the everyone else. It takes a clean-slate redesign approach to create a network of simple, frequent and reliable lines. The result, as has been the case in Houston, Coloubus, and Anchorage, is usually less routes in total, but more routes at higher frequencies all day, 7 days a week.
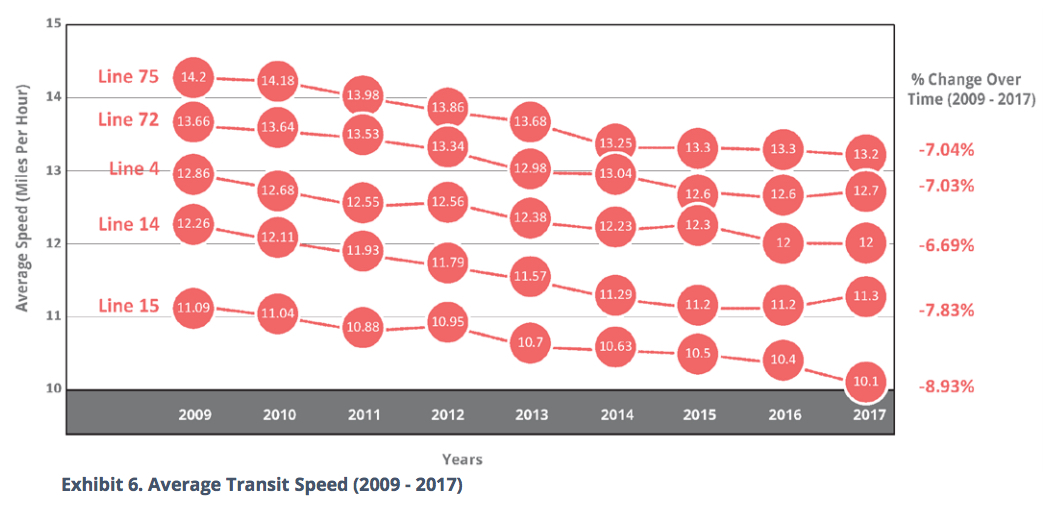
It’s also promising to see the New York MTA include measures to improve the speed and reliability of buses. Since the speed of urban transit is not determined by how fast vehicles go, but by how often they have to stop, increased stop spacing, all-door boarding and properly enforced bus-only lanes will help keep people moving, especially during rush hour when traffic congestion and crowding has its worst impacts. It’s also important to note that for transit, time is money, so faster service means more service for the same operating budget.
New York’s plan is ambitious, and potentially very impactful, so this will be an interesting story to follow over the coming years.