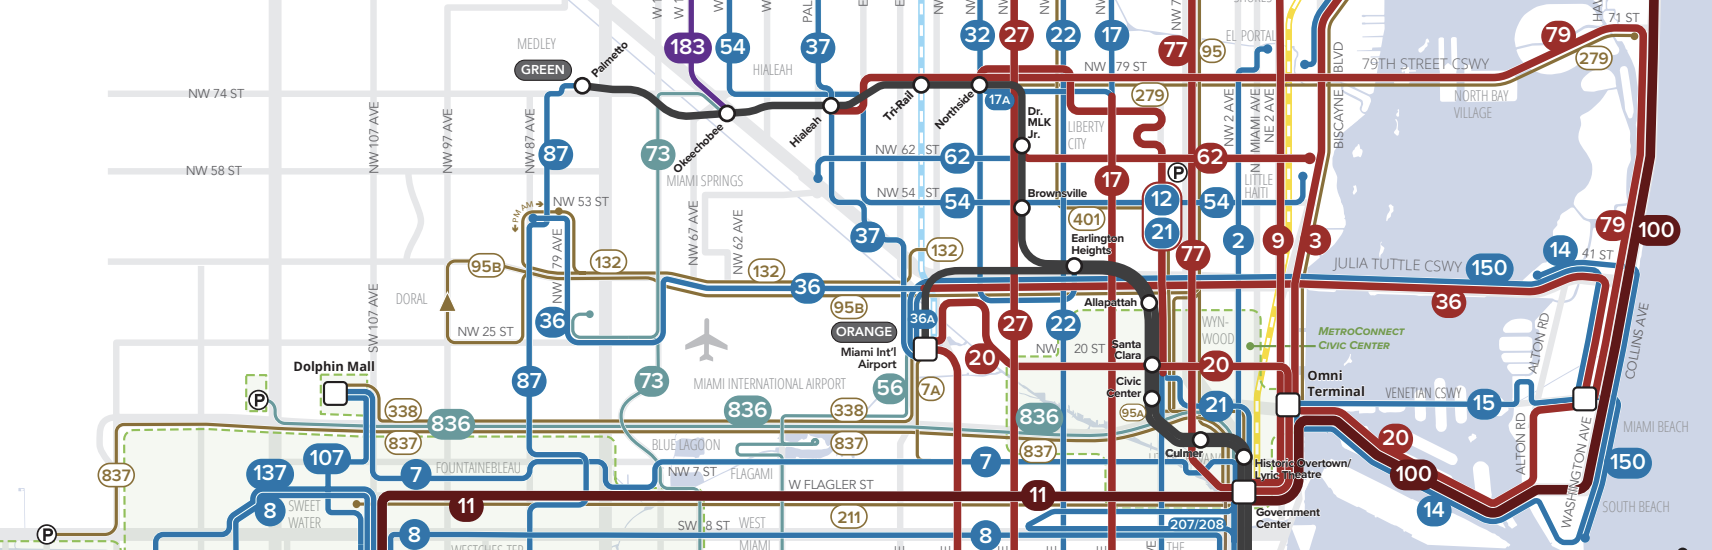
A slice of Miami-Dade’s Better Bus Network. See the link below for the full map.
On November 13, the greater Miami area will see the biggest transformation in where you can go on public transit since Metrorail opened almost 40 years ago. Not a new rail line, but a huge redesign of the bus network that will make it useful to more people for more trips, all over the County. A complete map of the new network is here.
Miami-Dade County’s buses run in patterns that have often been the same for decades, even as the county has grown and many new destinations have appeared. It’s hard to change bus service, because even the most inefficient bus route has people who depend on it and will object to any changes. So, to redesign a bus network, we have to show big benefits that make the change worth the trouble, and that’s what this redesign does.
The plan is the result of a planning project that begin in 2019. In an unusual partnership, Transit Alliance Miami funded much of the work and hired us (Jarrett Walker + Associates) to lead the planning process in partnership with the County. We led a public conversation around key trade-offs, by sharing contrasting network design concepts that showed the consequences of different possible goals. Based on the response to that process, we developed a Draft Plan in early 2020. We were then rudely interrupted by Covid-19.
Since 2020, the County has worked to finish the plan and as published a revised plan, with 30% more service, in 2021. Unfortunately, the transit industry was hit by the labor shortages of the post-Covid era, and the plan had to be reworked to manage with a smaller workforce than previously imagined. Even with the changes, the final plan now being implemented still delivers great results for huge swaths of the county, its residents, workers, and visitors.
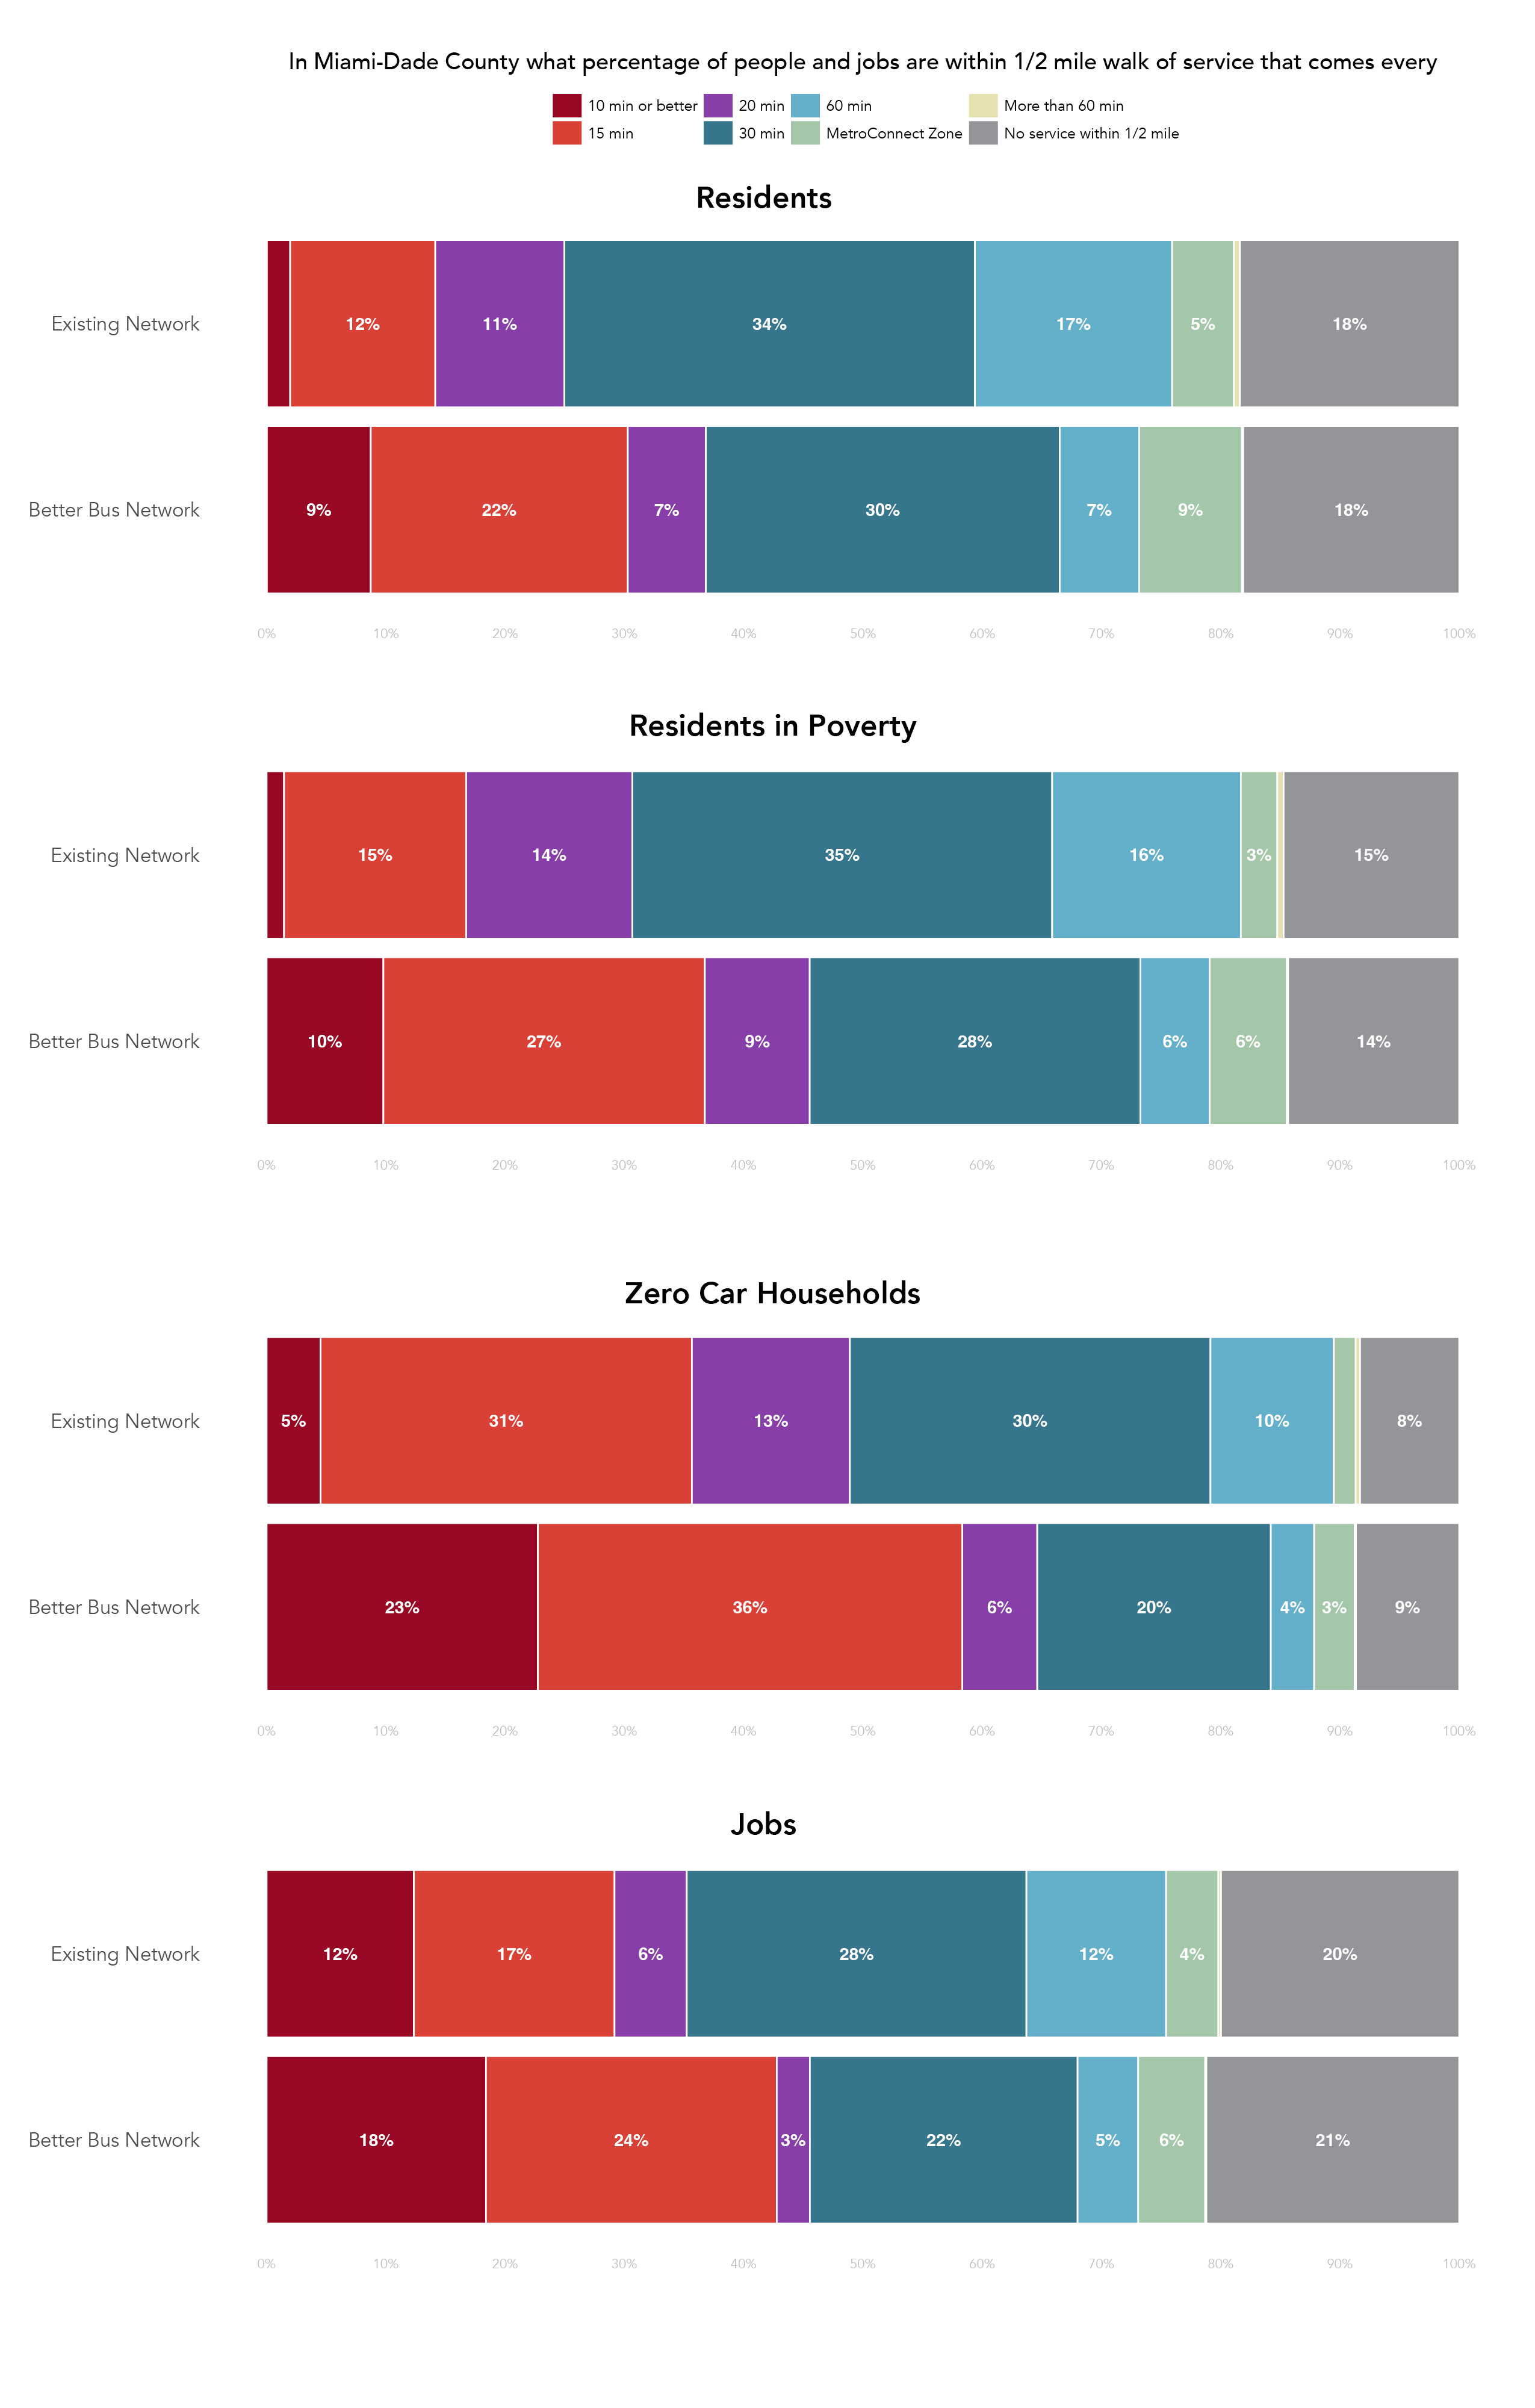
With the new design, a frequent grid will cover large parts of the county with huge benefits. The simplest measure of that improvement is how many people or jobs are near service. The chart below shows the change in residents or jobs near service by the frequency of service at midday on weekdays. The number of residents who live near frequent transit will increase from 380,000 (14 of the County’s residents%) to 814,000 (30%) during weekday service. The new network will bring frequent service near almost 60% of households without cars; that’s 20,000 additional households without cars near more frequent service. And jobs near frequent service will increase from 29% to 43% on weekdays.
A key measure of a network’s usefulness is the access it provides, or how much stuff you can reach in a reasonable travel time. The animated map below shows an example of this change from Little Haiti.
In pink is the area you can reach in the Existing Network in 45 minutes. In blue is the area you can reach with the Better Bus Network. The blue area is larger, but more importantly it has a lot more stuff in it: 30% more jobs and 60% more residents. So if you lived near this place, you would effectively be 30% more free. And if you owned a business here, you’d now have access to 60% more customers, or 60% more workers.
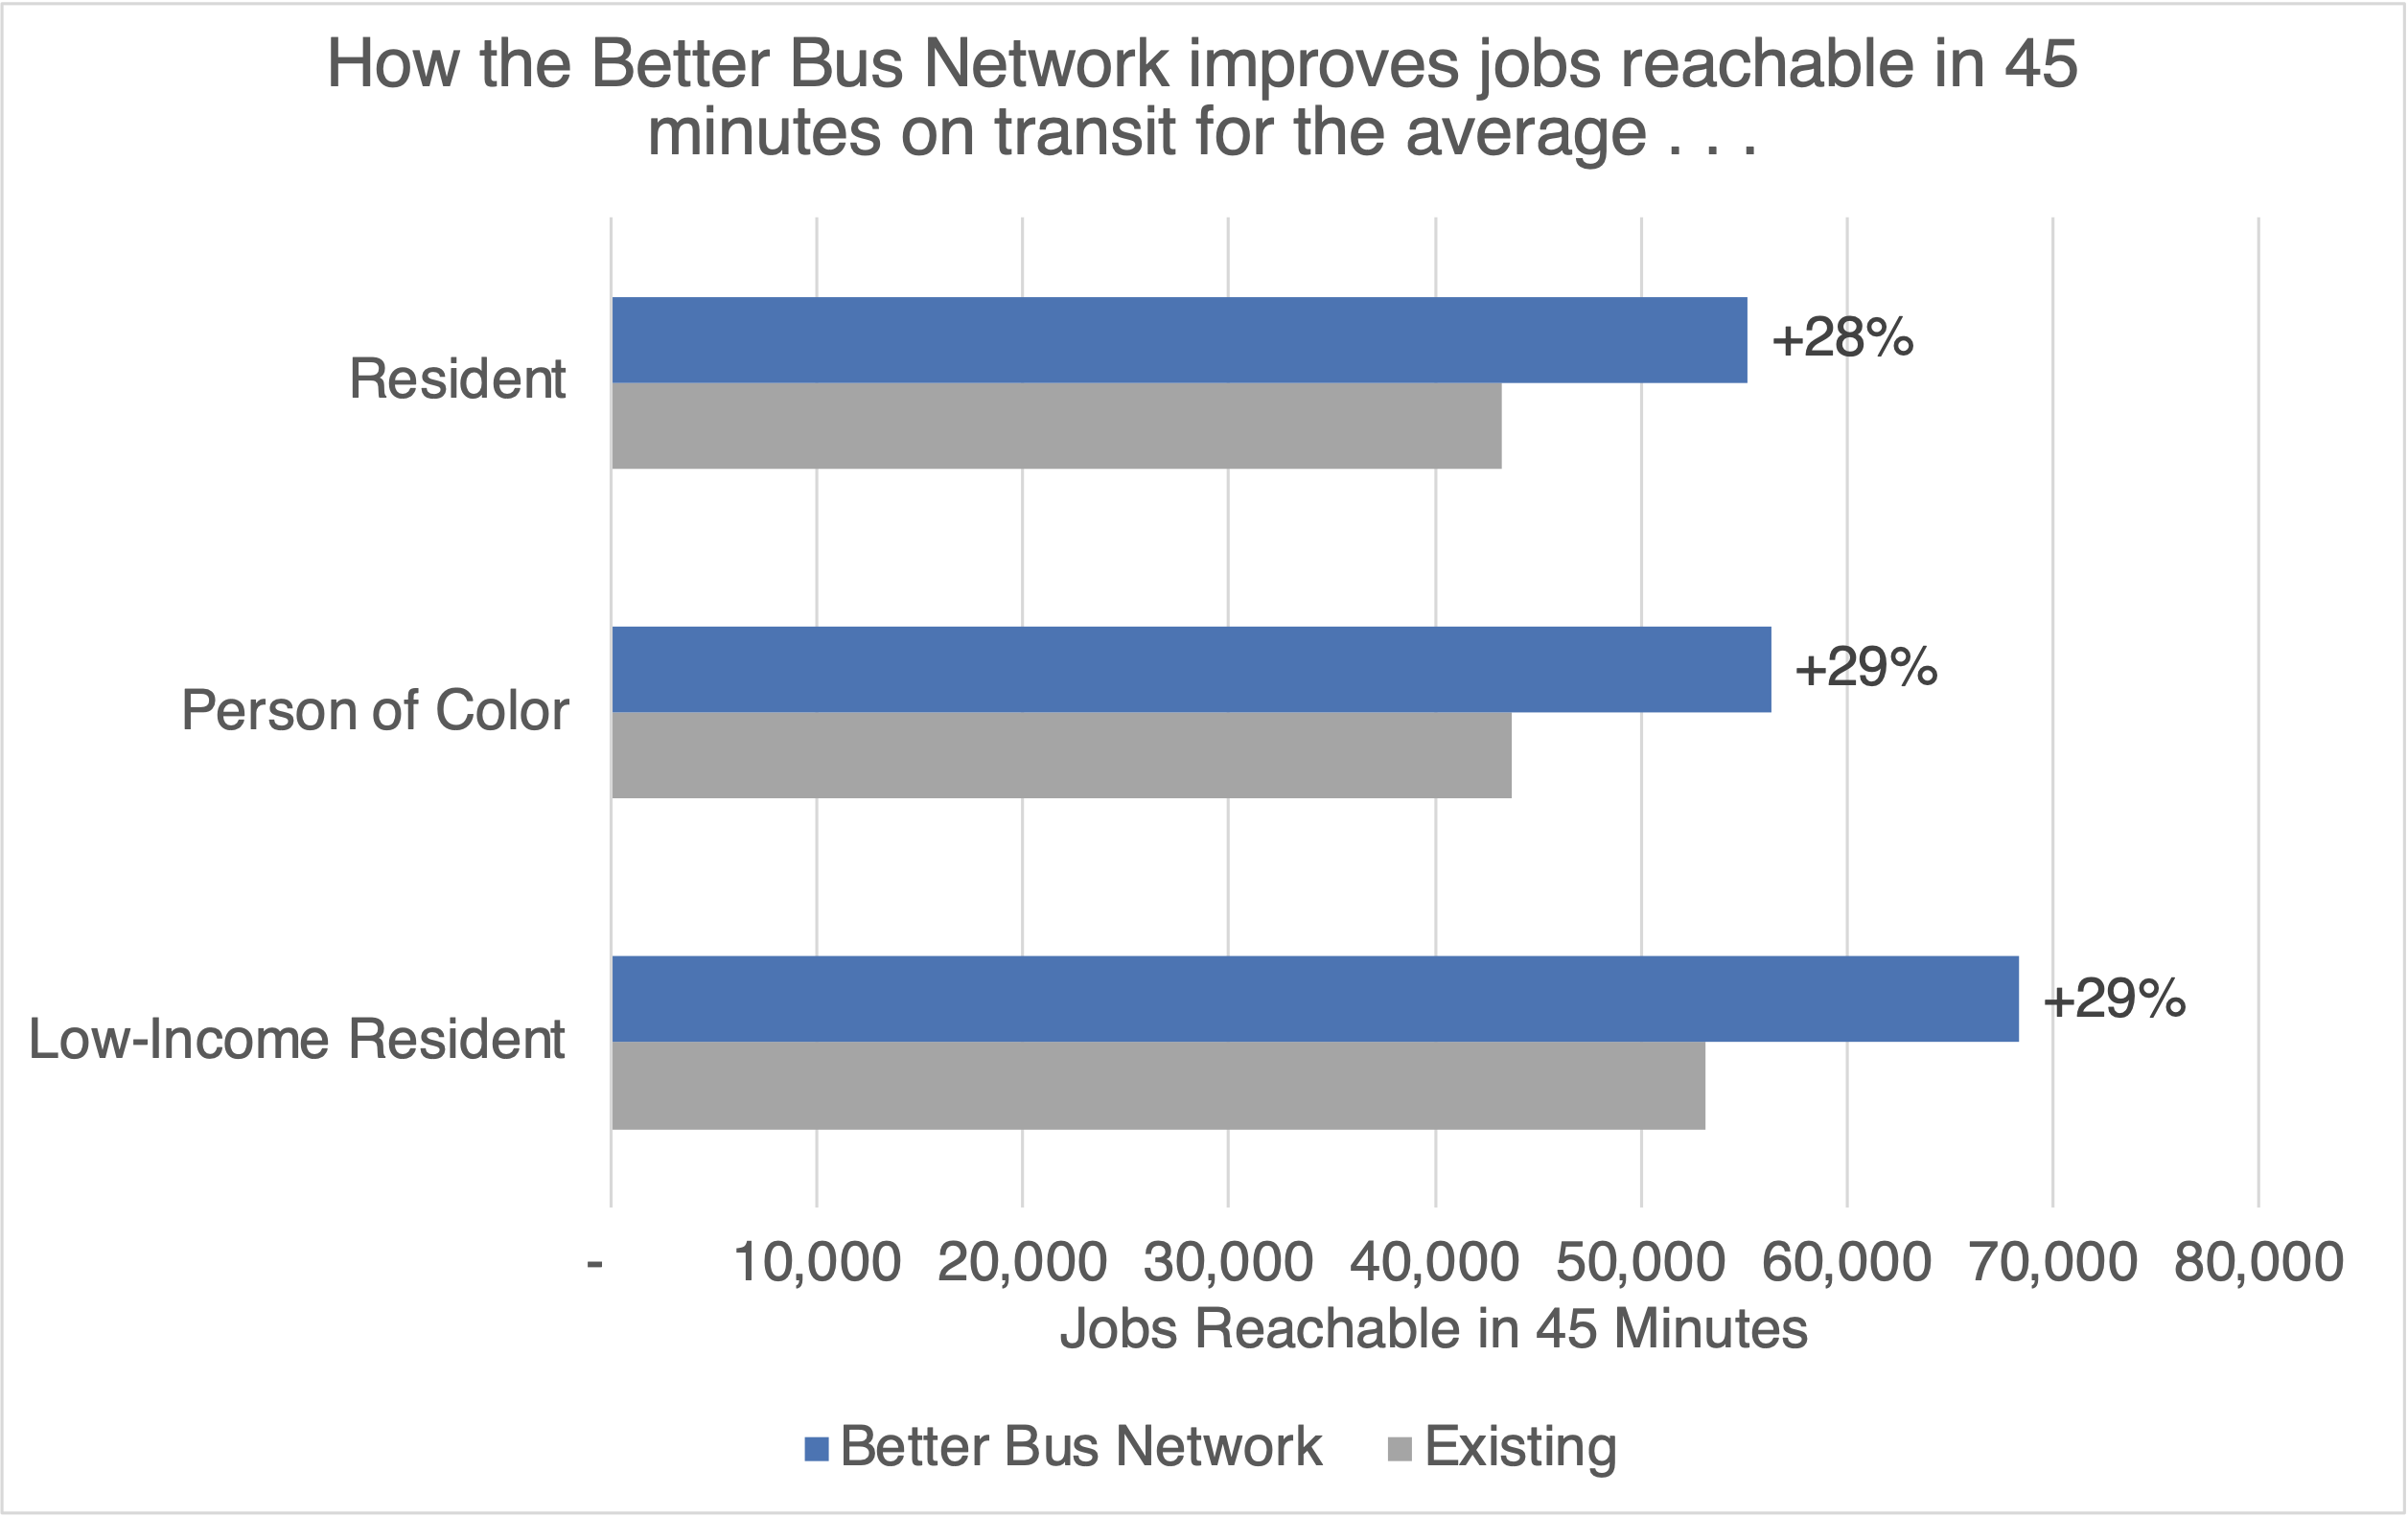 We can measure this exact thing over and over again across the whole county and when we summarize the results we find that the average resident will be able to get to 28% more jobs (or other useful destinations) in 45 minutes. The benefit is even greater for lower-income residents and people of color. That means more people, when they look up a trip they might make, will find that the travel time is reasonable. For more on why we use this measure, see here.
The other big improvement in this new network is a major increase in frequency of service on weekends. Across the country, we’ve worked on network plans that have increased service on evenings and weekends and they’ve often shown huge ridership gains. People value flexibility and spontaneity. Everyone wants the ability to get home outside of the traditional 8-to-5 workday. Critically, though, people working in retail or restaurant jobs often need to work on weekends. A route that runs infrequently on the weekends is missing the peak time for people in these industries, and there are many, many people in these industries in Miami-Dade.
Implementing Big Change
Our team has been working closely with Miami-Dade staff to assist with a range of implementation needs. How does a huge change like this happen overnight? Months, sometimes years, of planning leads up to a big day like this. These efforts included:
- Work by staff across County government to help people find out about the change, and can learn about it easily.
- Briefings of elected officials including partners in the city governments.
- An analysis of compliance with Title VI, the US Civil Rights law that ensures racial equity in transit planning.
- Siting of new bus stops and removing old stops.
- Writing new schedules for customers and bus operators.
- A big effort by operations and safety teams working on testing turns, reviewing stop locations, working with operators to learn new routes, and much more.
- Finally, an infusion of temporary staff near the change date, to be out on the street helping people find their way.
It takes an enormous team effort and County staff have worked hard for a long-time to make this day happen. Transit Alliance has continued to partner with the county to help with communicating the network changes to the public and we’ve been please to assist in that process. Our team has contributed in a few key ways:
- A new system map with routes color-coded by frequency. These maps will start showing up in shelters around the county soon.
- An interactive trip comparison tool to help folks find out how they can make their trips on the new network.
- Developing bus stop signage to inform riders at each stop about which routes are changing.
We’re excited to see how people respond to this new network and we hope it helps set the stage for many transit improvements to come as the County implements its long-term SMART plan.
It would be good, for comparison purposes to see a 3rd item in the animated map, where you can get in a car in 45 minutes (under average midday traffic conditions). Obviously, the bus map will never cover all of it, but it’s still useful to see what fraction of it it does cover.
I also think a stat like “percent of destinations that accessible within 45 minutes in a car that are also accessible within 45 minutes by transit” is a really useful number about the quality of a transit system.
And, of course, the really good transit systems have at least some destinations that are inside the 45-minute window for transit, but not for cars, due to the ability for transit to use rail/bus lanes/etc. to bypass road traffic.
Very interesting measure of a ratio of transit accessibility to auto accessibility.
I wonder if that can succinctly capture/explain why some cities have higher non-car mode share than others.
You failed the people who use the bus who are elderly. You failed the disabled people. You failed the poor by taking away bus stops and bus routes needed to survive. You get an F. So easy for you to design but it never occurred to you to really go out in the streets and see how it really is. You cater to those who use the buses to go to events or are using the system lightly.
Maybe it’s just the map, but–bit frustrating that Route 24 doesn’t go a few blocks north and connect with the 11, 77 etc.–very strange to fragment a frequent network.
Three thoughts:
1) It might be nice to see the same frequency map for the Existing System, for comparison. It’s obvious that the new plan has lots of N/S high-frequency routes in the areas north of downtown, between Biscayne and about 27th Avenue on the west, with a few E/W routes as well. But without the comparison for the Existing System, it’s hard to assess whether there are changes for high-density areas like Hialeah or Sweetwater or Aventura/SIB – or the employment centers west of the airport like Doral. So it’s hard to It’s hard to assess how much this “delivers great results for huge swaths of the county.”
2) If you’re using mid-day frequencies/travel times as your measure of access, does it really make much sense to use **jobs** as a measure of how much the system is improving? Connecting residents to jobs seems like it would more directly involve AM/PM *peak* travel, not midday travel.
3) When summarizing the plan, you might want to explain what the MetroConnect Zone is. I live here, and I didn’t know they had changed the name from GoConnect. (It’s a free rideshare/last mile service to connect to transit in certain parts of the County).
Reply to 2) Mid-day may well be relevant to jobs. One must remember that many people who depend on transit to get to/from jobs don’t necessarily work 9-5 office hours.
Absolutely. But not *all* that many are going to work at mid-day – about 3/4 of jobs start between 6-10 AM, and only about 7% start between 10-2PM. Those mid-day jobs definitely skew to the lower end of income, and MDC transit usage might also, but even so. Plus, if that mid-day frequency isn’t matched by post-PM-Peak frequency at the *end* of those mid-day shifts, then the access isn’t quite as broad.
Without having the Existing Plan to compare, it’s hard to tell – but eyeballing the new map, it looks like the high-frequency lines are mostly connecting the residential areas along Biscayne boulevard into the CBD (downtown and Brickell). Those are massive job centers – but they’ll also over-represent the 9-5 jobs, compared to the retail, hospitality, and tourism jobs that are going to have different hours, and are more densely located in other parts of the County.
https://www.prb.org/resources/a-demographic-profile-of-u-s-workers-around-the-clock/
Good-looking network. My one visit to Miami we used transit to get from our airport-area hotel to South Beach. Front-door boarding at every stop, and busy transfer points, was soooo slooow compared to all-door boarding in San Francisco! Readers and cards aren’t a trivial expense but they would help access time/distance even more.
The better bus is worst than before,if is a 5min wait it’s a better change but a 30min wait is to much….so it’s not better it’s worse.