Angie Schmitt, Right of Way: Race, Class, and the Silent Epidemic of Pedestrian Deaths in America. Island Press, 2020.
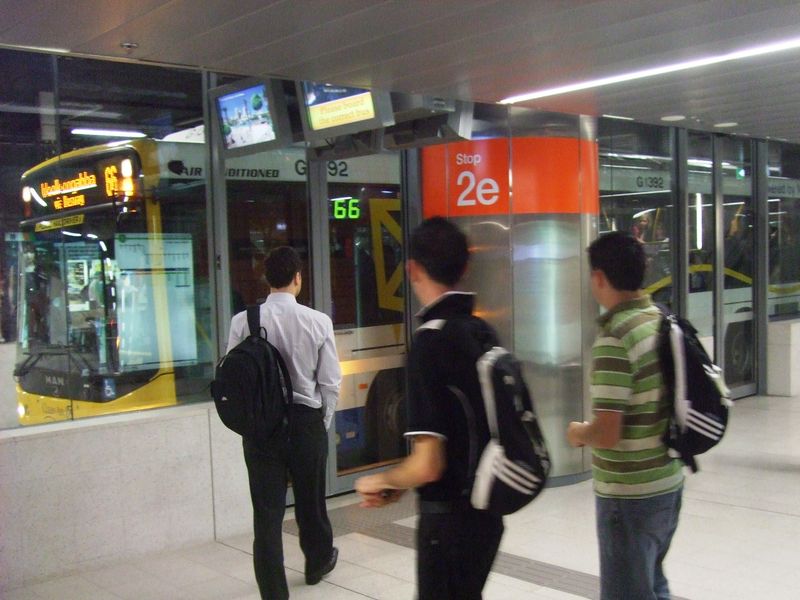
As a transit planner, I work on creating better networks of routes and schedules that will help people access jobs and opportunity. But a transit agency can’t complete any customer’s trip. To do that, the customer needs to walk. The transit agency can make a nice shelter like the one on the right here, but it can’t change the horror that the customer will face trying to walk to their destination, or to cross this street (9 lanes, half a mile from the nearest signal) to get to the bus in the other direction. That curb lane is marked as a bus lane if that makes you feel better.
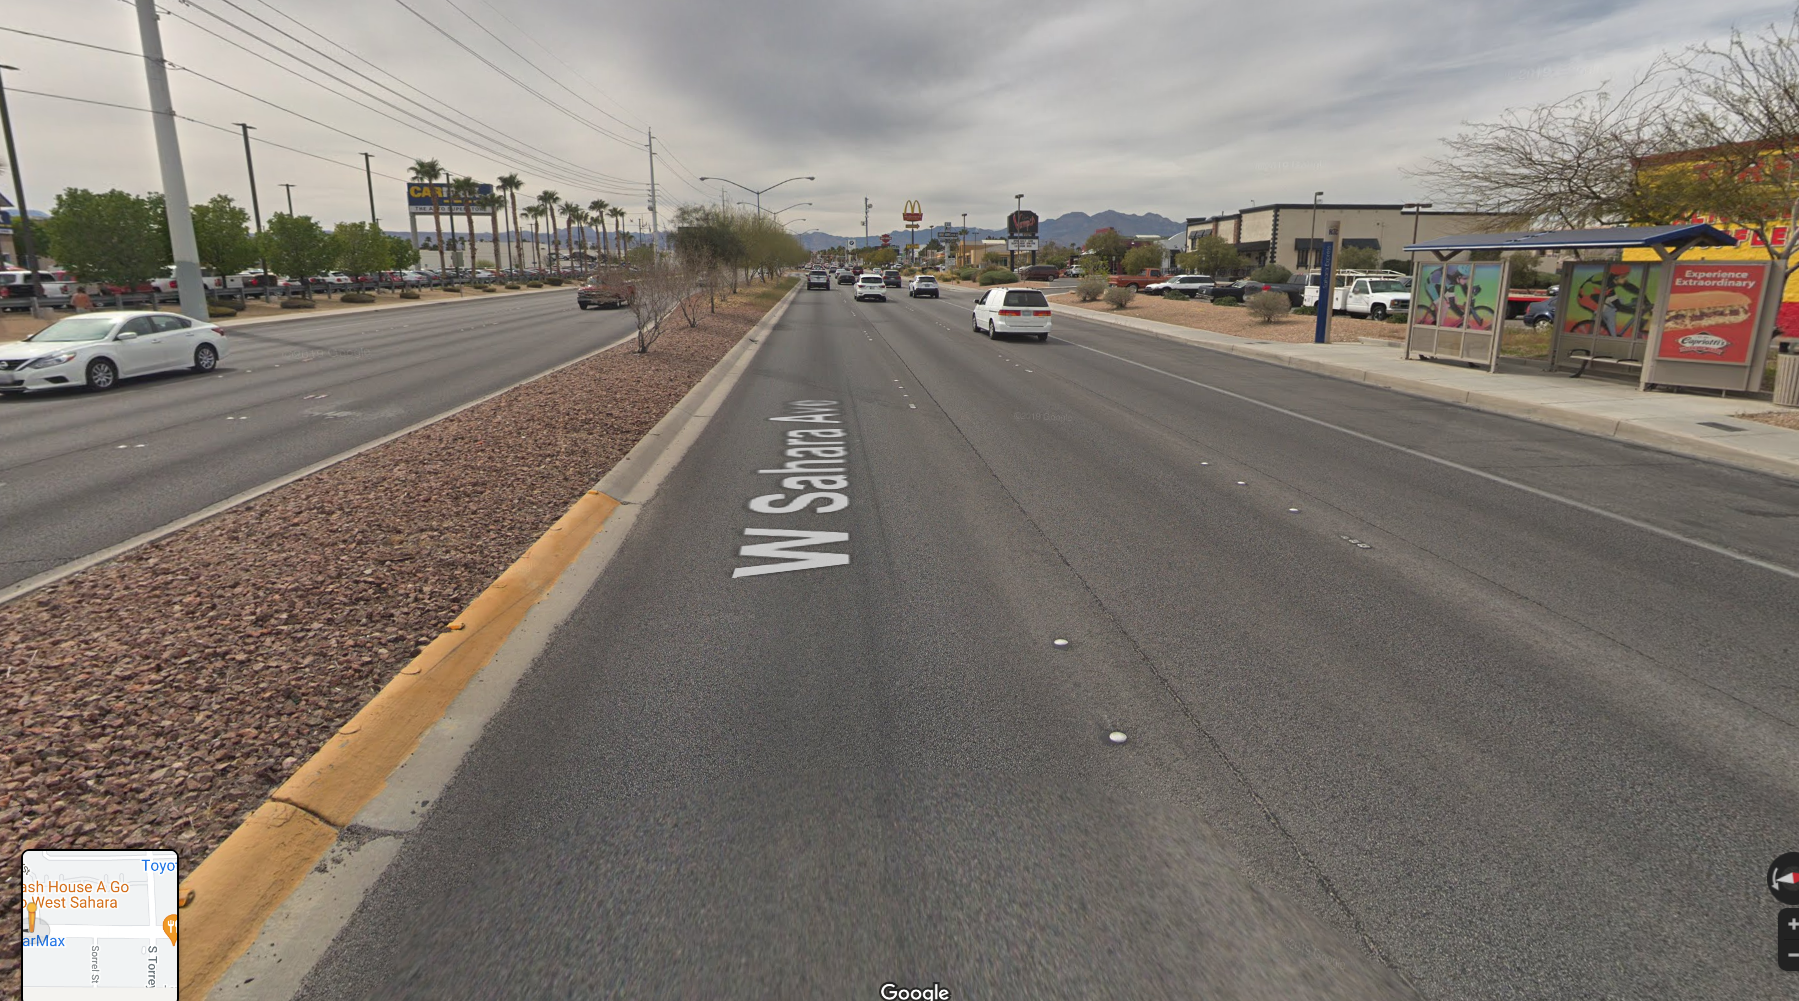
This picture happens to be Sahara Avenue in Las Vegas but as every American knows, it is utterly ordinary. This is the standard suburban street, mass produced around every US city according to manuals that prioritized traffic flow over all other aspects of human life — manuals that are still widely used today.
 When I started my transit planning career in the early 1990s, we faced this kind of suburban street but the stakes were usually lower, because transit wasn’t carrying huge volumes of people to these places. Most of the ridership in major metro areas was in the relatively walkable pre-war inner city. But all that’s changed for the worse. Today, in many US transit agencies I study,some of the highest ridership bus services are on these suburban arterials. People who need transit are forced to live and work in these places, so they have no choice but to dash across those nine lanes, if they are fit enough to dash. My father, in his 70s, used to have to cross a street like this one to catch the bus. He couldn’t dash. He could only hope.
So the fact is shocking but shouldn’t be surprising: compared to ten years ago, 50% more pedestrians are dying after being struck by vehicles — a growing tide of death and mutilation that Angie Schmitt rightly calls a “silent epidemic.”
To clear the space for discussing real causes, Schmitt starts by rejecting the dominant culture’s impulse to blame the pedestrian, which started with the invention of the crime of “jaywalking” almost a century ago. She cites the most obscene examples of victim-blaming, such as the case of Raquel Nelson, a Georgia woman who was prosecuted for the death of her own young son because they had attempted to cross the street together. But she rightly focuses more on the pervasive language choices made by journalists, law enforcement, and other officials that tend to exonerate the motorist no matter what the facts are. Controversially, she even challenges the pervasive “distracted walking” campaigns as an example of setting up public perception to blame the victim. I have mixed feelings about this, because pedestrians gazing into their phones do sometimes step directly in front of buses and trains, but there’s no question that distraction is too easy an accusation in most cases. Crossing the suburban arterial most pedestrians are too terrified to be distracted. My father was not distracted when he set out at 2 mph across a river of traffic going 60 mph. He was simply helpless.
Technology won’t save us, and if it only caters to our urges it could make things worse. Schmitt calls out the trend toward larger and higher-riding cars that make it harder to see a child stepping into the street. In one of the most interesting chapters, she takes apart the various claims of the “driverless” car industry. She sees value in many of the new technologies that alert drivers to hazard, and that could include automatic braking, but of course, much of this technology just opens up new opportunities for human stupidity, greed, and sloth. As the vision of a truly driverless car recedes, we may be looking at a permanent state of partial automation, where the driver must be absolutely alert and ready to act at any moment despite having nothing to do. Maintaining this state of hypervigilant boredom is a superhuman task. People who study meditation for decades may finally get close to it. But when Uber hired people to ride in its driverless test cars and watch for trouble, they didn’t hire or pay for those skills, so when one of their cars killed Elaine Hertzberg, the employee in the car was looking at their phone.
Finally, Schmitt rightly brings the focus back to road design and enforcement. A chapter called The Ideology of Flow looks at how and why streets have been designed on the principle that traffic speed simply matters more than the safety of pedestrians. Here she must take on the Manual of Uniform Traffic Control Devices (MUTCD) an excellent example of the principle that the most controversial ideologies are often hidden in documents whose titles promise that they are utterly boring and irrelevant. MUTCD presents itself as a reasonable set of guidelines to ensure that if you drive from one state to another, the stop signs won’t look so different that you won’t recognize them. But it also contains strong moral statements about the value of human life, such as when it says that a crosswalk should be built only if 93 pedestrians per hour are crossing, regardless of how many people are dying. (This should also recall Brent Toderian’s maxim: You can’t judge the need for a bridge by counting the people swimming across the river.”)
Right of Way is clear, direct, and easy to read. Like a good journalist, Schmitt has strong feelings about this but doesn’t lead with them. Instead, she lays out facts and stories and lets you have your own feelings about them. Ultimately, this book invites the reader to think about the value of human life when it conflicts with our need or longing to go places quickly. Different people may have different perspectives on that, but after reading Schmitt, most will be shocked at just how extreme the epidemic of pedestrian death has become, and what simple things could be done to stop the killing.