Archive | 2016

Cities Must, and Will, Take Care of Themselves (Election Notes)

It’s been a long night.  So just a few notes.

Nobody really knows what lies ahead for the US, but we are probably heading into a period when cities and metro areas must do even more to take care of themselves.  And there’s lots of evidence, from last night, that urban populations know that.

The sweep of victories on public transit measures is impressive.  Raleigh, Indianapolis, Atlanta, and the biggest transit plan of all this year, in greater Seattle.  In California, where revenue raising measures require 2/3, most of the Bay Area and Los Angeles area measures are on track to hit that very high bar.

This is becoming a common pattern.  There is a strong urban consensus about what it takes to make a great city, and the will is there, among urban populations, to do what needs to be done.

Some friends are despairing about federal funding for public transit, which is required to deliver the promised transit plans, and for other critical urban needs. I can’t predict what Federal policy may actually be like.  If you need reasons for hope, there are three:

  • This president-elect is from a big city, he famously likes to build things, and he campaigned on infrastructure spending.  It’s unlikely he will turn off the spigot on urban investments, or that a narrowly divided Senate would let him if he did.
  • I’ve also been through this moment — when one party appears to have won the White House and the Congress — several times.  Each time, it’s appeared that there’s now no impediment to the agenda, but it’s never been that simple.  When you can actually enact an agenda, you pause, especially when you have such a narrow majority in one chamber.
  • There’s simply no mandate here for an anti-urban agenda, or even for budget-cutting and fiscal austerity.  This election was just not about that.

But maybe the Federal role does shrink.  If so, cities and regions will have to do what needs to be done themselves.  Mayors and regional leaders may have to lead in larger and more courageous ways. Bruce Katz (The Metropolitan Revolution) and Benjamin Barber (If Mayors Ruled the World) have been charting this path for a while.   But if tonight’s transit measures are any indication, urban voters know what needs to be done, so the conditions for courageous urban leadership are there.

Personally, I have lots of other feelings about this election.  But when it comes to critical urban needs, one way or another, it can get done.


How “Innovation” Chatter Limits Urban Mobility Today: Election Edition

The new private players in urban transportation have learned to be careful about appearing to oppose public transit — at least, most of the time.  Uber is making a point of supporting some of the biggest transit tax proposals in the country.  Lyft wants you to know that they’re “friends with transit.”  These companies know that they rely on an urban, educated political base — people who can figure out for themselves that shifting lots of people from big vehicles into small ones is not the way to improve congestion, emissions, or pretty much anything that matters.

Still, the hype coming off the technology companies — even when not explicitly hostile to big-vehicle transit — feeds a vague notion that “innovation” will somehow sweep transit away.  And this attitude is damaging transit systems now.  

To make this claim I’ve usually had to refer to my personal experience as a consultant — and especially my constant conversations with local stakeholders and opinion leaders.  But right now, we have some examples, from the websites of opponents of transit proposals around the US.

My point in citing these is not to defend particular transit proposals.  We don’t endorse here.  And it doesn’t matter, to my point, which measures pass and which fail.

My point is that tech industry PR, with its meme of “innovation” somehow changing everything, is now a key source of anti-transit rhetoric.

Here’s the homepage of opponents of the rapid transit measure for the Seattle area, ST3.  It leads off with three big points, one of which is this:
no-on-st-3-jpg

Over in Indianapolis, there’s this, from an opponents’ press release:

If voters approve the transit referendum Nov. 8th, Indianapolis will buy a quaint 1940’s solution to a 21st Century opportunity.  When Uber and Lyft – the transportation innovation leaders of today — are initiating a transportation revolution in other communities, Indianapolis once again looks in the rear-view mirror.   Indianapolis leaders, IndyGo planners, and taxpayers should be anticipating the flood of change that will occur over the next few years—not building permanent bus lanes down the middle of major city thoroughfares which will be rendered obsolete.

Transit plan opponents in greater Detroit accuse a fixed rapid transit plan of “blocking” innovation — after first scaring us with the notion that buses or trains might get in the way of your car:

More Traffic Congestion

Major roads will have lanes closed to create ‘bus only’ lanes – congesting traffic.

Cities with bus only lanes also implement priority traffic signal policies that turn  stop lights green for approaching buses and red for cross traffic – further delaying motorists.

Blocks Mass Transit Innovation

The proposal spends billions on old transit tech like buses and rail while other cities are contracting out transit services to Uber, Lyft, Chariot and others that provide door-to-door service at substantial savings.

Advances in self driving vehicles may provide breakthroughs in personalized, cost-effective transit service that cannot be realized if our region is financially locked for decades into a dinosaur mass transit system.  [emphasis added]

Yes, there may be breakthroughs, which may have the outcomes we hope for, and this is reason enough to declare our existing tools to be “dinosaurs.”  The idea is that future inventions should destroy useful things today.  

It’s completely understandable that inventors want us to think this.  If we throw away our existing solutions to urban problems, we will be even more dependent on their inventions, which will be good for them.  That’s why we must lean into the wind, being skeptical but not cynical about the good things invention may bring.

Why should we continue to invest in big-vehicle, space-efficient public transit, and protect what we have from degradation, when all this innovation may occur?

  • Technology never changes geometry.  In dense cities, the efficient use of space requires continuing to move large numbers of people in large vehicles, which is what successful urban transit networks are.  (The story may be different in low-density suburban areas, where demand is sparser and space is more abundant, especially if those places don’t intend to grow denser.)  The only way to move large vehicles efficiently and also attractively is first to run them frequently, and second, where possible, to protect them from traffic congestion.  Yes, this may get in the way of your car.
  • Inventions never turn out as hoped, and especially not as hyped.  They have downside impacts, some of them entirely predictable.  They destroy things that turn out to be valuable, especially because …
  • Making something easier causes more people to do it.  This is how autonomous cars could cause an explosion of vehicle trips that would overwhelm any space-saving benefits of the technology, congest our cities to the point of dysfunction, and thus trigger a new generation of urban sprawl.  Do you believe that autonomous cars will radically expand your liberty, even in the densest cities?  Do you imagine that you, a city dweller, will be able to get out into the beautiful countryside more easily, so that you could even buy a cabin in the woods?  That’s what the proponents of cars wanted you to believe 100 years ago.  The problem isn’t that you got those things, but so did everyone else.  So the liberty of the motorist became the prison of congestion, and everyone’s cabin in the woods meant there were no woods left.

Again, if you’re new to this, autonomous vehicles can be a wonderful thing.  The problem is the hype about things uninvented, and the way it encourages us to destroys things that we value, now.


Follow Transit Referenda on US Election Night

Yonah Freemark at The Transport Politic has set up a page where you can follow election night returns about the 20 biggest transit-related referenda to be voted on November 8 in the US.   His summaries are good, always mentioning operating funds and local bus service, not just the big-ticket infrastructure.

The biggest are in the Seattle and Los Angeles regions, both of which are behind the curve on rapid transit development, given their size, density and growth rates.  Both measures, which raise sales taxes, are close things.  The Seattle-area measure covers a huge three-county region including exurban areas that vote against transit routinely.  Los Angeles County has clear majorities for almost anything transit-related, but the measure requires 2/3.

Personally, I’ve never had so much of my own work, and that of my firm, at stake in one cycle of referenda.

Two plans that we worked on extensively are on the ballot, in Indianapolis and in Wake County (Raleigh area), North Carolina.  Both are dramatic expansions of transit that create robust frequent transit networks in the denser parts of those cities, while Wake County’s also includes a commuter rail program.

In San Jose and Silicon Valley, in California, we are also in the midst of working on a network redesign to accompany the opening of BART next fall, and this design will be considerably more abundant, with less painful trade-offs, if Santa Clara County’s sales tax increment passes (also a close thing, as it needs 2/3).

We also did some work in Spokane, Washington, in the area of Board and stakeholder workshops, that helped lead to the Moving Forward plan on the ballot there.

As a consultant, I don’t make endorsements.  But peruse Yonah’s list, and if you live in one of these places, please read up on these measures to make sure you have an informed view.


Auckland: South Auckland Redesign Rolls Out

Back in 2012, I worked with Auckland Transport to design a completely new design for the city’s transit system.  (Auckland has a single city government covering the whole urban region, so you could also call this a regional plan.)

The old design — if it could be a design at all — had been the result of private operating companies designing their own routes to their own advantage, which led to enormous numbers of express buses into the Auckland city centre (where they created major bus congestion) but poor services for getting around locally or crosstown.  It was also just impossibly complicated …

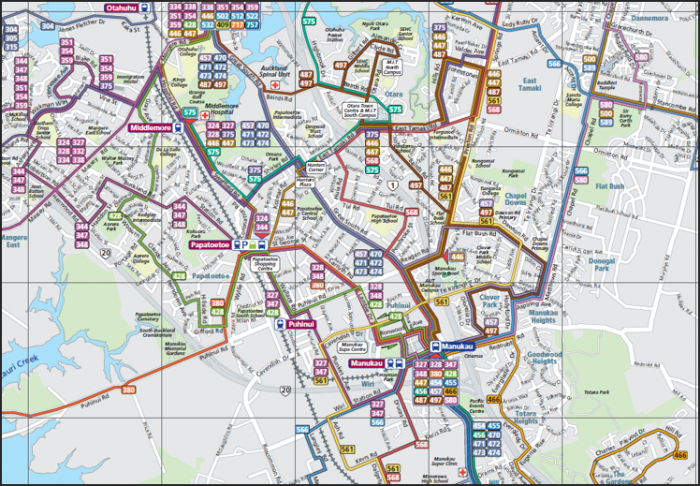
Old network in southern Auckland. Can you see how to get anywhere?

Old network in southern Auckland, almost all infrequent. Can you see how to get anywhere?

The new network emphasizes all-day high-frequency services, connecting to each other in grid patterns and to newly frequent rail lines.  Read about that big picture, and its payoffs, here.

A small piece of the network, in the Green Bay area, was implemented last year, and achieved a 20% ridership increase (on no increase in service quantity) in the first year.  Now, the first really big piece has been rolled out across southern Auckland.  This area, formerly the City of Manukau, is relatively low-income, ethnically diverse, and features fragmentary, shredded street patterns that are a huge challenge to network designers.

A fragment of the old network is above.  Virtually none of it, including the train line, was frequent.  The overlapping lines with uncountable 3-digit-route numbers show local routes tangled up in express routes going all the way into the CBD far to the north, competing with the rail line.

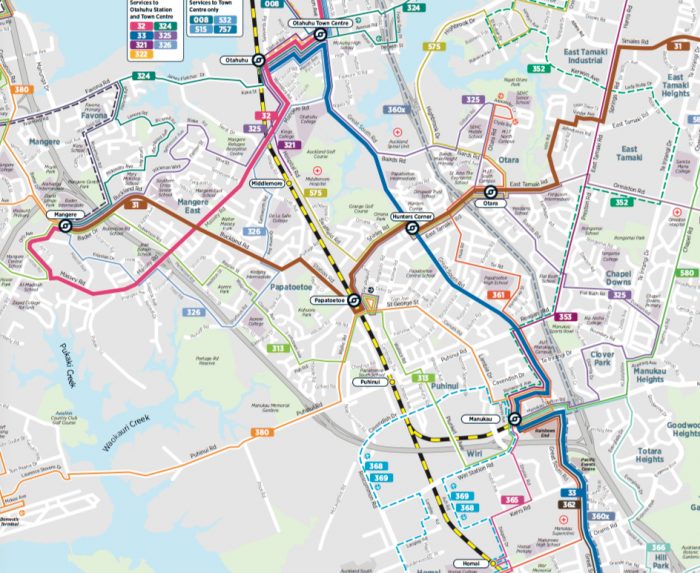
Here’s the same slice of the new network (beautiful full map here):

New South Auckland network. Wide lines (31, 32, 33) are the Frequent Network

New southern Auckland network.  Wide lines (31, 32, 33) are the Frequent Network

Why the huge reduction in complexity?  Virtually all express buses to the CBD were replaced by buses connecting to the main rail line, which is now frequent.  Local lines were organized so that they form a logical network feeding into local hubs as well as to major rail stations.  Note that not all rail stations are bus hubs; the network concentrates only on certain rail stations so that buses connect with each other as well as with the trains, and so that consolidated station facilities can be built at these locations.  The biggest new hub, Otahuhu at the north end of South Auckland, has a huge number of buses feeding it, and got a shiny new bus-rail station for the new network’s opening day.

As always, there will be hiccups in the implementation process, as people adjust. But it’s great to see this plan, first sketched four years ago, on the street at last.

Guest Post … European Bus Maps: the State of the Art

Jug Cerovic is an Architect and Mapmaker. He leads the consultancy and workshop INAT Maps & Cityscape (www.inat.fr).

The notion that Europe has superb public transit does not always extend to the quality of public transit maps.  In fact, the struggle to improve transit maps is not much more advanced in Europe than it is in North America.  I have studied more than 250 European cities and their bus maps, and have also designed a few.  Here are some observations about the state of the practice.

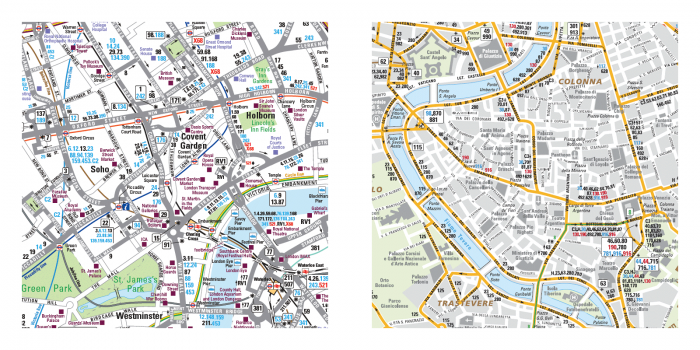
All transit maps fall within two main categories: geographic maps that show the real scale and distances, and schematic maps that help you see the network structure. Some cities use geographic maps, some use schematic maps and some use both of them. The choice is up to each particular city, there is no national preference or link with population size or urban shape. Some tendencies appear though; in the South of Europe (Italy, Spain), geographic maps are predominant while Scandinavian countries and Switzerland prefer schematics. French and German cities tend to employ both.

Transit maps, both schematic and geographic, can be grouped into 3 distinct categories, depending on the primary meaning of color.

  • Color for technology.  These maps use one color for trams, another for buses, etc.
  • Color for lines.  Color is used to help you trace different lines through the network.
  • Color for frequency.  Color helps you identify high-frequency services, so that they stand out amid the complexity of less frequent services.

Color-for-technology

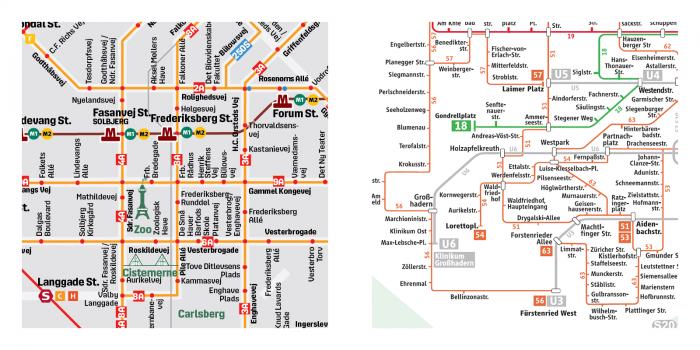
These maps assign a limited number of colors to each transport subsystem (bus, tram, metro) and do not separate single lines one from another.

With this kind of map, you can tell which street is used by public transport and which is not, as well as where the stops are located. It shows the space occupied by the network inside the urban territory but doesn’t tell the traveler how the network functions. With such a map it is difficult to plan even the simplest journey as you need to search for consecutive line numbers along a route. Complex journeys with transfers are next to impossible to plan.

Surprisingly enough, a lot of cities publish such useless maps, failing to inform the users about the real potential of the network.

I can only speculate as to why they do so. Perhaps they just do not care, and showing that the network exists and covers the entire territory is enough politically. Maybe they fear that showing the exact state of the network will reveal inconsistencies and provoke resentment or demands from citizen. Or, it may simply be that they consider the network to be too complex to be shown otherwise!

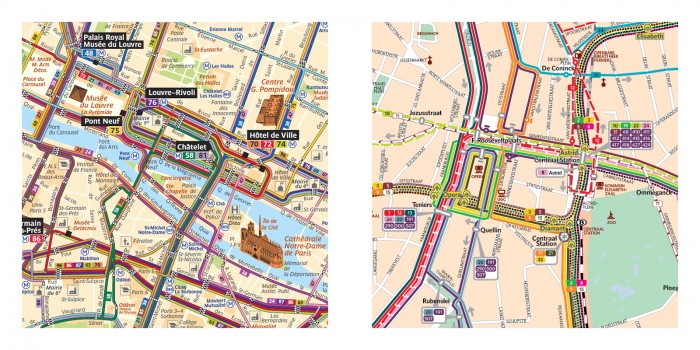
monochromatic: london and rome

Color-for-technology in a geographic map: London and Rome

copenhagen-munich

Color-for-technology in a schematic map: Copenhagen and Munich

Color-for-line

These maps show assign each line a particular color. You can therefore easily follow a line’s route from end to end, without any ambiguity or confusion. Seeing each line separately enables a traveler to visualize complex journeys with several transfers or modal changes. Instead of sticking to the one line you know best, you can plan an onward journey different from the backward one. Unlike monochrome maps, a multicolored bus map doesn’t show a territory occupied by public transport but a network of lines and their stations with all its details and potential journeys.

It works even with very complex and dense networks such as Paris even though the legibility hits a limit in some very crowded areas where more than 10 lines share the same street segment.

A major weakness of a standard multicolored map is the egalitarian representation of all lines which can be misleading when they differ substantially in frequency.  If you are on a line that runs every 30 minutes but there’s a useful line nearby that’s every 5 minutes, you’d never know from these maps.

paris-antwerp

Color-for-line in a geographic map: Paris and Antwerp

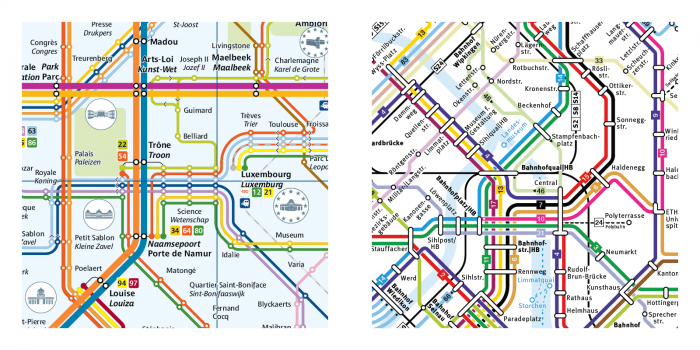
brussel-zurich

Color-for-line in a schematic map: Brussels and Zurich

Frequency Maps

The problems of the previous two styles of map are addressed by frequency mapping, which this blog has advocated for many years.

Not only does it single out lines and show the network, but it also assigns to each line a frequency marker, usually a difference in width or color, which instantly differentiates lines with frequent service from lines with less frequent service. This makes it possible avoid long waiting times. These new maps seem to illustrate a change of perception of the network, both by the operators and by the users. A general shift in working time and communication access has transformed the simple commute to work into a much more complex web of journeys. A frequency map is an information tool that enables such a complex travel pattern and also serves as a communication medium between the operator and its users.  It can also assist people in choosing places to live so that they will have access to good transit.

As of today, European frequent maps are found in only 5 clusters in Europe: Slovakia, Scotland, France, Germany and Benelux.

Slovakia: Bratislava, Kosice

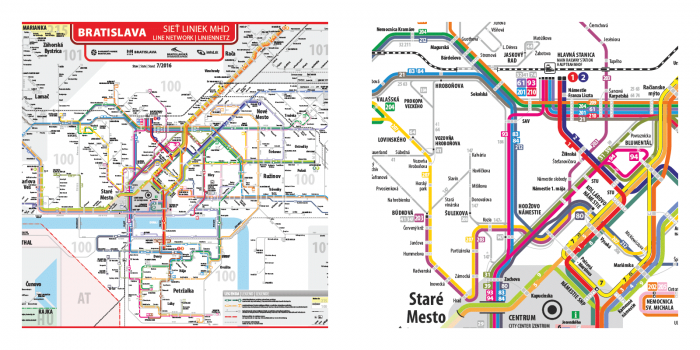
Slovakian maps indicate a difference between Main lines and Secondary lines, with a difference in thickness and color. One can guess that Main lines are more frequent or faster than secondary lines but the legend doesn’t state it clearly.

unnamed-5

Main lines map: Bratislava

United Kingdom: Edinburgh, Glasgow

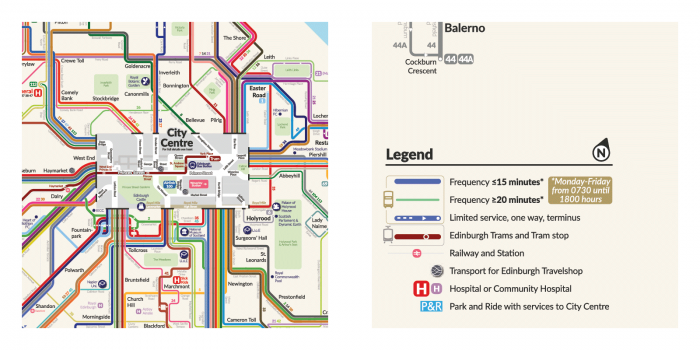
In Scotland you can find some real frequency maps where lines are strictly classified as frequent or less frequent. Unfortunately both the Glasgow and Edinburgh maps suffer from 2 limitations: the bus stops are not indicated and the city center is shown only on a separate inset, leaving the most important part of the network blank on the map.

edinburgh

Frequency map: Edinburgh

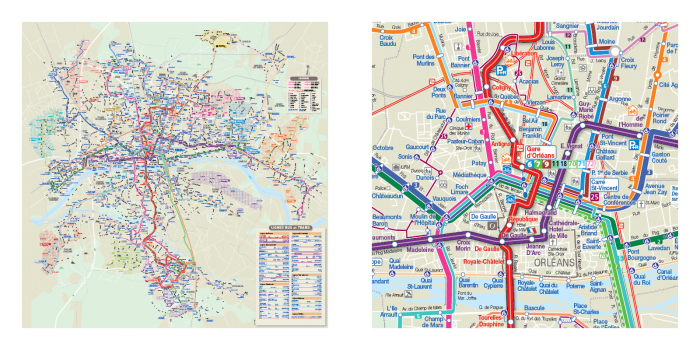
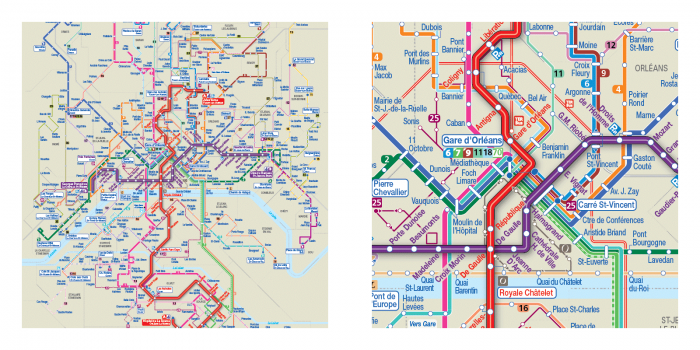
France: Amiens, Bordeaux, Dijon, Grenoble, Lyon, Metz, Orléans, Reims, Toulon

France has enthusiastically embraced frequency maps, with numerous examples of both the geographic and schematic types. Most cities even publish maps of both types. The maps are comprehensive, with all necessary information about stops, routes and line types, sometimes even a bit too much, overwhelming the user with information.

orleans-geographic

Frequency geographic: Orléans

orleans-schematic

Frequency schematic: Orléans

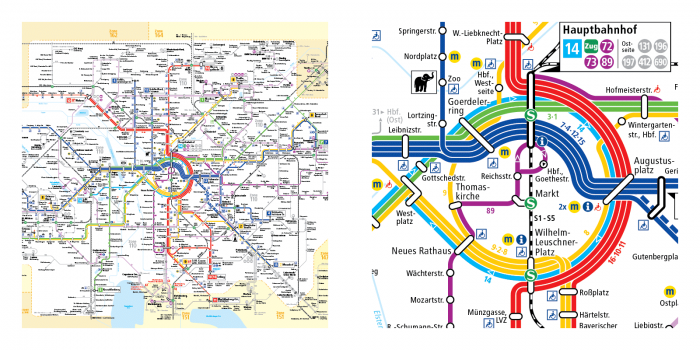
Germany: Aachen, Braunschweig, Chemnitz, Dresden, Leipzig, Magdeburg, Onasbruck, Rostock

One of the best European Frequency maps is in Leipzig. Lines are singled out, a color is attributed to each of them and frequency is shown with a difference in width. But most of all, lines and colors are organized in a way that shows how the system really functions. The layout is focused on the centrally located circular loop surrounding the old town and all lines serving this area are color coded according to their common routes. This makes the network intuitive and unambiguous for the map reader.

leipzig

Frequency map: Leipzig

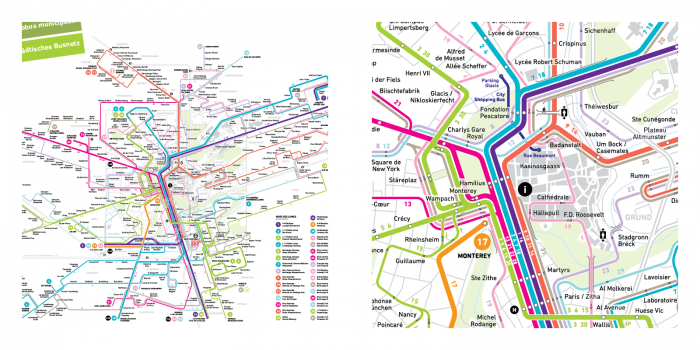
Benelux: Luxembourg, Utrecht

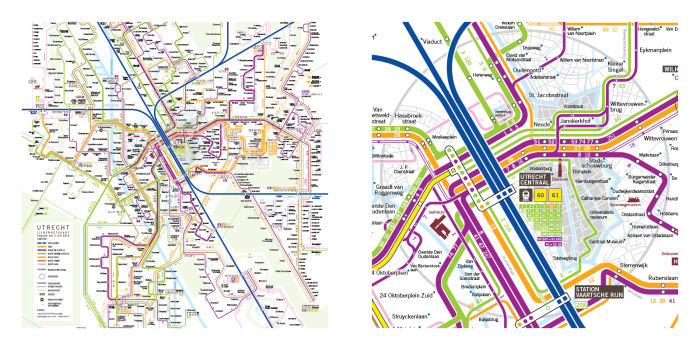
Here, I must inform the reader that I am the designer of the new official maps of Luxembourg and Utrecht. These are frequency maps in full, with additional improvements in line grouping, symbolism and combined scales. Here in the thinking that led to these designs.

Line grouping

When two or more less-frequent lines share a long common route and when their timetables are synchronized, their frequencies add up and this common trunk route effectively becomes a single high frequency line. These lines are grouped on the map and assigned the same color; the trunk part is a thick line with thinner branches at each end. Lines are also color-coded and grouped according to their functions.

In Luxembourg, on the central corridor where more than 15 lines share the same street, lines are grouped by directions, forming only 5 thick trunk lines thus simplifying readability.

In Utrecht bus lines are grouped in 5 categories for legibility (terminal in the center, thru lines, university, tangent, local) and other transport modes have their own color (train, tramway). Line grouping is a way to simplify the network and intuitively convey its organization to the traveler.

Symbolism

Symbolic elements are highlighted in order to ease orientation and conform the map to the mental image of the city people may have.

In Luxembourg, the old fortress town, placed in the center of the map, is roughly pentagonal in shape and commands the angles at which avenues radiate from it. All line segments on the map are multiples of 18° as it allows for both orthogonal (18° x 5 = 90°) and pentagonal based (72°) axis.

In Utrecht the main landscape marker, apart from the old town, is the rail line cutting through the city at a roughly 60° angle. A 30°- 60°- 90° angle pattern  fits the street grid and overall layout marvelously.

Combined Scales

In both cities the network is very dense in the city center and sparser in the periphery. The city center is also the area where most pedestrian connections between lines are located. The map has to show two very different scales: the city center where walking distance is important, and the periphery which has fewer connections and can be simplified and distorted. Therefore on both maps the city center is enlarged and geographically accurate, streets and remarkable buildings foster orientation and enable pedestrian connections, while the periphery is shrunk and schematized while remaining topologically accurate.

luxembourg

Frequency map: Luxembourg

utrecht

Frequency map: Utrecht

As these examples show us, European bus maps are witnessing an exciting new era of creativity and bus networks will benefit hugely from this improvement in representation, with maps that allow them to be perceived as comprehensive transport networks in their own right and not mere collections of independent lines.

Autonomous Cars and Induced Demand: a Historical Perspective (Comment of the Month)

From “Marc“.  Links added by me.

 It seems that Jevons Paradox is always in force: as single-occupancy travel has become cheaper and easier over the centuries (first by foot, then by horse/carriage, then by bike, then by car/taxi, then perhaps by autonomous car), all we’ve done is induce more travel.

This is hardly “bad” – who wants to be stuck in the village they were born in for their whole life like most people were in the 18th century on the eve of the Industrial Revolution? – but I think it merely means we can’t yet argue that autonomous cars will overcome the timeless congestion-caused-by-induced-travel phenomenon, and that if congestion therefore remains in populated areas, so too will remain the pressure to get around it via fixed-route transit, on dedicated lanes, viaducts, and tunnels wherever possible.

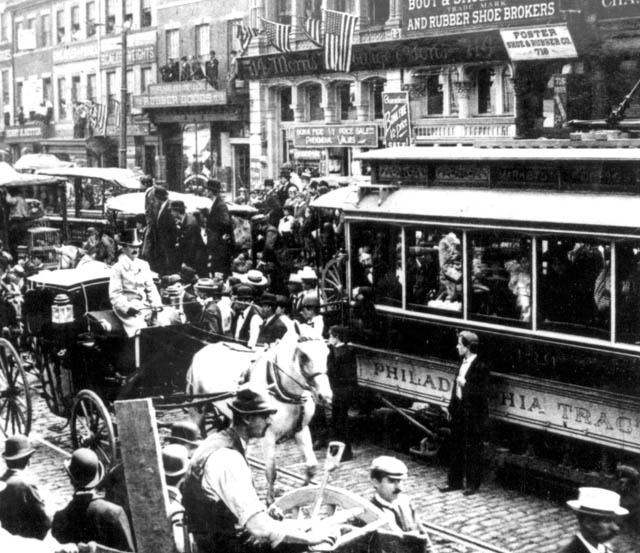
Congestion in Philadelphia, c. 1900. From, ironically, Professor Eric Morris’s article “How the Motor Car Saved the City, ” http://evworld.com/urban.cfm

All we’ve been doing in the great project called civilization is swapping out the mode of congestion – the old 1930s Garden City documentary “The City” showed sidewalks oppressively crammed with people, then with horses and carriages and bikes, then finally with cars. Ironically and against what we would ever have expected, the postwar trend towards dispersed settlements has only increased congestion exponentially – why do Atlanta and LA and Houston build 10-lane highways in a desperate effort to outrun congestion, only to find they have to widen them a couple years later?

Amazingly, dilution in living patterns induced by ever-cheaper/easier transportation has not led to congestion relief, but exacerbated it tremendously due to the ever-increasing need to travel for *more and more basic functions that previously required less or no travel.*

Why is there any reason to believe that autonomous cars will overcome this ancient dilemma? I can imagine a world where autonomous cars are eventually organized as efficient rideshares to minimize a lot of initial wasteful, capacity-gobbling deadheading and idle cruising, but I think when the initial wasteful excesses are wrung out, the resulting available capacity will be swallowed by increased travel induced by efficiency. Again, this is hardly “bad,” I think it merely means that we probably won’t escape congestion and therefore there will be perpetual pressure for space-efficient workarounds for congestion (transit).

Finally, while I can imagine eventual vehicular throughput gains on urban/suburban streets induced by cheap mass ridesharing (i.e. fewer single-occupancy vehicles, which will always be inherently space-inefficient regardless of who/what’s piloting them), I’m finding it hard to imagine increased throughput under the “faster and closer bumper-to-bumper travel” assumption. On most urban and suburban surface streets, bumper-to-bumper travel at low to moderate speeds is already the norm, so can we really push the cars closer together? If you’re already two feet behind the guy in front of you, can the autonomous vehicle get any closer? At such close distances, aren’t human reaction times irrelevant because physics are still in force: you’ll still need a minimum distance for a vehicle of a given weight to safely accelerate/decelerate/stop regardless of who/how it’s being piloted.

Moreover, low urban speeds are caused by the *basic structure of the urban fabric itself* – small blocks and frequent conflicts. Autonomous cars can overcome this if we enlarge blocks and limit conflicts (as we already do for limited-access highways) by introducing “smart intersections” and various other traffic control tactics that will attempt to allow strings of autonomous vehicles to speed unimpeded through urban and suburban blocks. But will it be a Pyrrhic victory like the first attempt was?

I love it when someone who can think historically wades into this debate.  Commenter “MaxO” replied:

Here’s a good discussion of the potential for self-driving cars to reduce (or even eliminate) road congestion and increase road capacity: http://www.templetons.com/brad/robocars/congestion.html

I also think you’re misrepresenting Jevon’s Paradox. It doesn’t mean that if supply is increased, demand will always increase to consume all of that additional supply. If it did, all roads would always be at capacity. It just means that an increase in supply is likely to induce some increase in demand.

To which Marc replied:

Max, I like the author’s thorough musings, but I think he still seems to be falling exactly into the trap I described: He described various *efficiencies* that will only increase capacity, thereby inducing more travel to fill the capacity.

I’m not arguing that induced travel will cause us to hit capacity *everywhere*, but in any economically dynamic region any transportation efficiencies always seem to be gradually eaten away by induced travel. Autonomous vehicles might not overwhelm Boise or Cleveland – unless they become economic dynamos (again) – but they could Houston or LA.

None of the efficiencies the author described are novel – in fact, we’ve been undertaking most of the improvements he cited for centuries already – lighter and smaller cars, better traffic control devices with optimized timing, better parking management, and so on – and we’ll continue to do so. But again, in regions with dynamic economies, these efficiencies will free up capacity that will be eaten up by induced travel.

It *would* be possible to overcome the historical noose of congestion if the spatial efficiencies autonomous cars introduced unfolded extremely rapidly – in less than a decade. That is, the road space they’d free up would increase so quickly that it’d take us years to dilute ourselves further enough to fill up that road space.

However, as I’m sure the author would concede, these tremendous spatial efficiences – the “1000%” increase in road capacity he pondered or even something more modest like 100% – wouldn’t occur overnight, but over a period of decades. It takes a considerable amount of time for enough of the improvements he described to happen at large enough scales for us to see the capacity increases. It takes time to replace traffic lights on a large enough scale to see large-scale improvements, for enough people to progressively purchase lighter and lighter autonomous cars, for new maintenance and operational practices (“convoys” etc.) to replicate themselves at scales large enough to reap the purported capacity increases.

That is, I think that because these improvements and their resulting capacity increases will occur *gradually,* precisely because they’ll occur gradually any modest, gradual, incremental increases in capacity will be eaten away in tandem by modest, gradual, incremental increases in induced travel. Isn’t this already the history of road transportation: from, say, 1880 to 1980 didn’t we increase roadway capacity by many thousands of percent through incremental roadway construction/enlargement and gradual improvement in vehicular and traffic management technologies? Yet in regions with dynamic economies, incremental induced travel kept pace with incremental increases in capacity. Had that increased capacity caused by efficiency flooded those regions in, say, 5 or 10 years, then maybe we would have thought we “out-teched” congestion. But it always catches up with us – at least in any area where even modestly large groups of people congregate!


(Marc and MaxO, if you want to be linked to here, please contact me.)

Are Fully Driverless Vehicles Coming Soon? Doubts, and Smarter Hopes

The endless debate about how fully automated cars would change our cities often starts with the assumption that we will have fully automated cars soon.  We imagine that we’ll all be riding around in totally automated taxis, whose lack of a driver will make them cheap.

This is the essence of the “driverless cars will replace transit” fantasy.  I’ve argued many times that this idea is geometrically incoherent in dense cities, because regardless of automation there isn’t enough room to move people from big transit vehicles into small ones.

But it’s also important to ask:  How soon is this truly driverless vehicle really coming?

Levels of Automation

Here is the standard 1-5 scale, by SAE International, that everybody uses to talk about this.  Level 1 technology is available now, but the kind of automation that totally eliminates a driver, thus transforming the economics of all hired transportation, comes only at Level 5.
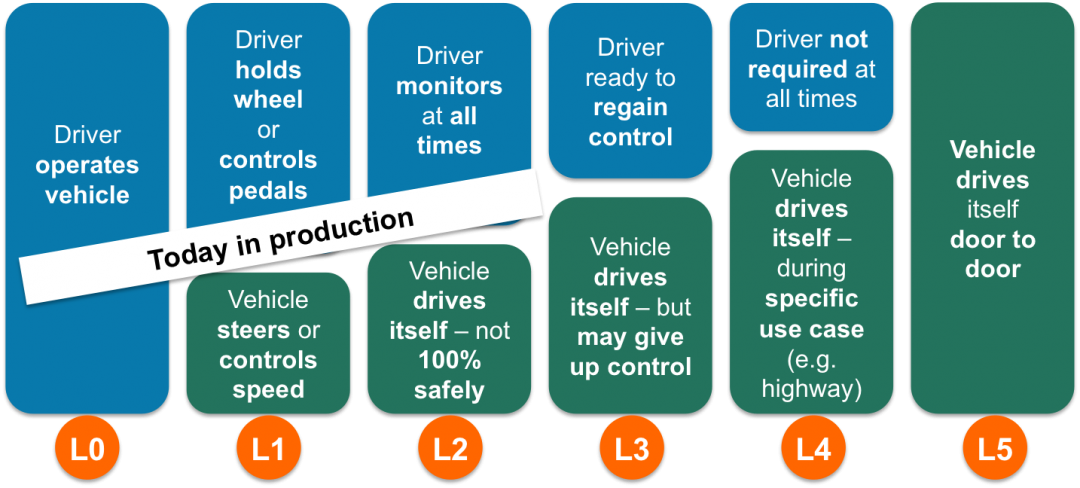
6-levels-of-automated-driving

Six levels of automation. Videantis. http://www.videantis.com/what-are-all-these-automotive-cameras-doing.html

Most experts seem to agree we will soon have Level 2, enhanced driver-assistance that shifts the driver to more of a monitoring role, but that the journey to Level 5, actually eliminating the driver, is a long one that has only begun.

Steven E Shladover, from the PATH program at UC Berkeley, has been thinking about vehicle technology for decades.  In his excellent (and tragically paywalled) piece for Scientific American this June, he noted some of the reasons why full automation is so hard, and requires solving problems that are not just technological.

A fully automated vehicle needs to be able to do the right thing any situation, and handle its own equipment failures.  In big airplanes, this is achieved only through multiple redundant systems that make the product massively expensive.  Nobody knows how to scale an airliner’s level of redundancy to an affordable mass-market vehicle.

Crossing the Ravine of Distraction at Level 3

The biggest barrier to full Level 5 automation may also be a reason to leap to it prematurely.  It’s human reaction time at the intermediate levels of automation.  Shladover:

The prospects for level three automation are clouded, too, because of the very real problem of recapturing the attention, in an emergency, of a driver who has zoned out while watching the scenery go by or, worse, who has fallen asleep. I have heard representatives from some automakers say that this is such a hard problem that they simply will not attempt level three. Outside of traffic jam assistants that take over in stop and go traffic, where speeds are so low that a worst case collision would be a fender bender, it is conceivable that level three automation will never happen.  [Emphasis added.]

Anyone examining their own experience will see that this is a big problem, and that it’s not a technological problem.

To make this more vivid, let’s stop and think what the opposite of automation is.  It’s an old mid-century car, maybe my parents’ 1962 International Scout, a tough precursor to today’s SUVs.  The primitive suspension pounded your body with the textures of the road.  Your hand on the stick-shift felt the movement of the gears.  When something shoved back against your attempt to turn, the steering wheel sent the shove right up your arms.  To stop fast, you had to pound the brakes with your weight.  Nothing pretended to protect you from the weather.   With all this vivid input flowing into you, demanding constant decisions, you would never fall asleep at the wheel, or be tempted to look at the newspaper on your seat.  Driving was hard, but often ecstatic.  When power steering and automatic transmissions came along, my elders agreed that by reducing the level of effort and stimulation, these inventions made driving harder to focus on.

The journey from here to Level 3 looks just like the journey from the Scout to here.  It’s the same straight-line path from vividness toward tedium, from control to passivity.  It ends at a faintly ridiculous extreme: you sit there, unstimulated and with nothing to do, but you must still pay attention.  We could reach a point where the only safe “drivers” are people with years of meditation training, since nothing else prepares you for that situation.  And all that training would be expensive, pushing drivers’ wages up!

At Level 3, Forward or Back?

If the Level 3 problem is as hard as it looks, how will we respond?  Tech-optimists will see this as a reason to rush even faster to Level 5, maybe prematurely.  But many people who get a taste of Level 3 will be keen to stop at Level 2, where they still feel like they’re in control.  Level 3 accidents, caused by human inattention but easily blamed on the technology, would inflame both sides in this debate.

At that point, will the reason to go forward be safety?  We don’t know, because we don’t know what the impact of Level 2 will be on fatality rates.  Maybe they will have improved so drastically that Level 5 doesn’t offer that much more, or at least not enough more to make the public ready to accept the loss of control at that level.

So the other issue will be the liberation of labor, especially professional drivers.  All the dreams of driverless taxis, for example, require getting all the way to Level 5.  Maybe it will happen, starting with fleets, but the question of whether you can jump over the ravine of distraction at Level 3, and land all the way at Level 5, is an open one.

Are we sure driverless vehicles will be cheap and abundant soon?  I have no idea, and nobody else does either, but the path does not look easy.

Automated Transit Is Easier!

So what does this all mean for transit?  You read it here first:  Full automation of transit is much easier than automation of cars. (If it’s impossible, that’s only because driverless cars turn out to be impossible.)  Shladover:

And yet we will see highly automated cars [vehicles?] soon, probably within the coming decade. Nearly every big automaker and many information technology companies are devoting serious resources to level four automation: fully automated driving, restricted to specific environments, that does not rely on a fallible human for backup. When you limit the situations in which automated vehicle systems must operate, you greatly increase their feasibility.   [Emphasis added.]

High-ridership fixed route transit vehicles are perfect examples of this possibility.  They run on pre-set paths in a narrow range of situations.  In fact, the busier they are, the more money we should spend to make these situations narrower: exclusive lanes, automated stopping and fare collection, weather protection technologies, and potentially limits on lateral motion, up to and including rail.  Unlike vehicles that could go anywhere, automated transit vehicles don’t need a map of absolutely everywhere.  All of these things make transit automation easier.  In effect, transit is a case where you can get full automation with Level 4 technology.

I am not making light of the considerable challenge of managing the impact of the transformation of the workforce wrought by automation.  I am very concerned about those impacts.  But the effect of automation on work is an issue in many fields, and when it becomes critical we will find a collective solution.  Smart people are thinking about it.

Takeaways:

  • Full automation of any kind, going anywhere, the goal that replaces most human labor, is quite a ways off and requires overcoming several obstacles that nobody has cracked yet.  It may not be possible.
  • Driving a partially automated vehicle may be harder than driving a vehicle today, because the distraction problem gets worse.  This may increase the skill level of the labor required, and thus the labor cost.
  • But the distraction problem with partial automation may also cause a premature rush to full automation, plus a strong movement to stop at Level 2.
  • Technologically and spatially, high-ridership fixed-route transit is much more easily automated than any other vehicle under discussion today, because it operates in such limited situations.  Fully automated rail transit, in regular service, is over 30 years old.  Driverless buses are under development and present especially promising options especially in fixed rights of way.
  • If driverless transit were ever achieved, the explosive growth in transit abundance would be extraordinary, because labor cost is the main limiting factor today.  This vast increase transit would mean cities could grow denser with less traffic, putting more opportunities within a shorter travel time for everyone.
  • But again, full automation may not be possible.  We don’t know.

I am not sure what we will do about this, apart from telling the “we-should-neglect-transit-because-driverless-cars” people to take a cold shower.  But that’s the terrain ahead, and to me, it looks like transit has a very promising future.

Choosing our words: autonomous cars or autonomous vehicles?

When you talk about autonomous cars (or automated, or self-driving, or driverless cars), do you really mean vehicles? If so, say vehicles.  The word cars (or taxis) explicitly excludes transit (as well as trucks and many other vehicles).

As a transit planner, I’m routinely told that we should neglect our transit systems, and certainly not improve them, because transit will soon be made obsolete by “autonomous cars.”  There are very low density places where this is true, but it is geometrically impossible for dense cities, because there is simply not room to move everyone out of big transit vehicles into the tiny ones that the word “cars” implies.

However, the fantasy of cars replacing big transit vehicles can lead to serious dystopian outcomes, including higher Vehicle Miles Traveled, higher emissions, and higher exclusion of disadvantaged groups from opportunity.  The fantasy is already encouraging neglect of transit systems and opposition to efforts to improve them, which is having all the negative impacts listed above,  today.

None of these problems arise if the tech proponents would consistently speak of “autonomous vehicles.”  In that case, the notion of autonomous vehicles replacing transit wouldn’t even arise, because it’s obvious that transit is made of vehicles too, and that the automation of transit vehicles would be part of any long-term automation project.

When I press an autonomous-car advocate on this point, they almost always say that of course autonomous vehicles will come in all sizes, including transit vehicle, etc.  But they keep saying autonomous cars, which implies the opposite.

Remember, many people hate transit, love cars, and are generally OK with all the outcomes of mandatory car dependence, especially sprawl.  These people love to hear that autonomous cars will destroy transit.

But if you talk about autonomous vehicles, you can promote autonomous technology without sounding like you’re advocating cars over transit, with all the problems for big cities that this implies.  Why not do that?  You’ll provoke less blowback from urbanists, and have more friends.

Moscow: Reinventing Surface Transit in a European Urban Core

img_9120-jpg-jpg

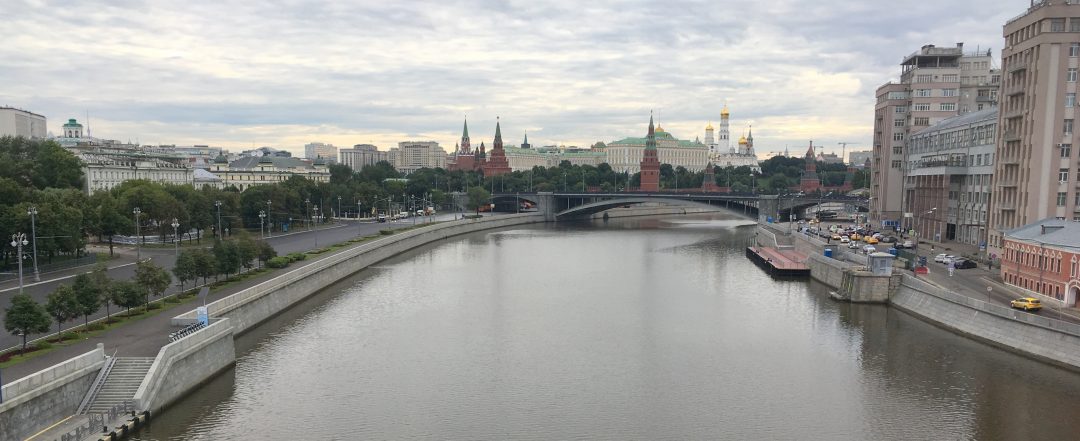
Earlier this year, the Moscow Department of Transportation asked us to help rethink the bus network in the innermost part of the city, an area about 3 km in radius centered on Red Square and the Kremlin.   The first phase of this project just went into operation, so this is a good time to share some of the details of why and how a bus network redesign of this magnitude happens.

Our work was a lively collaboration with DoT staff, local consultants at Mobility in Chain (MIC) and the excellent Moscow-based geographic analysts at Urbica.  As with our recent work in Yekaterinburg, I worked with local experts and DoT staff in an intensive multi-day workshop to hammer out the ideas.  We also helped with some of the analysis and storytelling, and developed the main ideas of the map designs shown here.

Buses Matter in Moscow

You may be thinking: “Moscow has an extensive, highly useful Metro network. Is surface transit even a big deal?”  Yes.  Even in Paris, with the world’s densest metro network, an intensive subway system doesn’t eliminate the need for an excellent and celebrated surface transit network.  Compared to Paris, Moscow stations are spaced more widely, and they are also famously deep, which means longer walks and escalator rides. It takes at least five minutes to move between the surface and a metro platform, or between one platform and another in a transfer station.  And if you’re making a 10-15 minute trip within the core, five minutes is a very long time. Together, these factors make trips using surface modes attractive, provided that the bus and tram network is designed to take people to where they need to go.

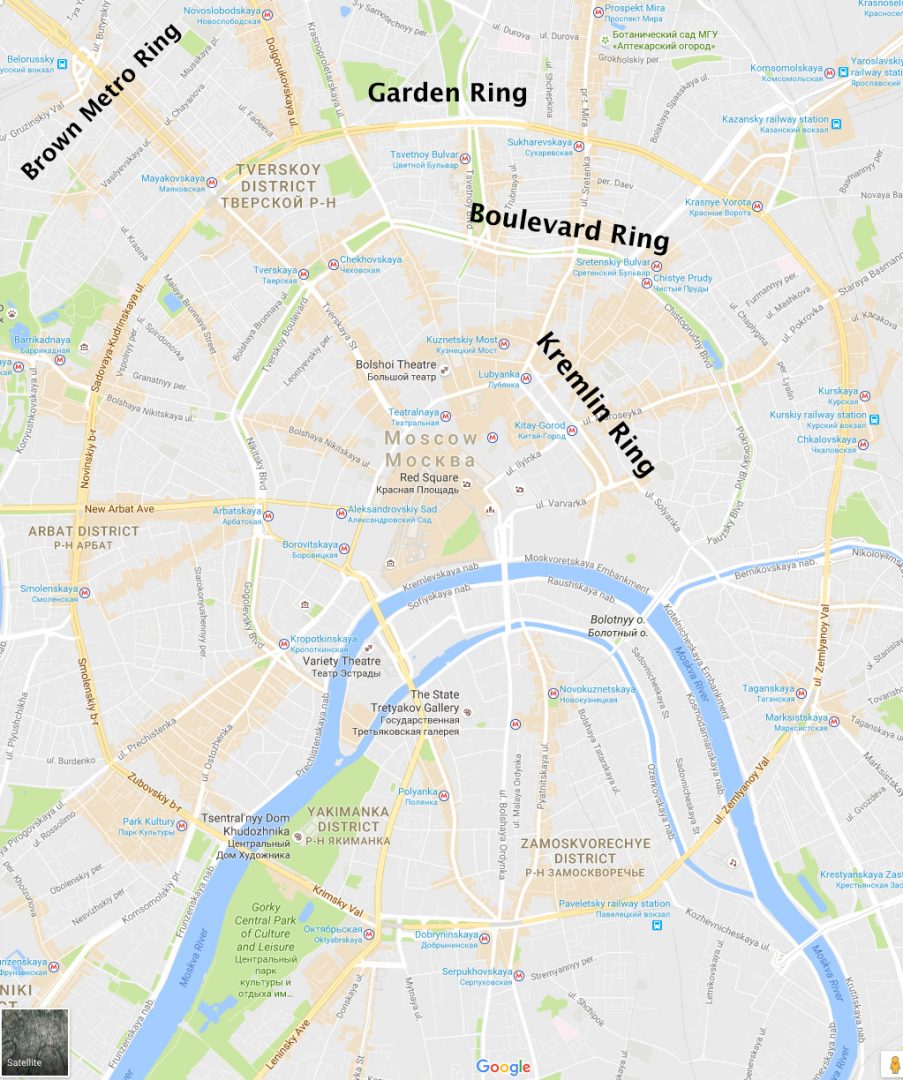
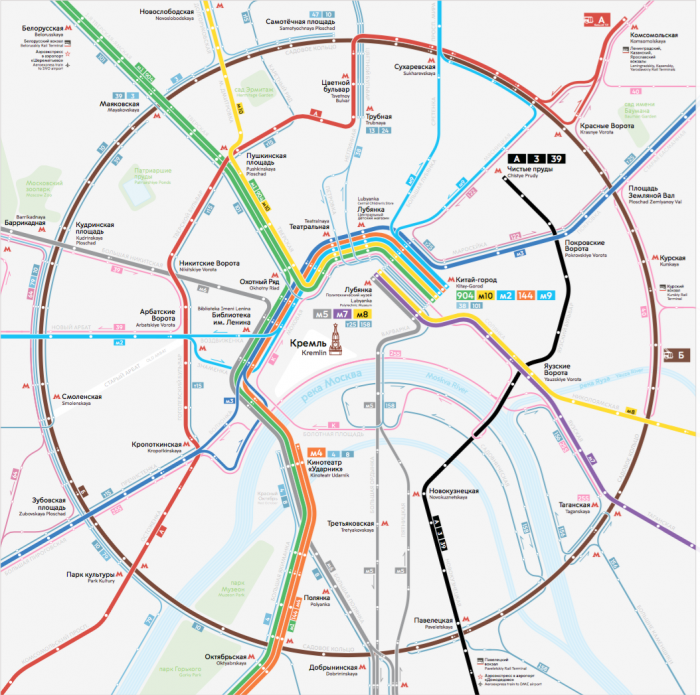
Let’s get oriented.  Of all the world’s major cities, Moscow comes closest to being an absolutely regular spiderweb or polar grid.  Major corridors are either concentric circles or straight radial links between these circles.  This is true of the whole urban region, but for now let’s zoom into the center:

moscow-structure-png-jpg

From inside to outside, we have:

  • The Kremlin Ring, which orbits the Kremlin, Red Square, and world-famous citadels of religion and commerce.  It’s a wide, fast street and a key stretch of it is one-way clockwise.
  • The Boulevard Ring, consisting mostly of beautiful European-style boulevards with grand parks in the median.
  • The Garden Ring, a very wide and fast high-speed arterial for cars, featuring many grade separations and a generally awful pedestrian environment. Memory crutch: If it has gardens, it’s not the Garden Ring.
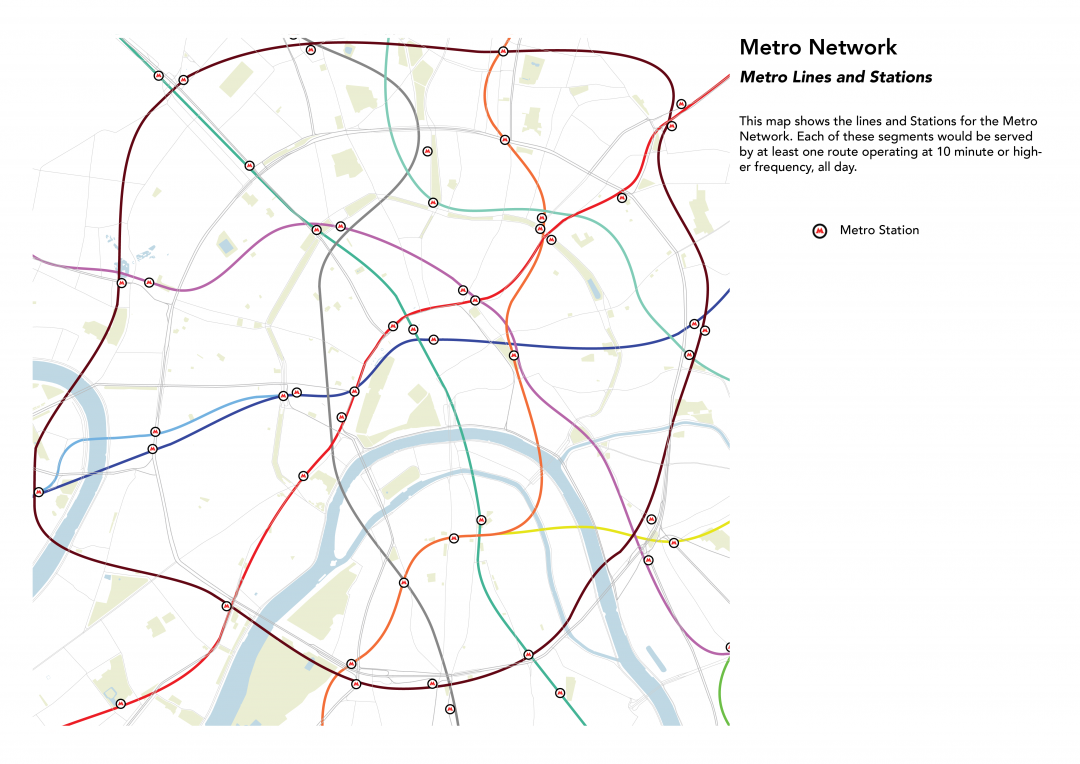
  • The Brown Metro Ring — a metro but not a street.  It is outside the Garden Ring on the north and west but follows the Garden Ring in the south and east.  This is the ring of intercity rail stations — just like Paris and London have — and it’s only orbital line in an otherwise radial metro network.

metro-lines-and-stations

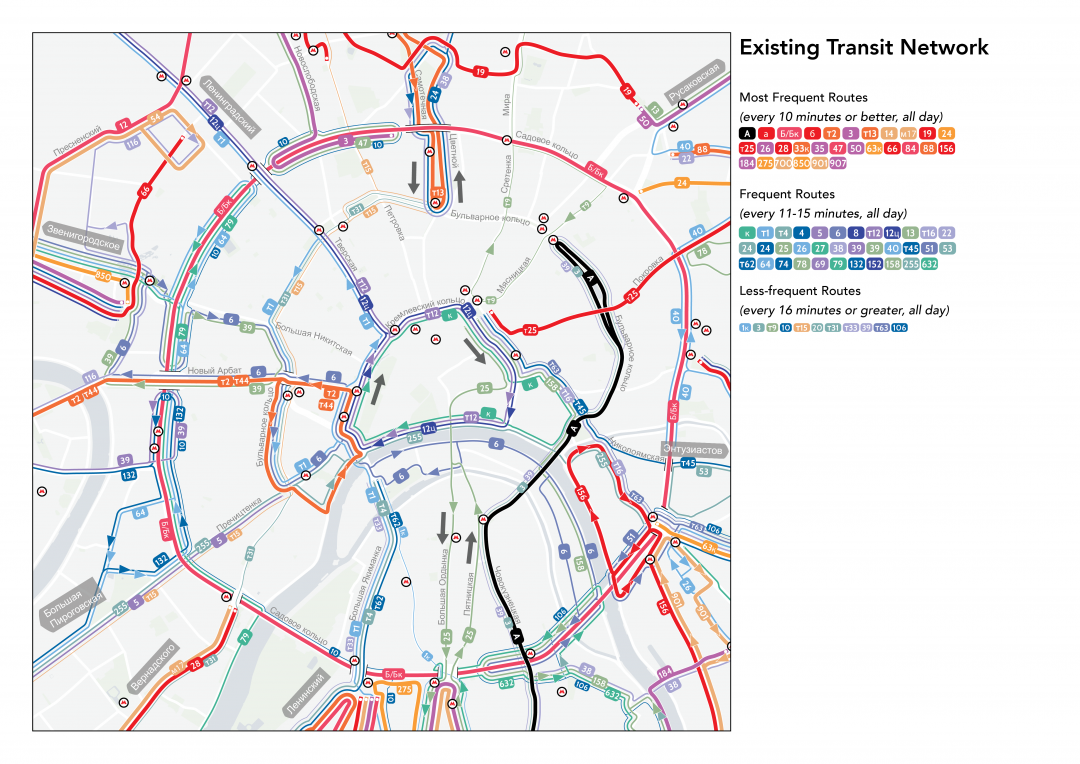
And here’s the bus network as it was until Saturday, October 8.  (Download the fullsize PNG for more detail.)  Wide lines in hot colors mean very high frequency.  The black line is a frequent tram.

existing_system_map

If you look closely you’ll notice several problems, apart from the staggering complexity.  They all arise from the design of major streets.

Taming the Moscow Arterial

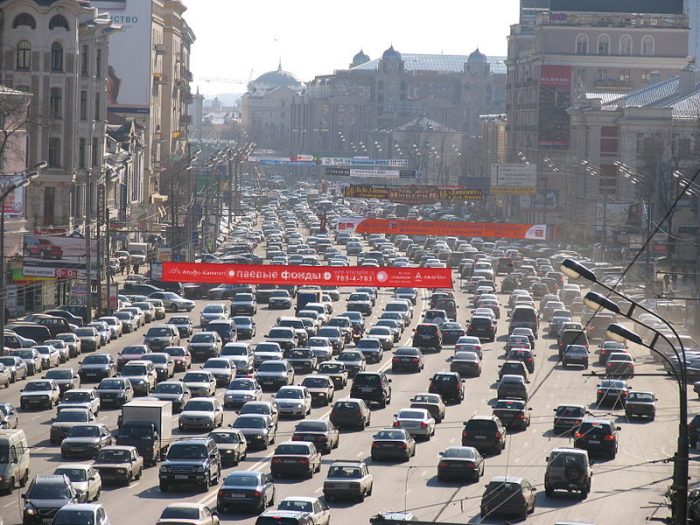
In its structure, inner Moscow is a mostly 19th century European city — reminiscent in many ways of Paris, Vienna, or Prague.  It’s beautiful and very walkable, except for the major arterial streets.  This is an old photo of the Garden Ring, and most of the ring still looks like this.

Garden Ring on the west side. Photo by https://commons.wikimedia.org/wiki/User:Strober

Garden Ring on the NW side. Old photo but typical of how most of the street looks today. Photo by https://commons.wikimedia.org/wiki/User:Strober


For years Moscow expanded and redesigned its major streets with the sole objective of moving as much car traffic as possible, at as high a speed as possible.  (It’s routine to see cars going 80 km/hr [50 mi/hr] or more on these streets.)  This goal of car traffic flow caused several decisions to be made that were bad for surface transit.

  • Grade separations: The Garden Ring has numerous grade-separations with intersecting roads.  These grade separations prevent transit on one street from stopping anywhere near transit stops on the intersecting street.  Sometimes your bus will miss a Metro station because it’s flying over or under it, unable to stop nearby.
  • Underpassages instead of crosswalks.   Many of the wide, fast arterials have no crosswalks.  Instead, there are occasional underpasses or bridges for pedestrians, and Metro stations also serve this purpose.  This means the two sides of one of these streets are very far apart, which means the two directions of transit service are not always serving the same place.
  • Forced Turns.  As arterials were expanded and sped up, secondary collector streets — often walkable used by transit — were turned into “right in, right out” where they touch these arterials.  This disrupted many logical bus routes that formerly ran straight across these intersections.  Along the Garden Ring in the map above you’ll notice lots of local routes making U-turns and bizarre looping patterns.  These are mandated by the forced turns.
  • Limited Turns and One-Way Streets.  As we see worldwide, when the goal is to flush cars through a city, you’ll see many one-way streets and restrictions on cross-traffic turns (i.e. left turns if you drive on the right as in Russia, right turns if you drive on the left).  This forces the two directions of a transit line apart — often very far apart so that they no longer serve the same places.  For example, try tracing route T1 (pale blue) from where it enters the map in the northwest.  It ends up serving completely different places in the two directions, all the result of one-way streets and prohibited turns.
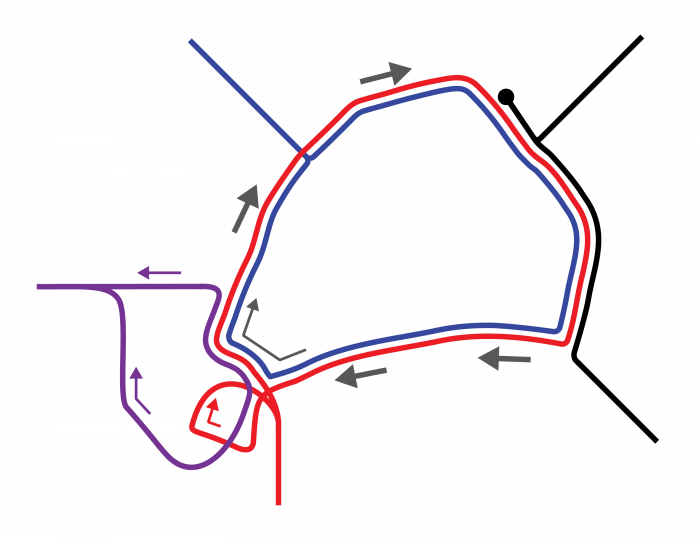
  • One-way loops.  Very few people want to travel in circles, but that’s what the buses have to do.  At the very center of Moscow, the Kremlin Ring flows clockwise-only around the innermost core.   This is the biggest obstacle to transit of all.  There are no stops on the south side of the ring, which is essentially a freeway.  So a two-way line flowing across this area would be able to serve the core in the eastbound direction only.  Westbound it would fly nonstop past the core — missing all its major destinations and metro connections.  This is why almost all existing routes have to terminate in the core rather than flow across.  The entire structure of the inner city bus network was dictated by the one-way traffic pattern of the Kremlin Ring.  Indeed, this diagram shows pretty much all of the things that a bus could do at the Kremlin Ring, which is not much:

kremlinringdiagram

Fortunately, the Kremlin Ring has just been fixed.  A continuous bus lane has been built allowing buses to run two-way across all parts of the Ring.  Various limited-turn and forced-turn problems are also being solved through infrastructure projects, over the next few years.  (Even the Garden Ring is starting to be civilized, with help from our colleagues at Mobility in Chain.)

This changes everything, and allows for a totally new network that will be vastly more useful.

The New October 2016 Network

The new network, implemented on Saturday, October 8, looks like this.  For greater detail, download the file here.

moscow-new-network-inner-slice

At this early stage, most lines that could be connected across the core haven’t been connected yet.  Note the dark blue line from southwest to northeast, which is the only new one.  But the network has been reorganized so that it all flows two-way through the core of Moscow, serving the same places in both directions.  This is already a huge improvement.  Note the vast increase in the number of wide lines — meaning very high frequency.  (They are all colors in this map but only hot colors in the existing system map above.)

As always when you’re trying to expand liberty and opportunity for most people, the result is fewer routes running more frequently in simpler, straighter, two-way patterns.

And That’s Not All …

We got to this network by first designing a network for 2018, then backing up to identify the things we could implement immediately.  That means there’s more to come:  The next phase combines these routes into more patterns that run right across the city.  That means even more frequent and direct routes, even simpler routings, even better access across this dense and diverse urban core, all while reducing the actual volume of buses along the Kremlin Ring and vastly reducing the number of buses that need to park there at the end of the line.  We look forward to being able to show those maps soon!


Useful New Term: Captive Driver

The insulting and generally inaccurate term captive rider — for someone who supposedly has no choice but to use transit — still shows up in transit studies now and then, but it seems to be receding.  I’ve certainly tried to do my part to drive the stake into it.

But sometimes the best way to undermine a misleading or prejudicial term is to promote an analogous term.  So I loved this exchange:


Yes, much of my life I’ve been a captive driver, in that I’ve been forced to live and work in landscapes where there are no reasonable choices for how to get around.

One of the worst things about being a captive driver is having to drive when you know you really shouldn’t. I’m careful with alcohol, but there are times when I’m just tired, or irritable, and there’s no choice but to drive.

I know several older people who are captive drivers. They know they probably should stop driving soon, but their happiness and even sanity may require them to stay in the house and garden that they’ve known for decades, even though that’s a place where transit isn’t viable. (And they often lack the smartphone skills to use Uber or Lyft, or have disabilities that those companies can’t handle.)

Captive drivers are everywhere. Will they rise up to shake off their chains?