Here is a little deep dive into how bus network designers think, with an example from very close to (my) home.
Over the past year, our firm has been working with the Portland area transit agency, TriMet, on the “Forward Together” project, which developed a plan for the next several years of bus service improvements. (The plan will eventually represent about 10% more service than the agency ran in 2019, but TriMet is still recovering from post-Covid workforce shortages, so it can’t do everything at once.) The plan went through major public outreach and was adopted earlier this year, and a few items have already been implemented. Now, (August 27, 2023) they are rolling out what will probably be the most controversial part of the package, a series of big changes in Portland’s southwest hills.
The Forward Together plan was motivated by twin goals of ridership and equity. In general, the plan retains and expands services that either:
The plan includes a major expansion of the Frequent Network in high demand areas, and new local routes in underserved suburban areas with large low-income populations. Where TriMet was running services that are justified neither by ridership nor by equity, the plan reduces or even eliminates those services. That’s because even though the total service budget is growing, TriMet is also trying to align its services with current goals, rather than just continuing to run services designed around the goals of the past. I wouldn’t recommend this in every city, but this is the answer to the specific problem posed by TriMet’s limited resources and the goals they have adopted.
Let me give you a quick tour of SW Portland, using TriMet’s map of the old (2022) network.
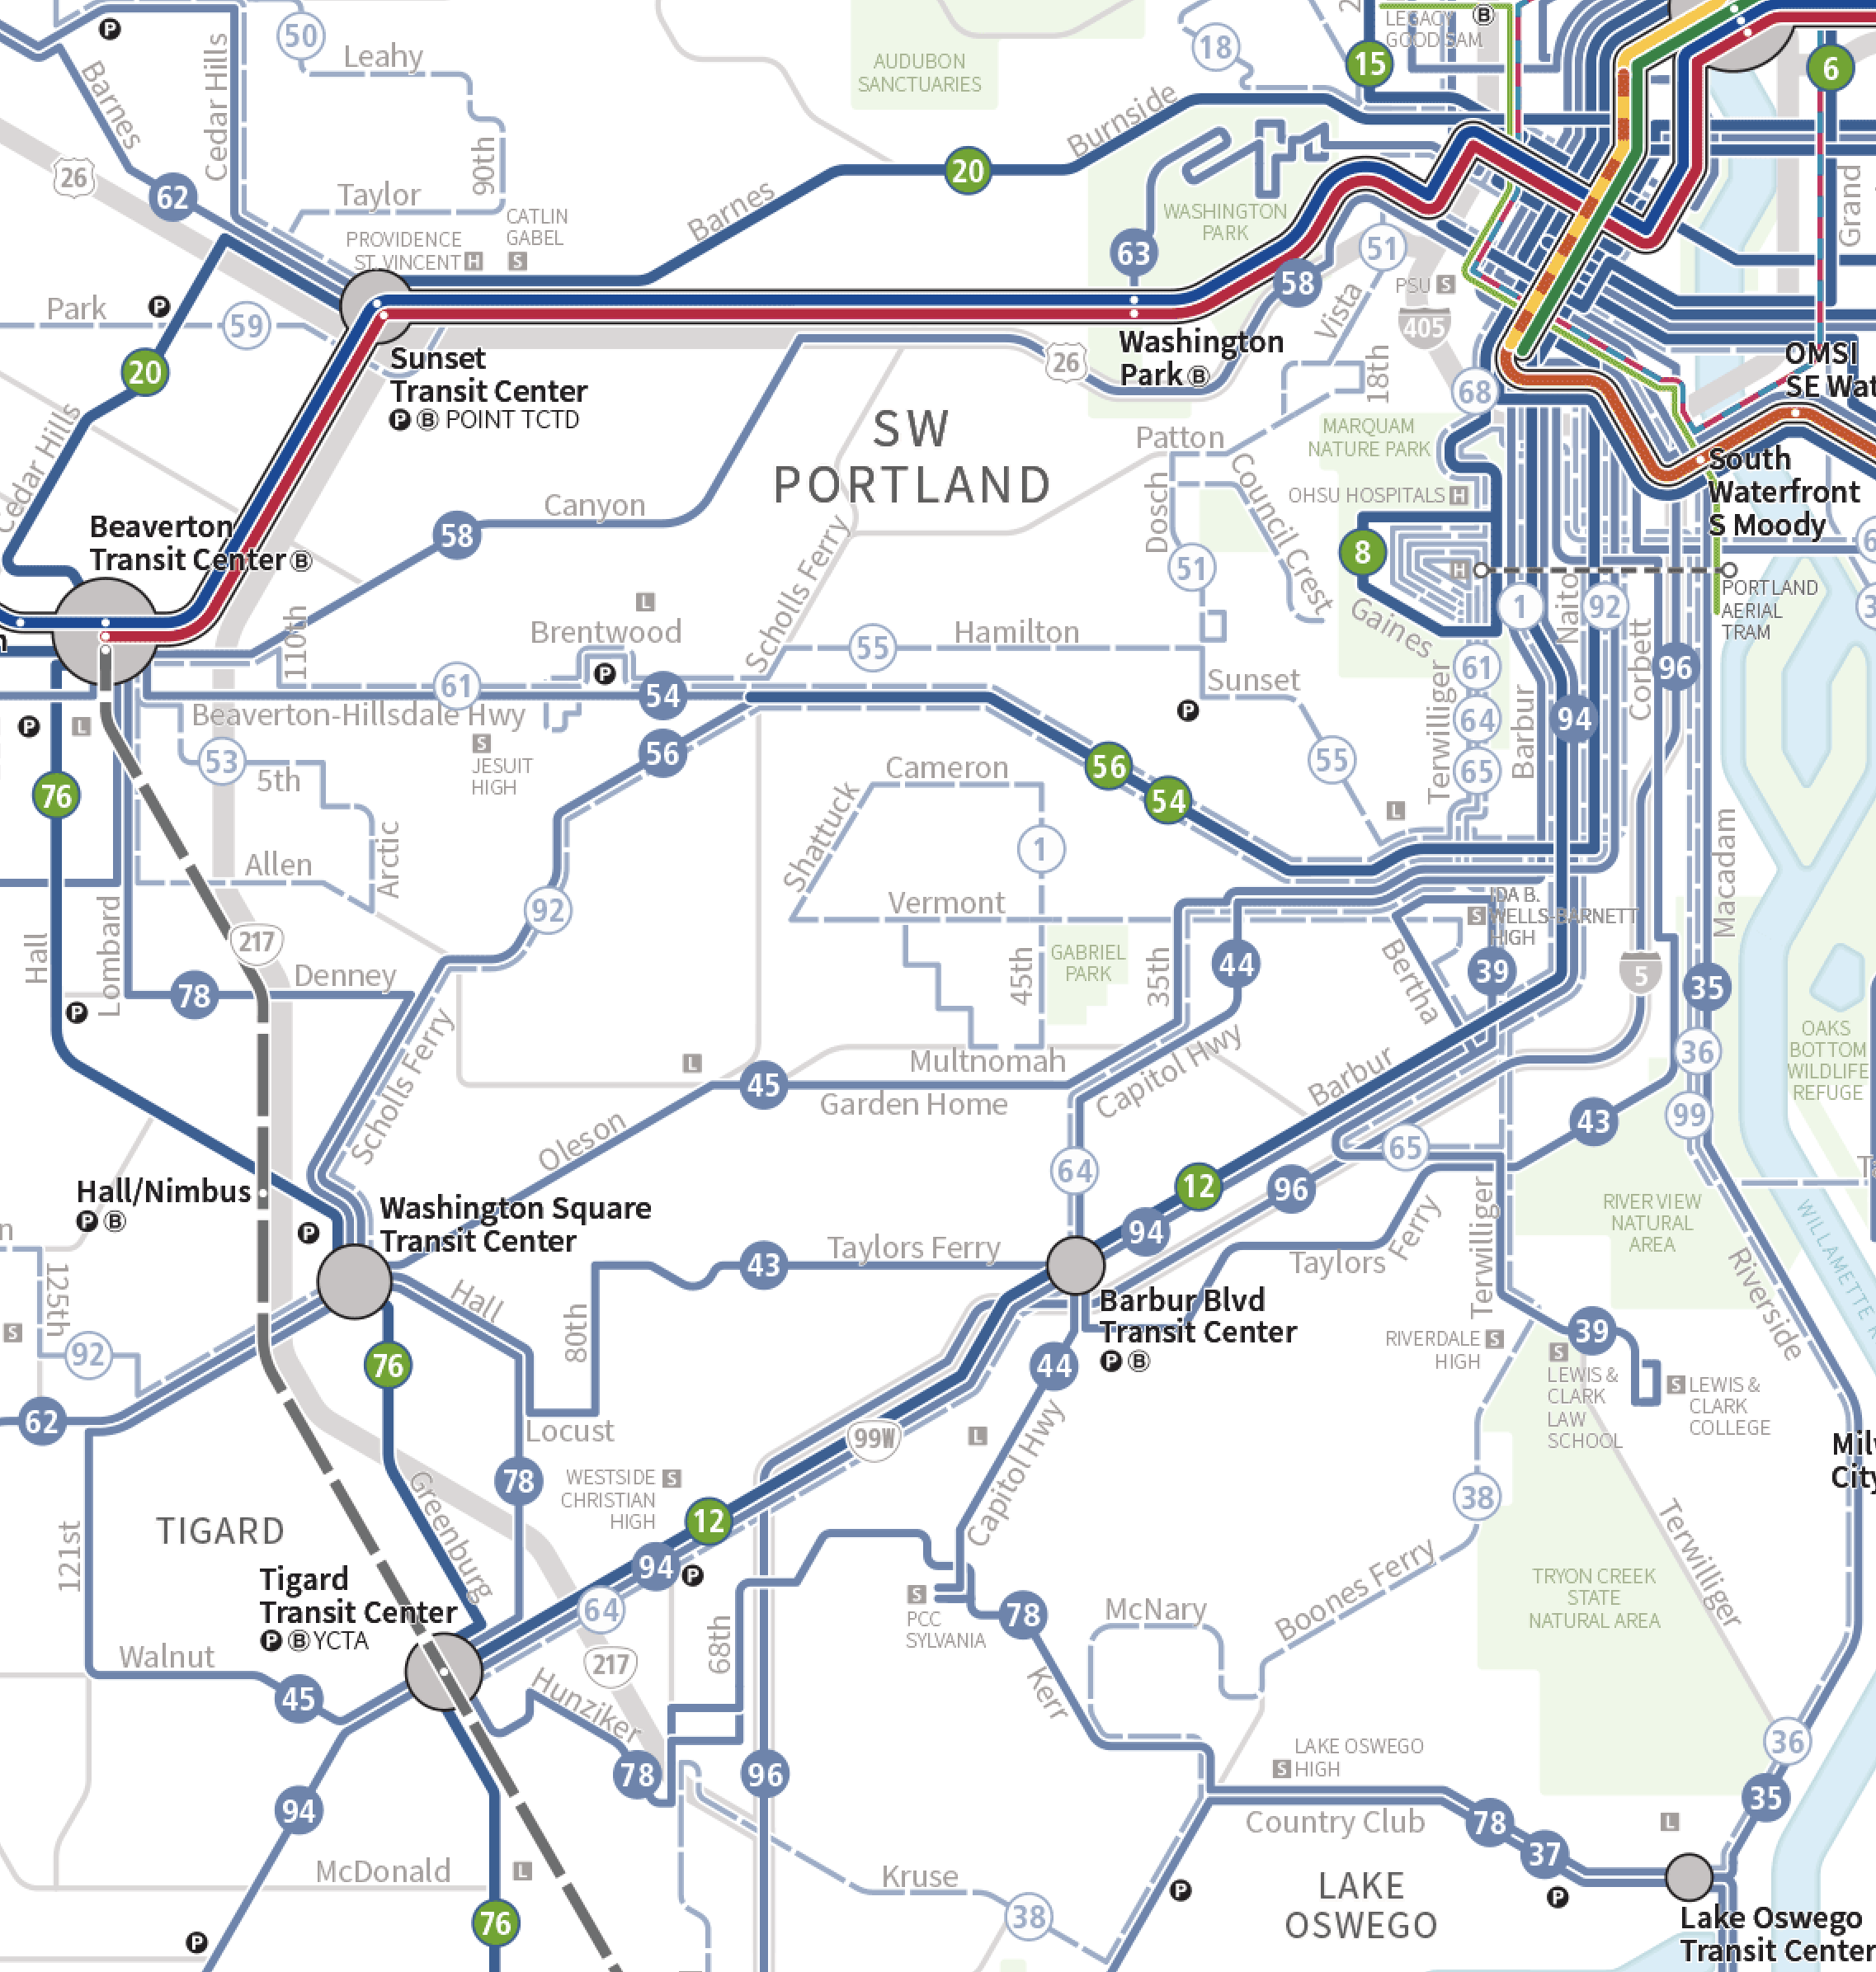
TriMet network in 2022, before the changes. Green number shields and wider lines denote high frequency. Dashed lines run only briefly (mostly rush hour only). Map by TriMet.
Downtown Portland is in the NE corner of the map, where all of the colorful light rail lines converge. Immediately west of downtown is a bank of steep hills, running north-south. Just southwest of downtown, where you see Line 8 ending in a loop, is a huge hilltop complex of medical destinations, including the Veterans Hospital and the old part of the Oregon Health and Science University campus. This area, called Marquam Hill, is one of Portland’s biggest transit destinations outside of downtown.
Along the west and south edges of the map are the inner-ring suburban cities of Beaverton, Tigard, and Lake Oswego along with the Washington Square Mall. That ring, linked by orbital lines 76 and 78, is typical older suburban fabric with some dense centers but heavy car orientation.
TriMet’s mapping style makes all the bus routes blue but distinguishes the Frequent Service Network (every 15 minutes all day) with a slightly wider line and a green number sheld. You can see that there are two big frequent corridors in SW Portland: 54 along Beaverton-Hillsdale Hwy and, further south, the 12 along Barbur Blvd. Except for those two corridors, inner SW Portland (excluding the inner-ring suburbs) is mostly low-density and relatively affluent.
With a focus on ridership and equity, and the drop in downtown commuting due to ongoing work-from-home, this area just had to be rethought. Here is the new network as of August 27, 2023:
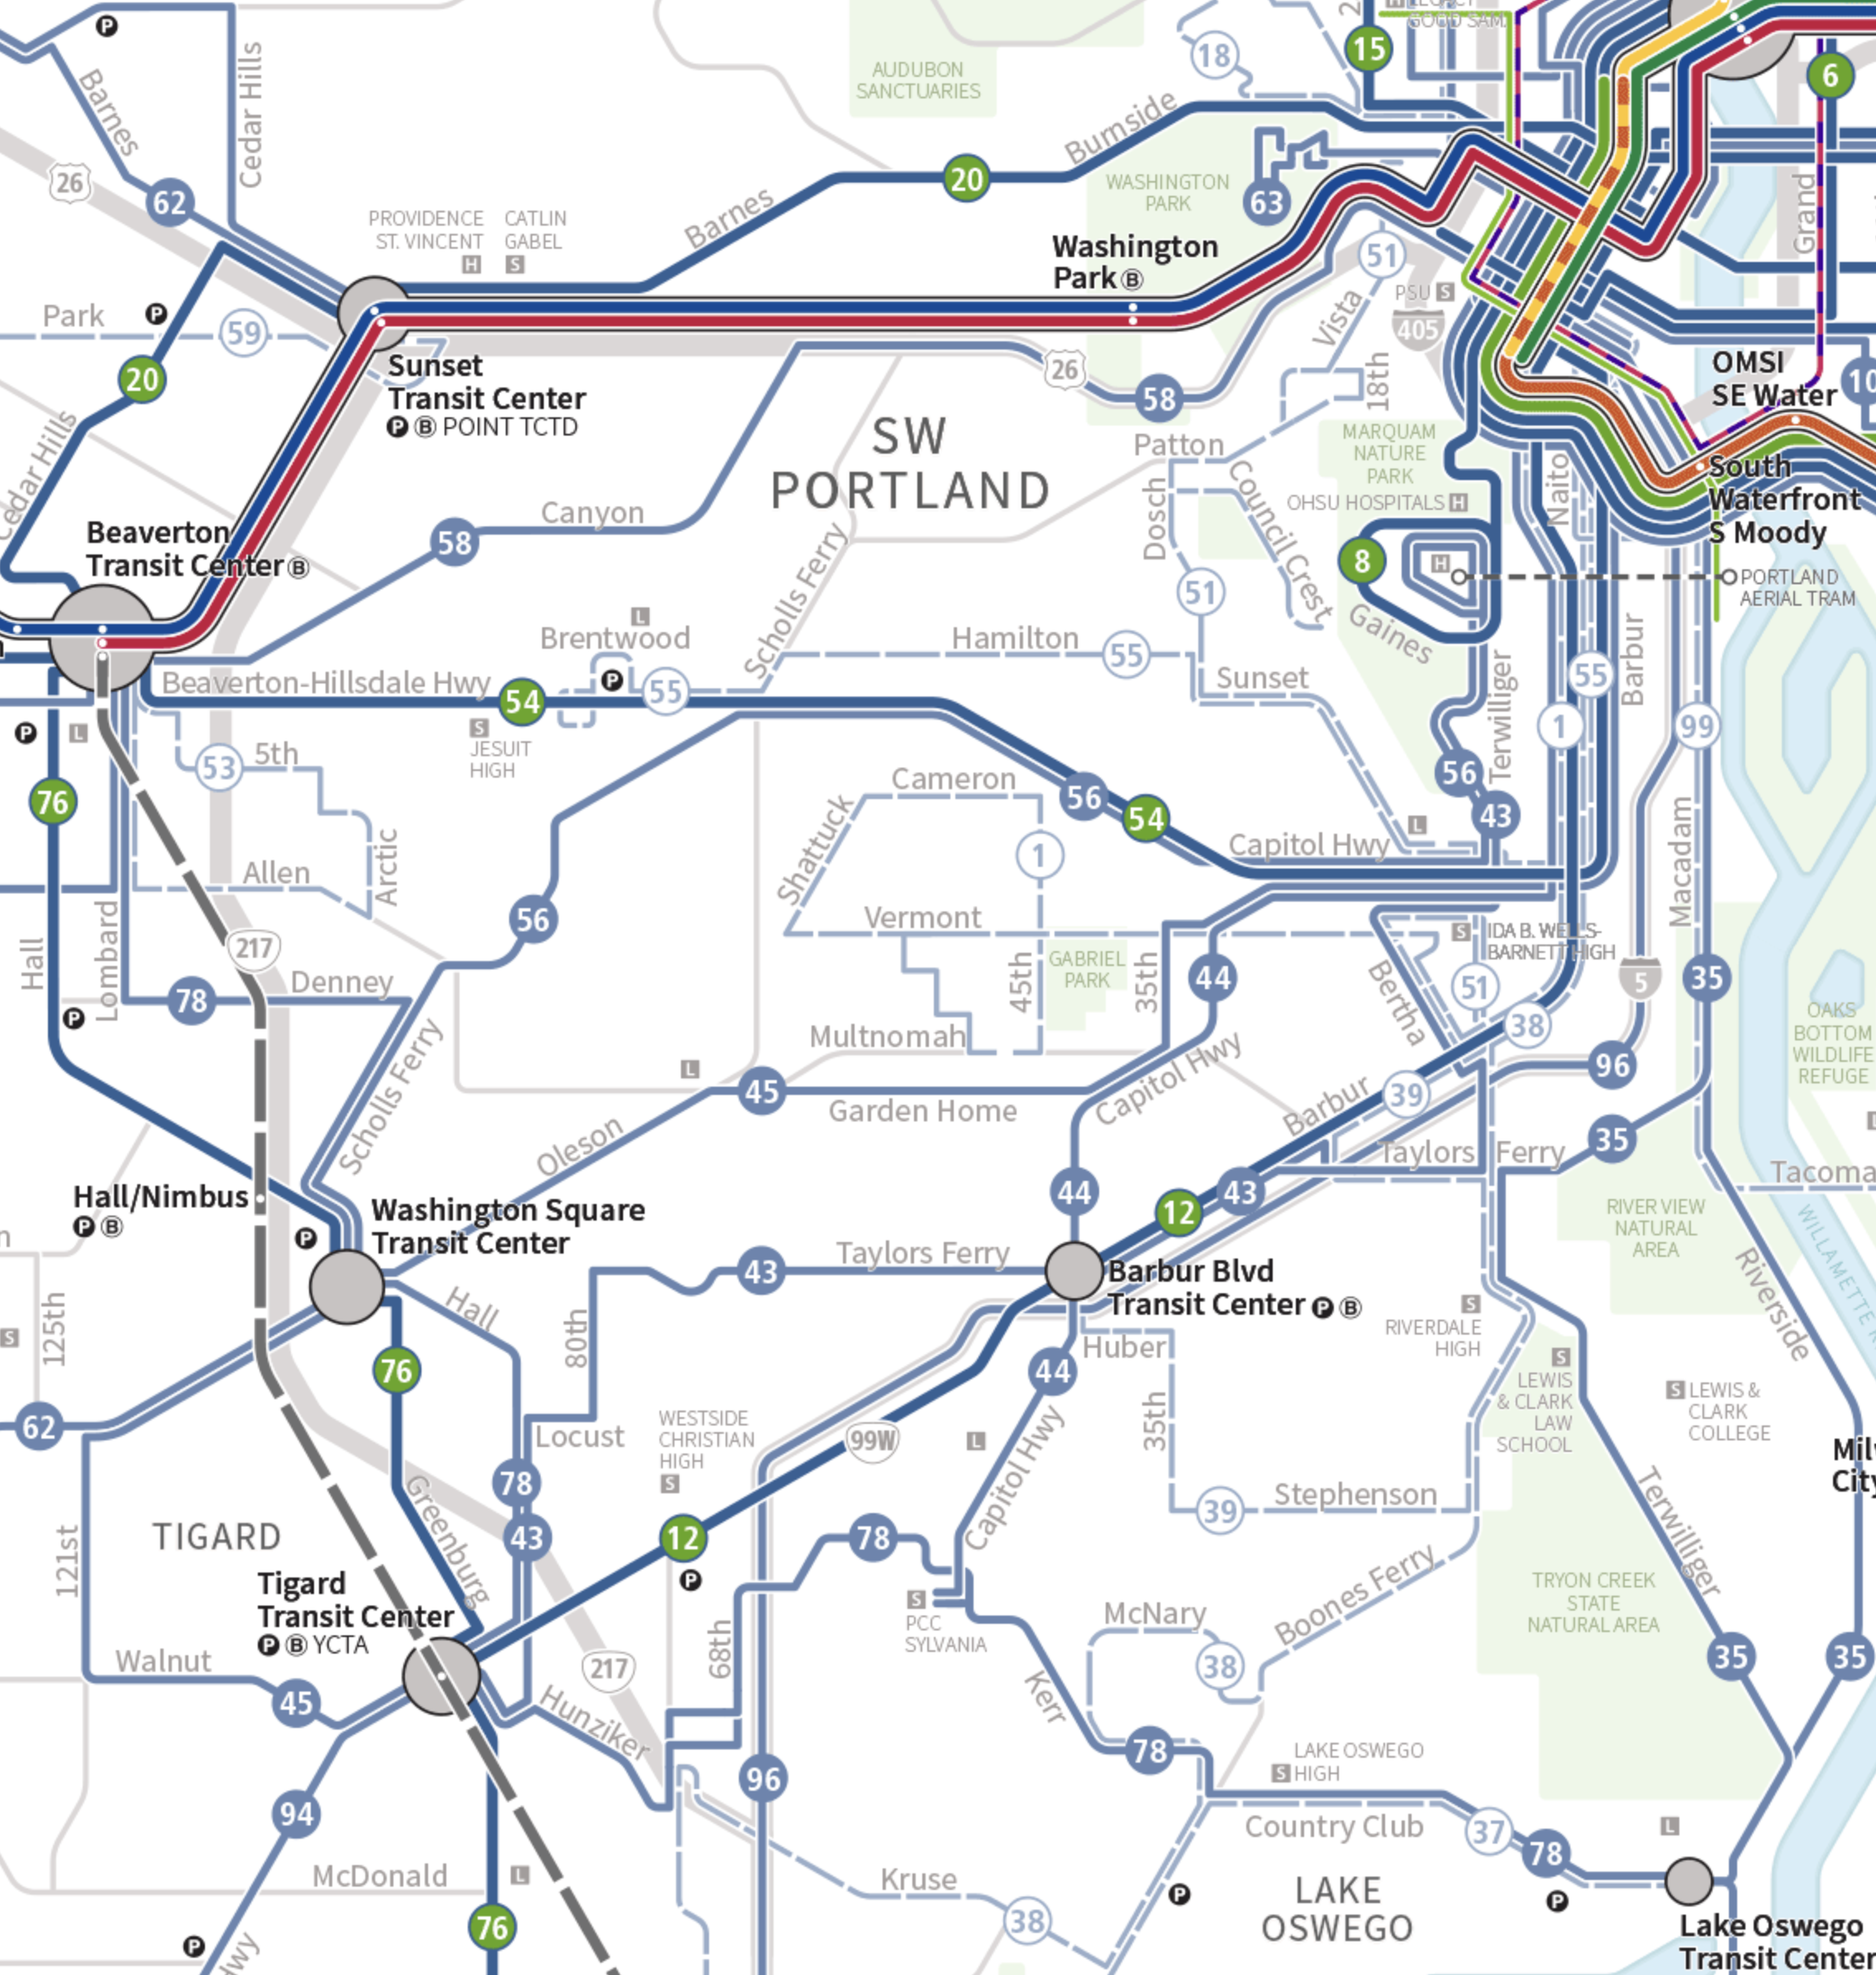
New TriMet network, same color scheme as the map above. Map by TriMet.
As I mentioned, the plan does delete some services that meet neither ridership nor equity goals, mostly all-day local routes in affluent low-density areas that had little ridership except at school times. Some of these are reduced to school-hour trips only, and a few, such as the 50 in the NW corner of the map, are dropped entirely.
In addition, this redesign seeks ridership and equity with two other big moves:
- Shift in focus from peak to all day.
- Shift in focus from office commute destinations to destinations of diverse workers and visitors.
The old network also had a number of services geared to bringing office workers downtown. As in most US cities, there are fewer of these commuters than there were, and like many agencies, TriMet has heard that it needed to provide better service to a more diverse audience, not just office workers but also everyone else traveling all the time for all kinds of purposes. So some specialized downtown-oriented services were removed. In the old network, for example, Line 94 in the southwest corner of the map approached from suburbs beyond Tigard and went all the way into downtown duplicating Line 12. That was no longer justifiable, so in the new network those riders will need to use Line 12 to complete their trips.
But the biggest and most complicated reworking, encompassing all of these issues, happened at Marquam Hill. At Portland’s largest medical destination, the network had become too focused on rush hour, even though medical workers and patients come and go all day.
The hill has long had Line 8, a Frequent Service bus to downtown, and it also has a cute aerial tram to another medical campus nearby. It also had a big network of rush hour express routes from all directions, numbered in the 60s. These routes duplicated all-day services and mostly helped people avoid transferring. That can be justified only if the buses were full, and they no longer were. They ran only at rush hour, which meant they were not useful to many of the lower-income people working shifts all around the clock at the hospitals.
We needed to rework this to remove some of the duplicative rush hour service, and to provide a more useful all-day pattern of service from the south. In the old network, you could get to Marquam Hill from the south only at rush hour. To do this, we revised two of the lower-ridership southwest lines (43 and 56) so that instead of going downtown, they’ll go to Marquam Hill. Where they cross Line 54 in the Hillsdale district, just south of Marquam Hill, people coming off of outer part of these lines will need to transfer if they are going downtown, but people from all over the southwest will be able to use these lines to get to Marquam Hill much more directly.
This is an inconvenience to some existing downtown riders, so we selected routes where that would affect as few people as possible. We chose Line 56 for this role because much of this line duplicates the Frequent Line 54, which is being upgraded to be Frequent all the way to Beaverton. The segment along Beaverton Hillsdale Highway served by both 54 and 56 is where most of Line 56’s ridership is. Only riders from the Scholls Ferry Road segment of 56 will need to transfer to reach downtown, and this is not a high-demand area. Meanwhile, the segment of Beavertion-Hillsdale Highway where 54 and 56 run together has many low-income apartment areas where people depend on transit. Instead of giving them duplicative routes to downtown, the new arrangement gives them direct Frequent service to downtown (54) and a direct bus to Marquam Hill. There’s no avoiding some duplication here, but this change makes it less wasteful and more useful.
As for Line 43, this issue is rich with memories, as I lived near the intersection of Terwilliger & Taylor’s Ferry as a teenager. I was at TriMet as a teenage intern when the current shape of the line was designed, and while I used it I knew it would always be a poor performer. Much of the line is close to the more frequent Line 12 on Barbur, and if you are west of where the two lines cross, the 43 is so slow to downtown that it makes sense to transfer to the 12 for a faster trip. That’s one reason why we felt that only a small area (between Barbur Blvd. Transit Center and Macadam Ave) would be affected if we reoriented this route to Marquam Hill, an area that had neither high ridership nor a high priority on equity grounds. (It does have one business district, which we served another way; read on.)
Just south of there, the plan removes Line 39 from Lewis & Clark College, prompting the biggest outcry in the public outreach. Lewis & Clark is a liberal arts college located on what is effectively a cul-de-sac for transit.[1] It’s not on the way to any other destinations, so it has to justify its service all by itself. Ridership was poor, and the campus was running its own shuttles to downtown. The final design here divides Line 35, which runs along Macadam Avenue just west of the river, and sends half the service via Terwilliger & Taylor’s Ferry — not directly to Lewis & Clark’s front door anymore, but within a short walk. This change restored direct all-day downtown service from the business district at Terwilliger & Taylor’s Ferry, which was losing it with the removal of Line 43. I’m normally very resistant to this kind of splitting of service because it reduces frequency. Here, however, it was the right solution because the segment of Riverside Drive that loses half of its Line 35 service is very low-density, very affluent, and has almost no ridership.
There’s a nice side effect of this change: new all-day service to the main gate of Tryon Creek State Natural Area, one of Portland’s most spectacular wilderness parks. A great new opportunity for people to get out into nature on transit.
You can explore the whole plan, and the justification for each part of it, in our Forward Together final report, which is online. There you’ll find both an explanation of each change, and also a description of the how the plan was revised in response to public outreach. Not everyone will like these changes, but they will help TriMet create a more efficient network that’s useful to more people, and more people who really need it.
[1] The neighborhood beyond Lewis & Clark, called Dunthorpe, is very, very low-density and affluent. Before the big redesigns of 1979-82 it had its own bus route from downtown, evidence of how completely oriented toward coverage (rather than ridership) the system was in those days. Today, nobody would think of running buses into Dunthorpe, probably least of all the fortunate folks who live there.
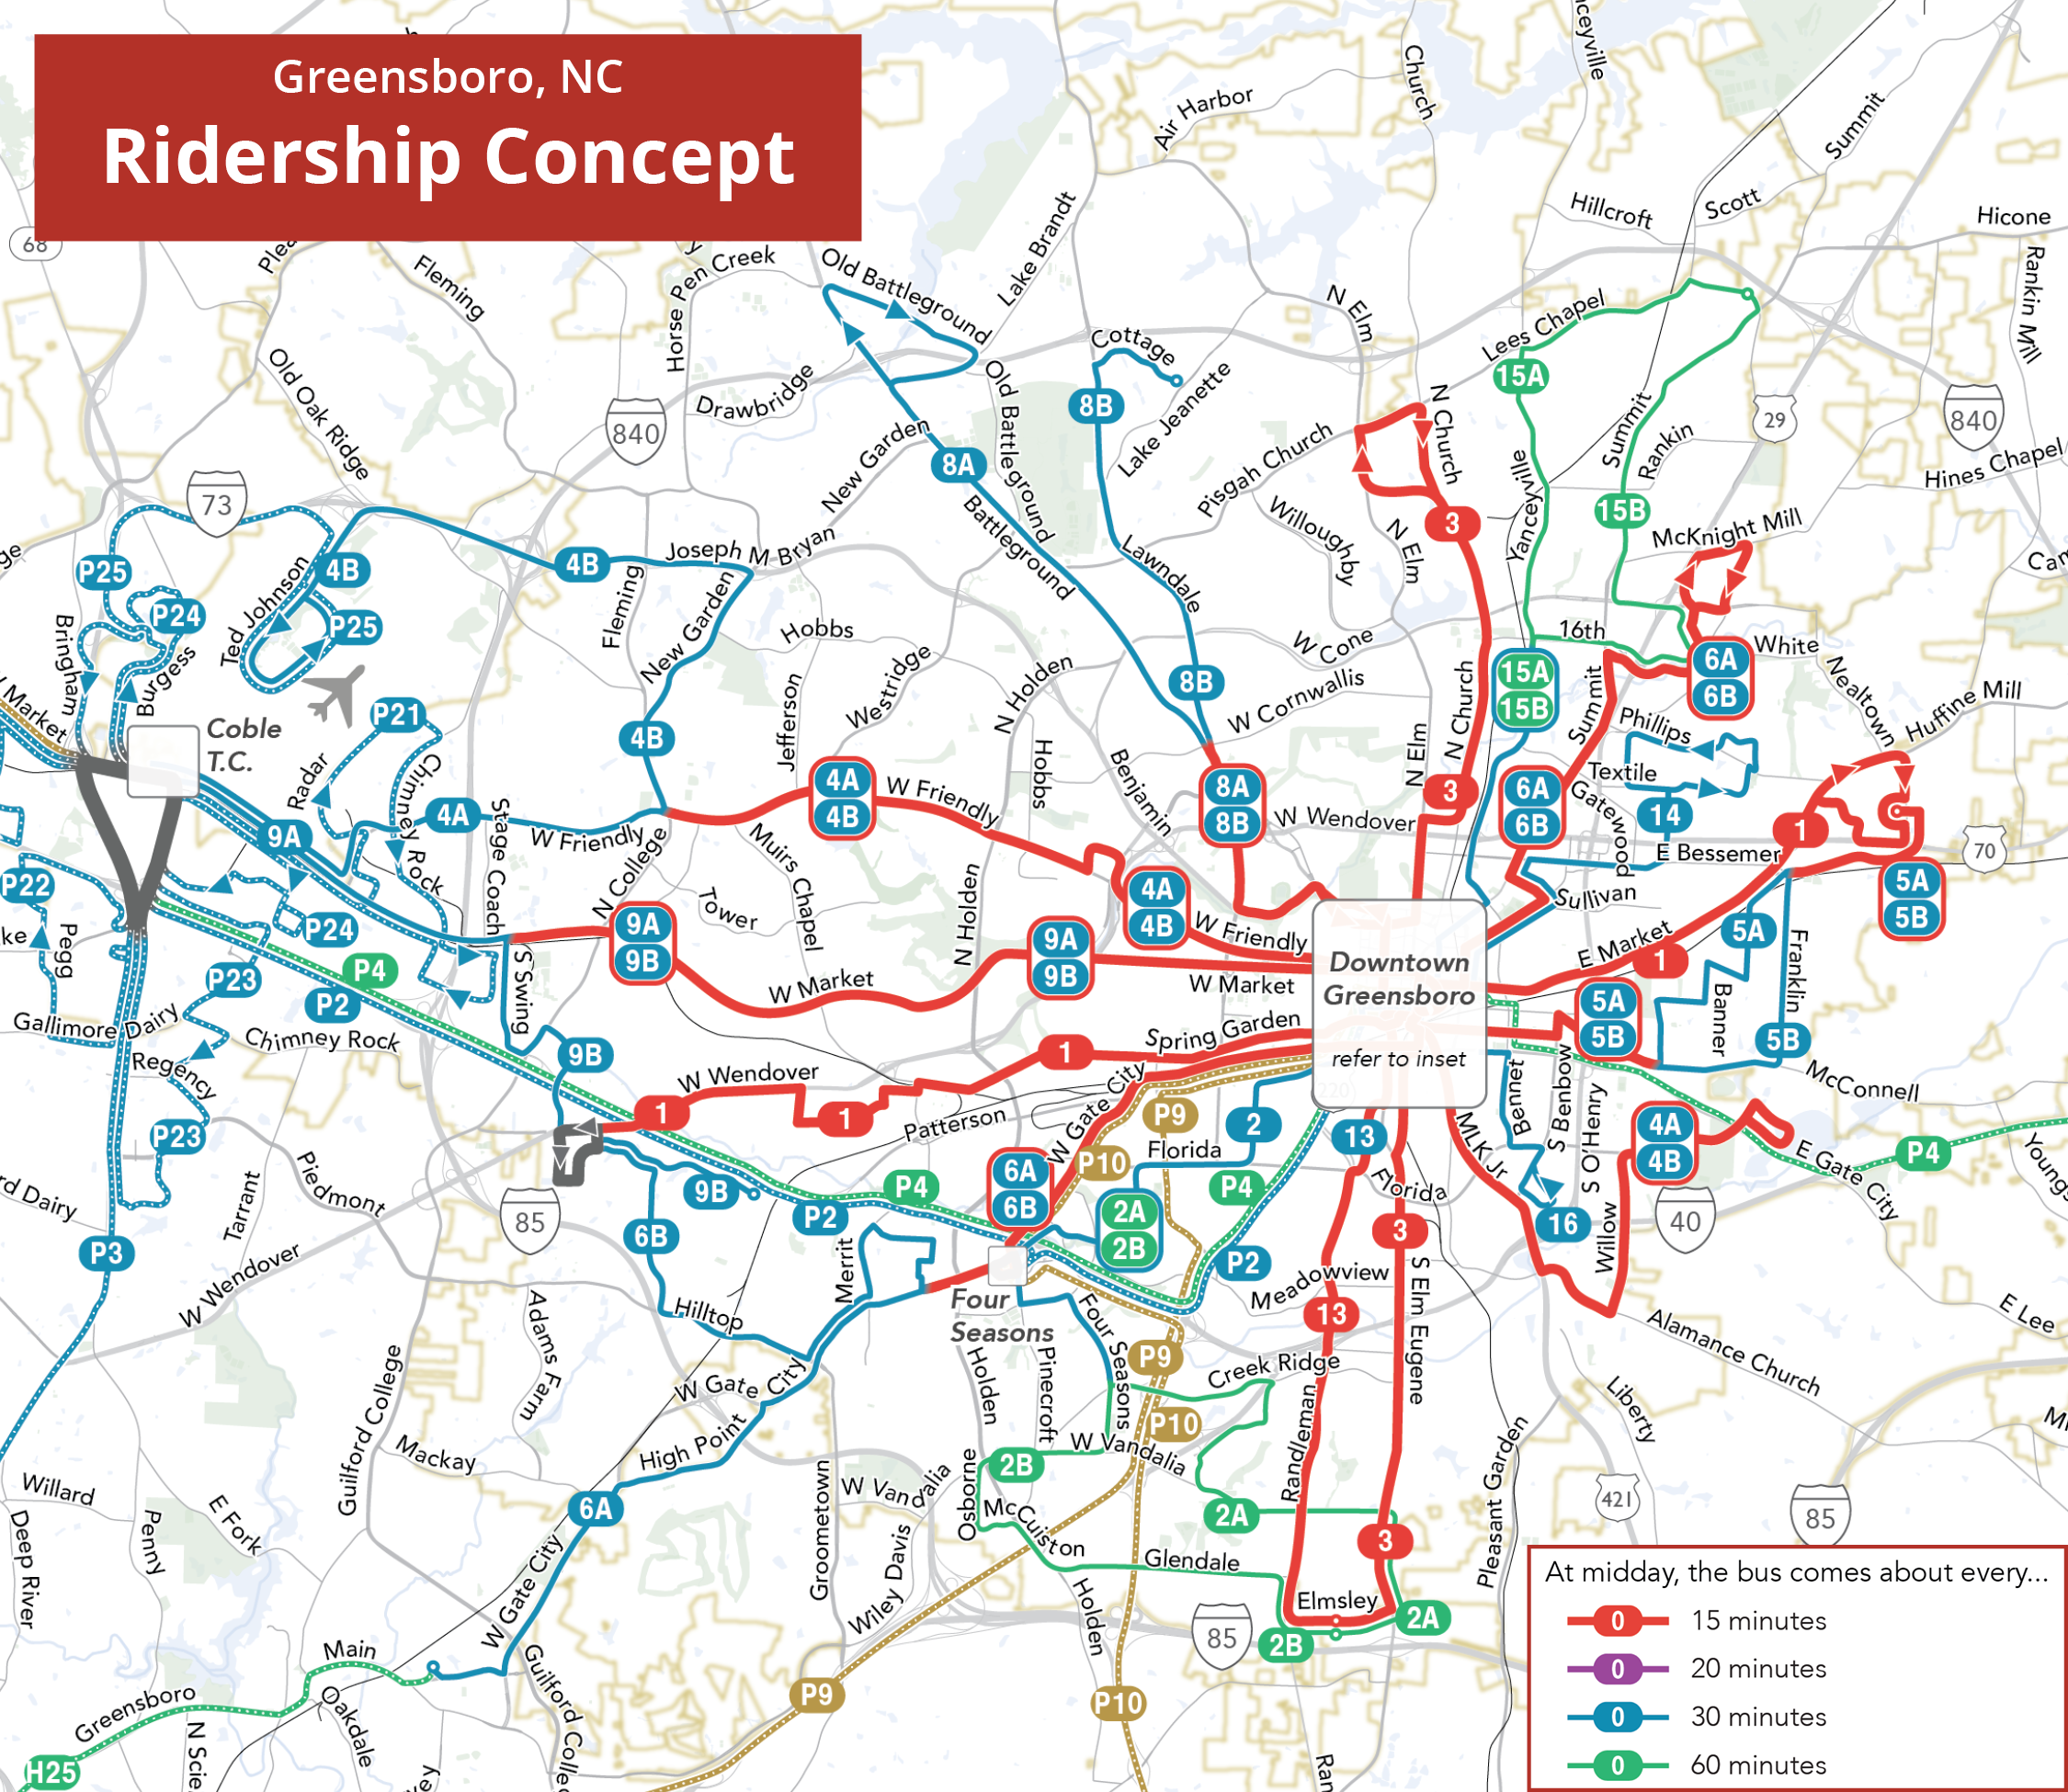
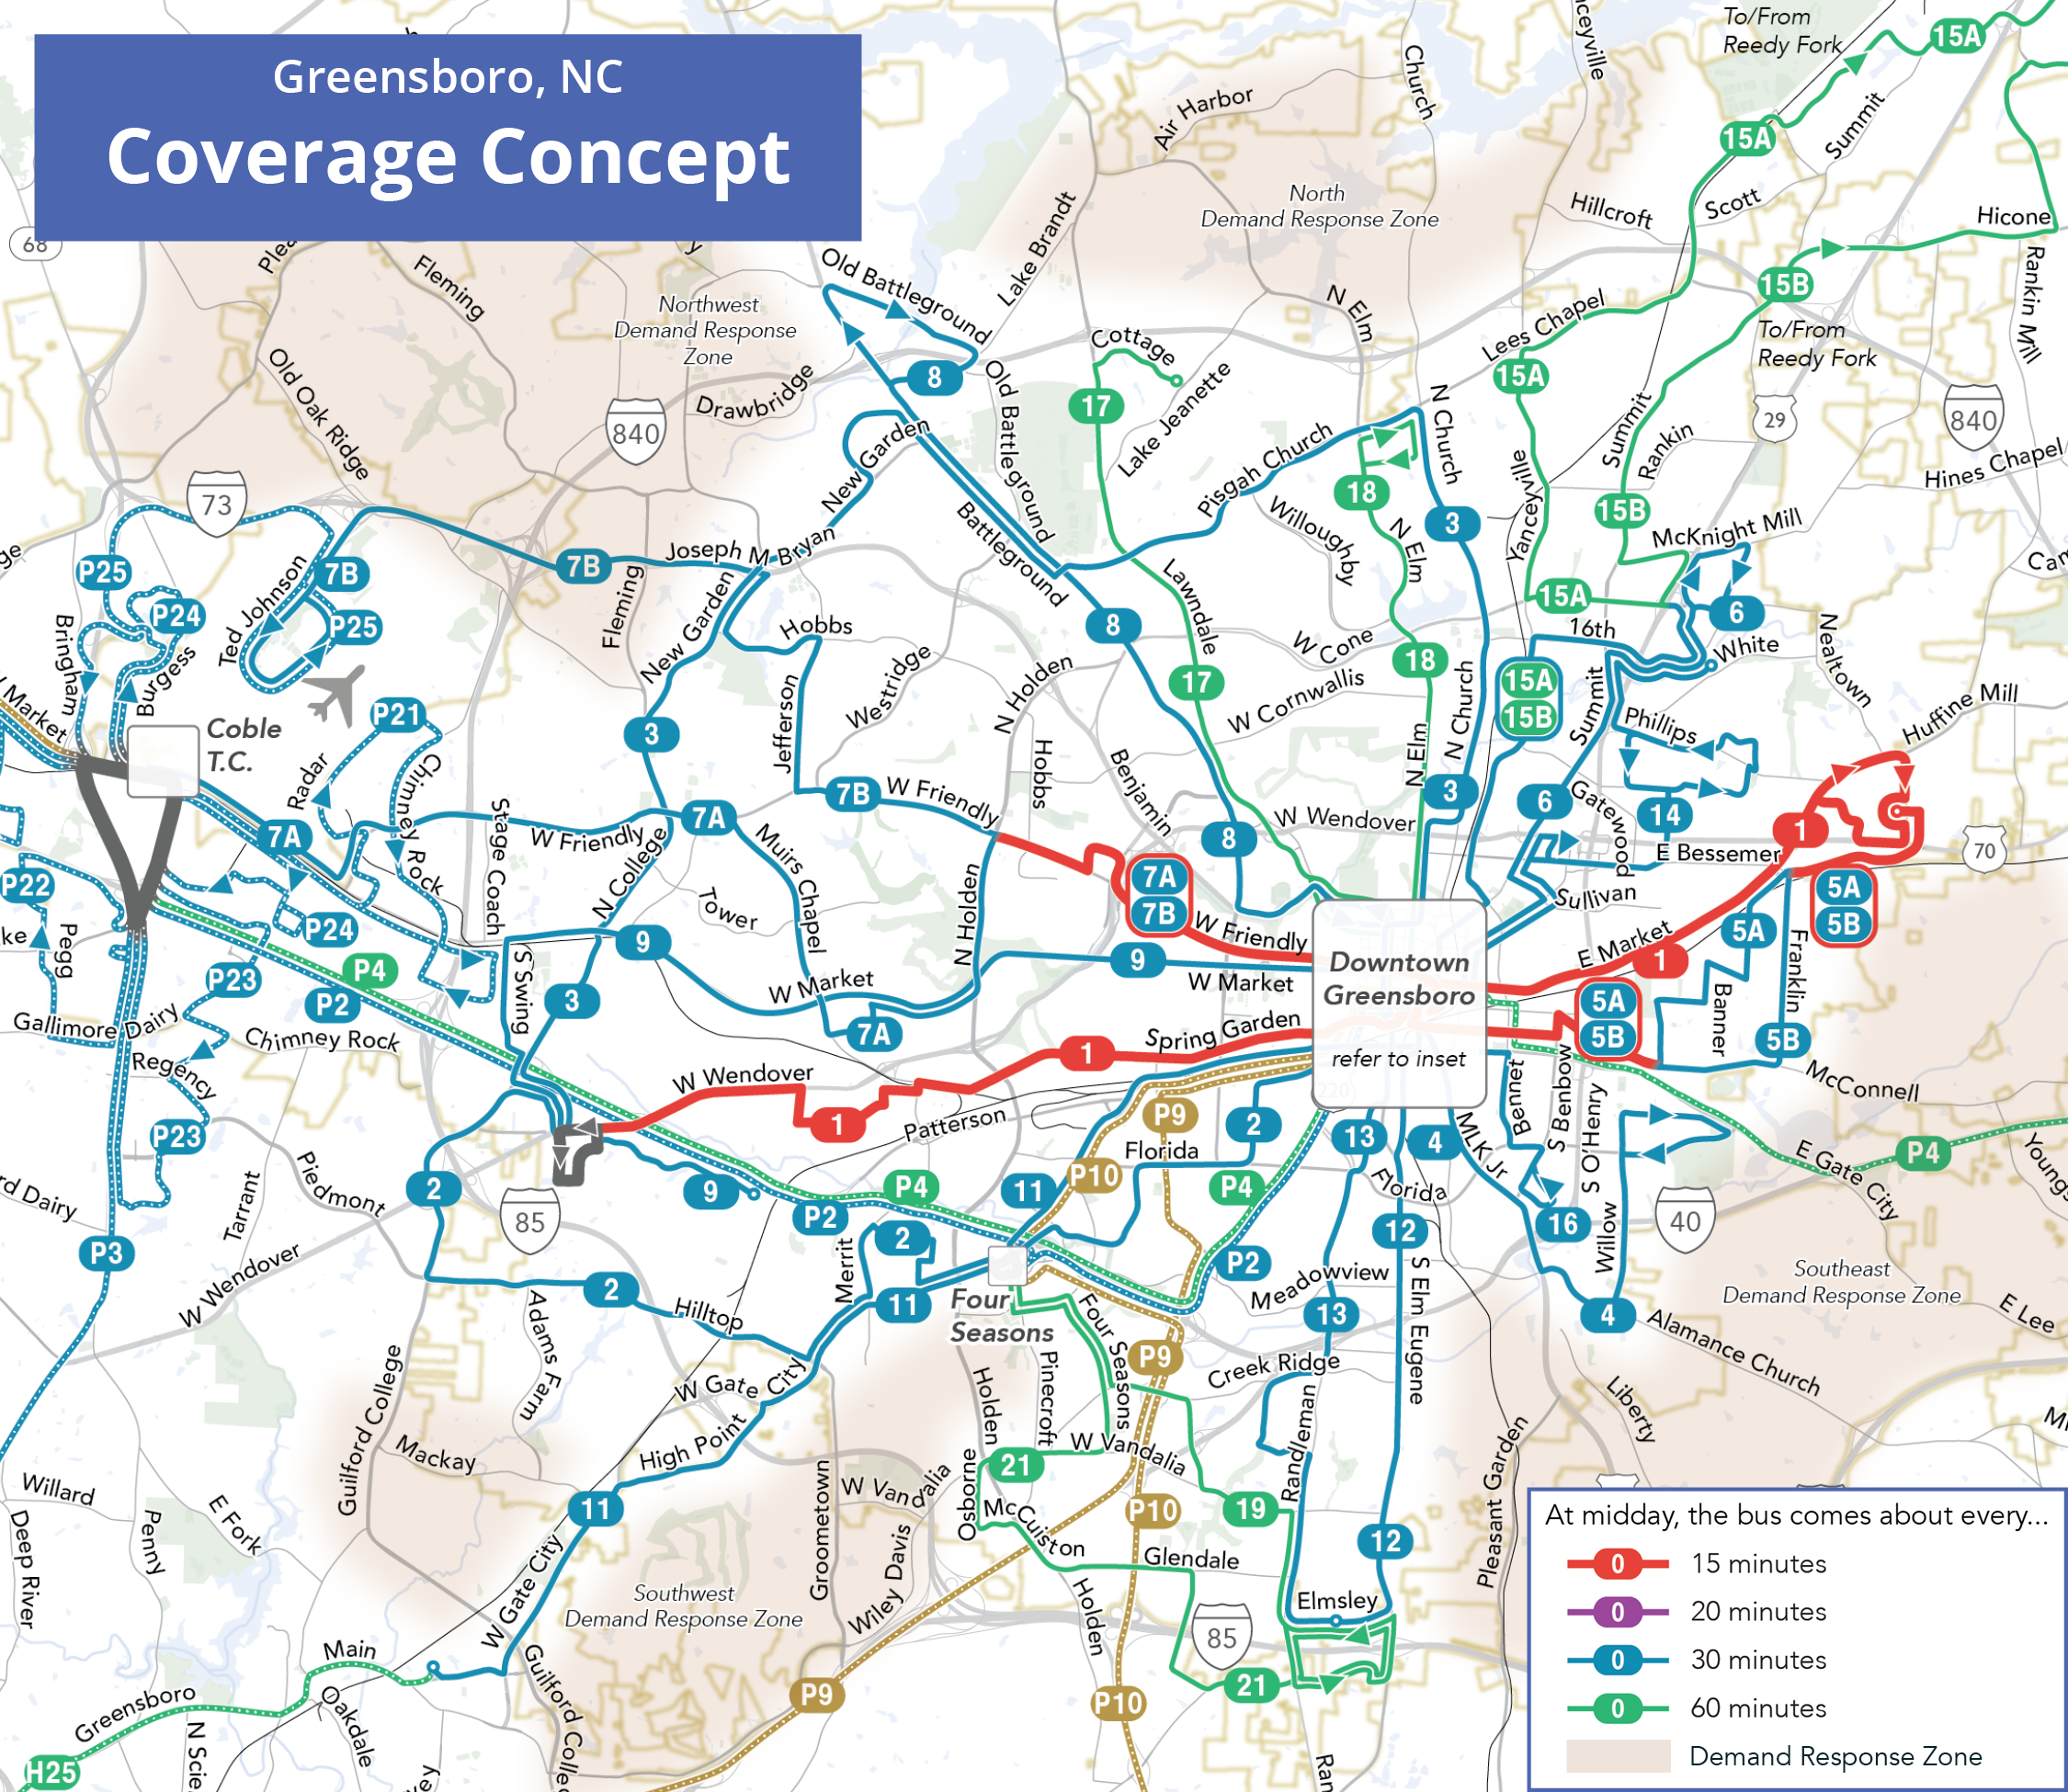
 Greensboro, North Carolina is a pleasant city of 300,000 with two big universities, located in the Piedmont Triad northeast of Charlotte. The city has already adopted a goal to be “car-optional” by 2045. What kind of public transit would that goal require? Working for the City (who runs the local transit service through the Greensboro Transit Agency), we at Jarrett Walker and Associates are seeking public input on two alternative conceptual transit networks. Both conceptual networks have than twice as much service as today.
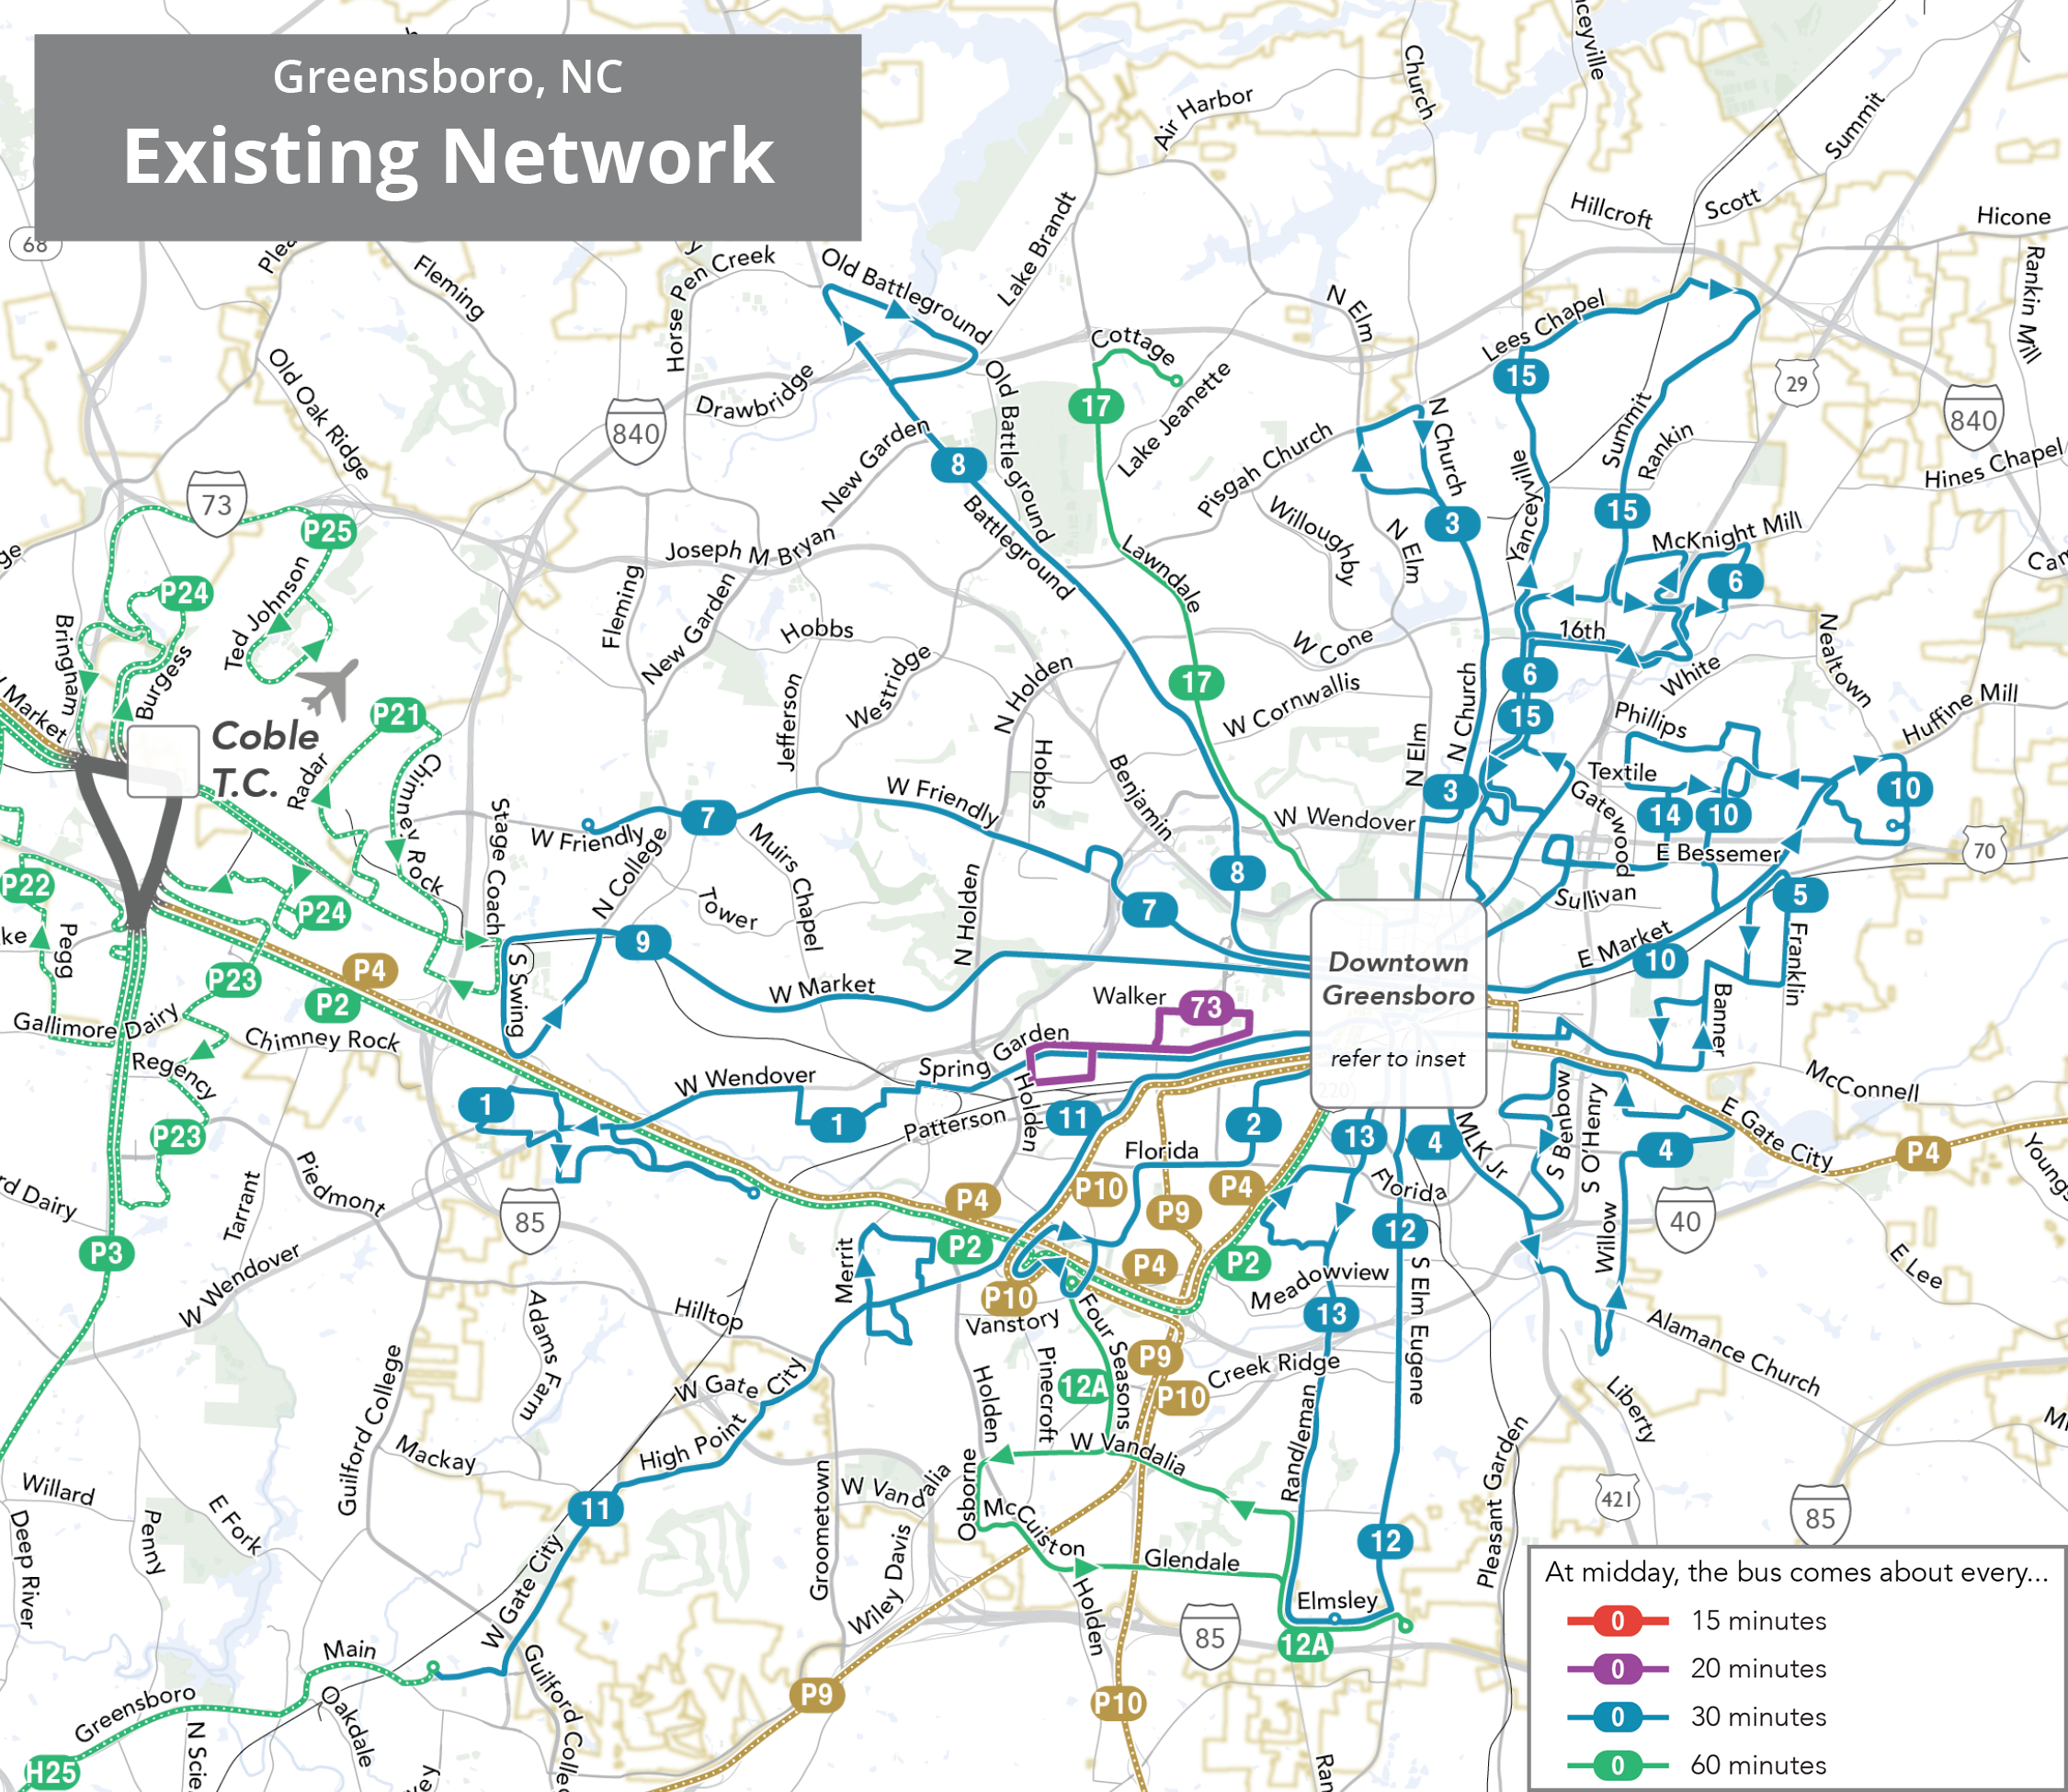
 While you’ve heard plenty about big US agencies facing a “fiscal cliff,” some agencies are doing well and expanding their offerings as their staffing permits. That includes