Tag Archives | Transit Network Redesign

Miami: A Revised New Network

Esta página está disponible en español aquí.

In 2019 and 2020, we collaborated with Transit Alliance Miami to help them develop a new bus network for all of Miami-Dade County. In April the Final Plan was published and put out for public comment by Miami-Dade Transit and their survey showed that 89% of people wanted to see the changes implemented!  In October 2021, the County Commission approved the plan for implementation.

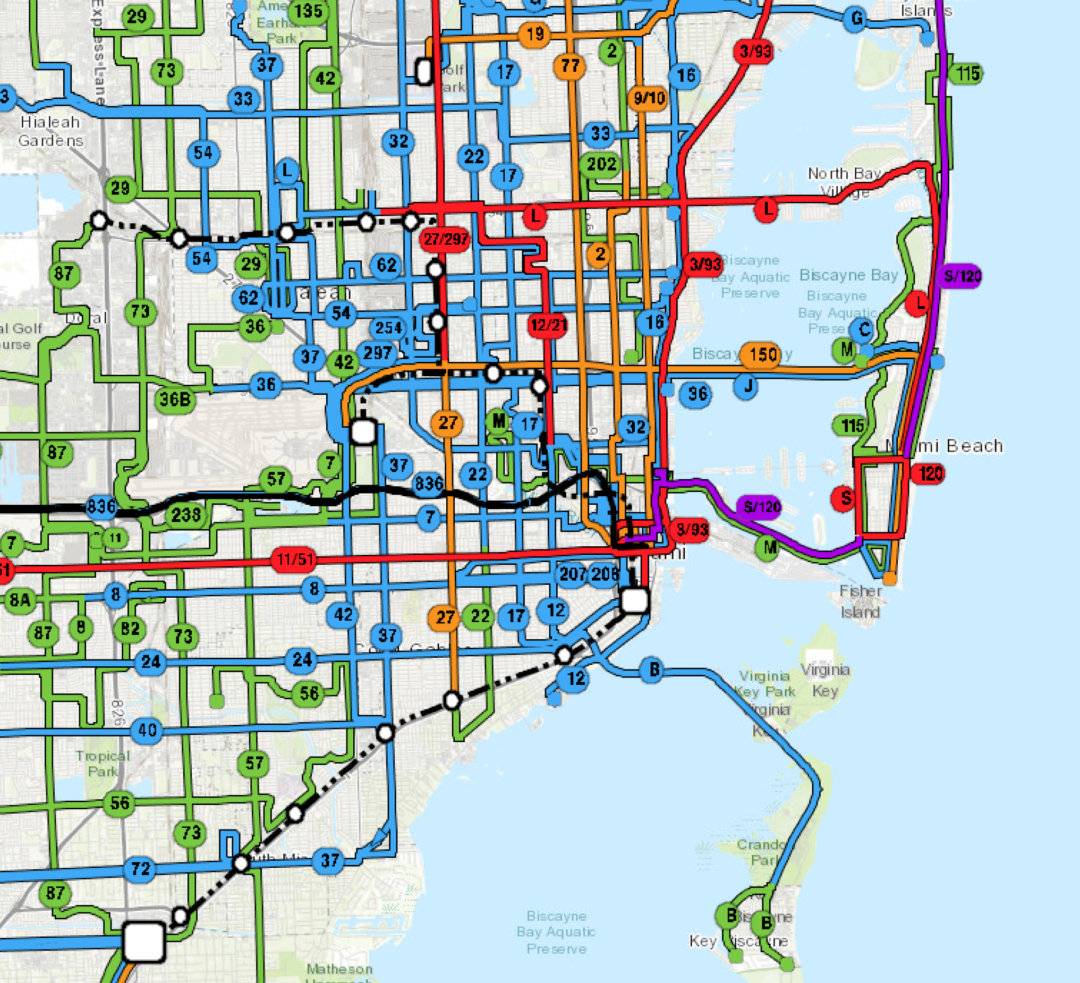
This is what the existing network looks like:

Frequency coded public transit map excerpt from the existing network centered around Miami, Florida

Existing Network. Colors mean all-day frequency! Purple = 10 minutes or better. Red = 15. Orange = 20. Blue = 30. Green = 60.

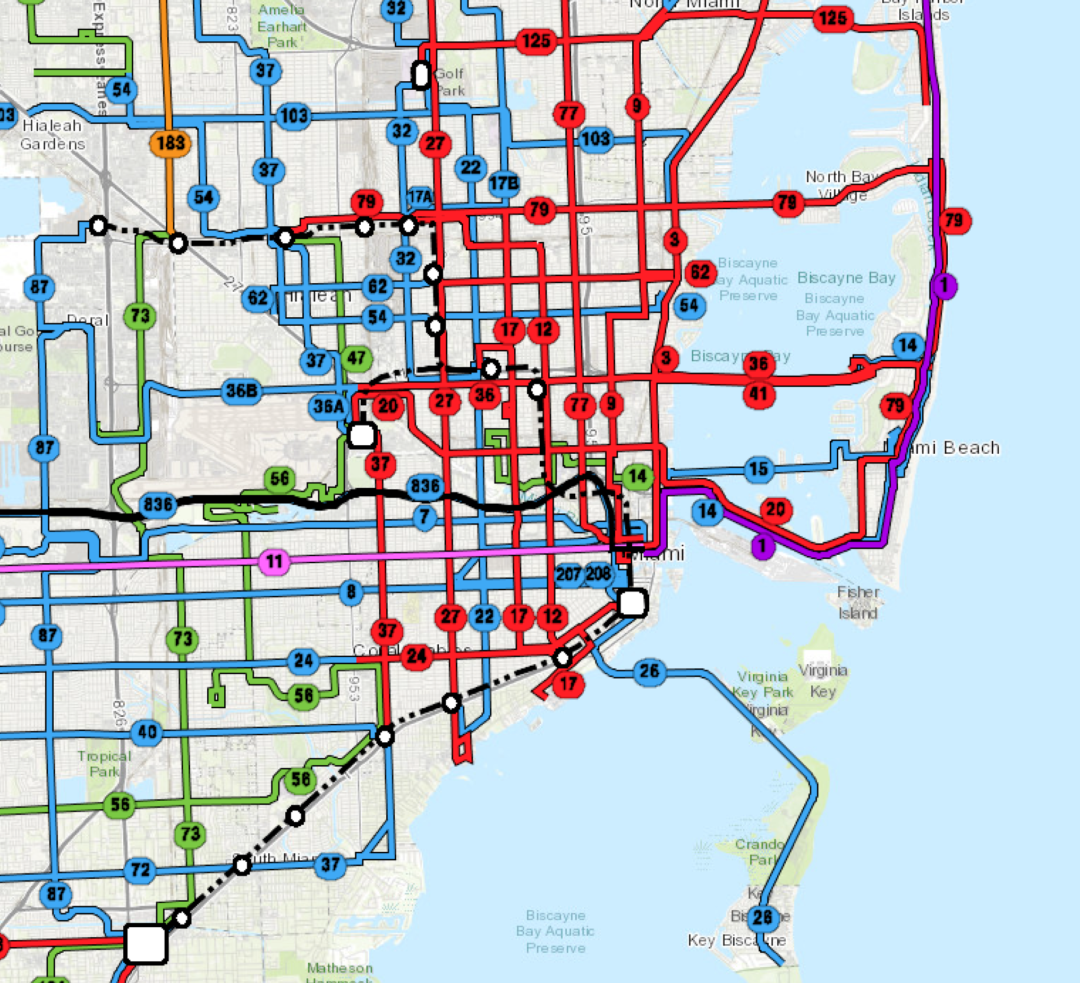
And here is the revised network with fewer routes, less duplication, more frequency:

Frequency coded public transit map excerpt from the revised network centered around Miami, Florida

Revised Network. Colors mean all-day frequency! Purple = 10 minutes or better. Red = 15. Orange = 20. Blue = 30. Green = 60.

(This is not our mapping style, by the way.  It’s from a tool developed by Kittelson Associates that lets you move a slider back and forth between the two maps, so that you can see how different they are in the same place.  It can be a little clunky.  Look close for a vertical grey bar and you’ll find you can slide it left and right.  If it isn’t working, reload.)

The revisions to the Better Bus Network since April are relatively modest and include adding back some coverage routes in a few places, some extensions and improvements to service on the beach and a few other corridors. These changes are possible because the revised network provides more service than what we originally planned because the County is now proposing to invest in 7% more bus service than the pre-pandemic network!

As we’ve said before, the Better Bus Network as drawn last year wasn’t what Miami-Dade needed, it was what Miami-Dade could afford. It’s great to see political leaders at the County, led by Mayor Cava, willing to invest in more service to achieve better outcomes.

Cleveland: See Where You Could Go

We’re excited to share the next stage in our work in Great Cleveland, where the transit agency, GCRTA, has hired us to help think through their goals and different ways that their transit network can be designed to meet these goals in the next few years, and to help imagine what the possibilities may be with modest increase in operating funds in the future. For our readers in Cleveland, our last system redesign survey on is now open.  Learn more about the networks and let us know what you think!

In May of this year, we made a post about two budget-neutral alternative networks that illustrate what the transit network could look like if the agency shifted its focus more towards attracting higher ridership, and what the network would look like if shifted towards maximizing coverage. You can find out more about these alternatives here.

We surveyed the public on these alternatives, and RTA conducted a series of public meetings throughout the county. The result of the public process suggested that many people saw the value of the frequency improvements of the High Frequency Alternative, but that most people would not be in favor of a reduction in coverage to achieve the frequency improvements.

Based on this input, we worked with RTA staff to design two network concepts that illustrate how the network could look if it were designed with a slightly greater emphasis on generating high ridership, but without reducing the overall coverage area from today.  These networks illustrate for the stakeholders and the agency’s Board of Trustees the potential outcomes of this policy choice using only today’s funding levels and illustrate what sort of network those same design priorities could produce with additional funding for bus service.

You can click each map below to explore a larger annotated version.
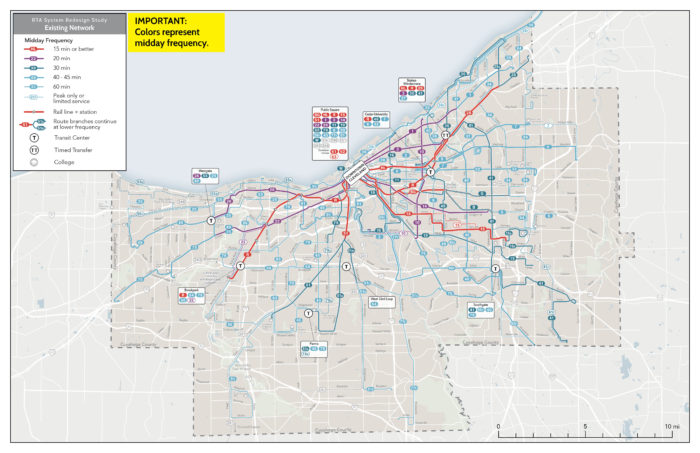
RTA Existing Network
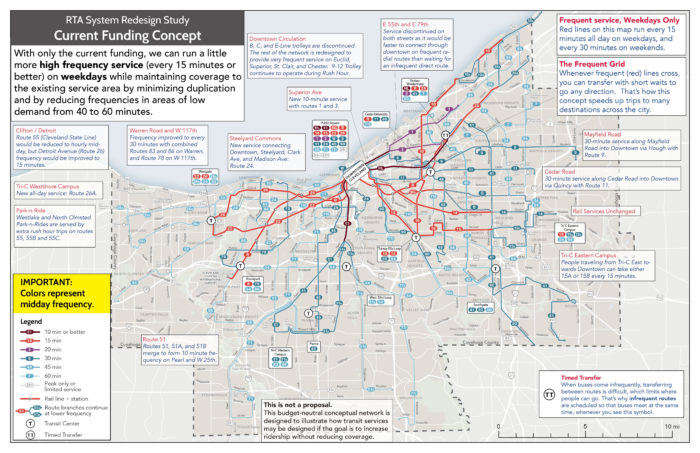
Current Funding Concept
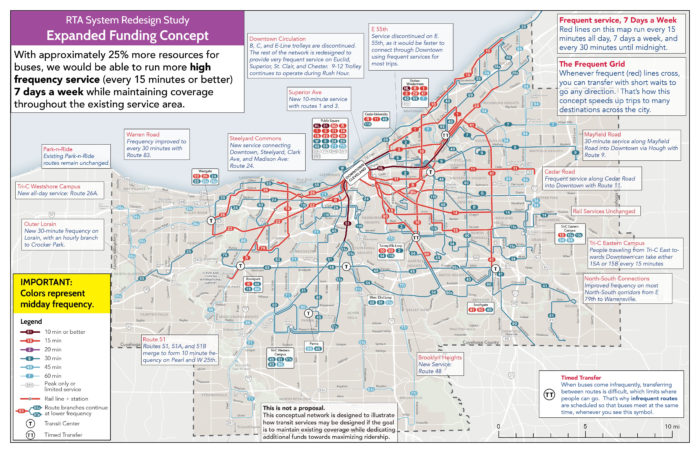
Expanded Funding Concept

Remember, ridership and coverage and the opposite ends of the same spectrum so at the same funding level and without reducing coverage areas, opportunities to add ridership-focused service are very limited.

The Current Funding Concept tries to do this by minimizing duplication in the network, and by making some difficult tradeoffs about where to increase and reduce frequency. While everywhere that is served today would continue to have transit service with this concept, some lower-density places would see their frequency reduced (usually from every 45 minutes to every 60 minutes). Some key improvements include frequent service on busy corridors like Detroit, Lorain and Kinsman (all currently every 20 minutes), and frequent crosstown service on E 93rd and E 105th (Route 10).

These and other improvements are possible by reducing service levels elsewhere in the network. For example, the Center Ridge corridor on the west side of the county would be served every 60 minutes by a branch of Route 26 (which continues via Detroit towards downtown). Today, this corridor is today is served every 45 minutes, so this is a reduction in frequency, but it does come with the benefits of a one-seat ride downtown, and an extension to the new community college campus at the edge of the county (Tri-C Westshore).

Closer to downtown on the east side, low-frequency crosstown services on E 55th and E 79th would be discontinued with this design. Today, because of the crosstown routes’ low frequency and proximity to downtown, many trips along these corridors can be made more quickly by traveling in and back out along more frequent radial services (such as the HealthLine BRT, or routes 1 and 3).  Yes, that would mean having to transfer, but as we’ve explained in a past post, “transferring” can be good!

These hard choices are characteristic of a no-growth redesign; in this case, the network was designed to improve ridership potential and expand the frequent network, within the constraint of maintaining the current coverage area.

The Expanded Funding Concept deploys about 25% more bus operating resources that today’s network. With this greater resource level, this concept can increase the usefulness of the transit network in almost every part of the county that is served. Some key improvements include frequent crosstown service on W 117th in the west and Warrensville Center in the east, and on key radials like St. Clair, Superior, Quincy and Cedar. 30-minute service would be provided on corridors like outer Lorain, W 130th, and Granger where only infrequent or no service is available today.

More Information

RTA is conducting a survey in English and Spanish and public meetings on these concepts now, so if you are in Cleveland, head on over to their website to find out more: http://riderta.com/systemdesign.

We’ve also put together an interactive webmap (similar to what we were able to deploy in Dublin in 2018) that you can use to explore the network and compare some travel time isochrones for each concept: https://rtanetworkconcepts.com/viewer/. In these maps, blue areas are newly reachable with the network concept, purple areas are reachable with both the existing network and the concept, and red areas are where you can travel with the existing network that is no longer reachable with the concept. You can also click the “View Routes” button to explore the network structure of each concept.

Here’s a quick comparison for the Tri-C Western campus showing the area that would be reachable in 60 minutes with the Expanded Funding Concept:
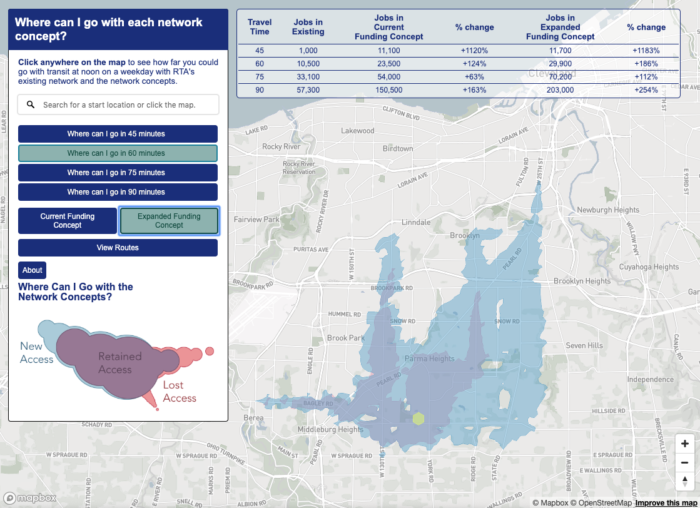
With the Expanded Funding Concept, 30-minute service would connect TriC’s western campus to the W 130th, Pearl, Ridge and State corridors. Since the campus is only served with hourly routes today, this produces a big expansion in the area reachable from the college (the blue area shown on the map).

Finally, much more detail is available in our mini-report, which you can view here: http://www.riderta.com/sites/default/files/events/RTASRSPresentation201909.pdf
Miami-Dade: Tell us what you think about these conceptual networks!

Esta página está disponible en español aquí.

Our latest work on the Miami-Dade transit network is now available online, and we’re looking for people from the area to provide their input through this online survey.

The well-respected advocacy group, Transit Alliance, is leading the Better Bus Project on behalf of both Miami-Dade Transit and several of the key cities.  Transit Alliance and the County hired us this year to help develop transit network alternatives that would illustrate what the transit network could look like if the trolley networks were more coherently integrated with the overall county-wide network and if the balance between ridership and coverage goals were changed.

The local newspaper, the Miami Herald, has a good article about the networks and the choices they illustrate.

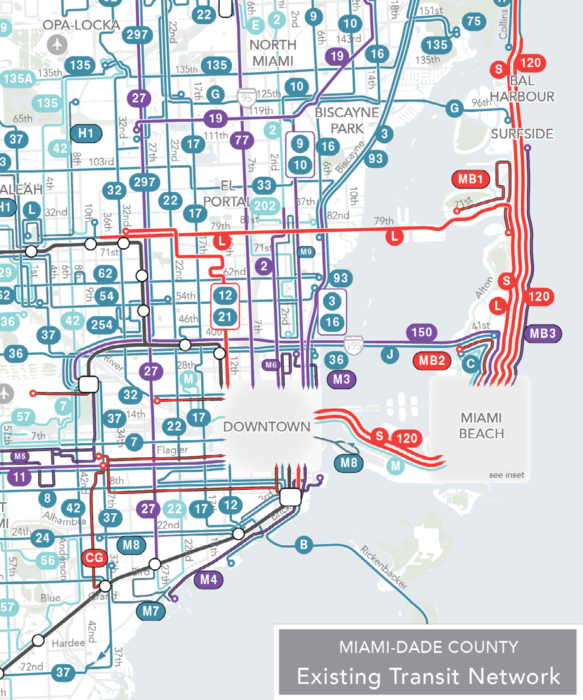
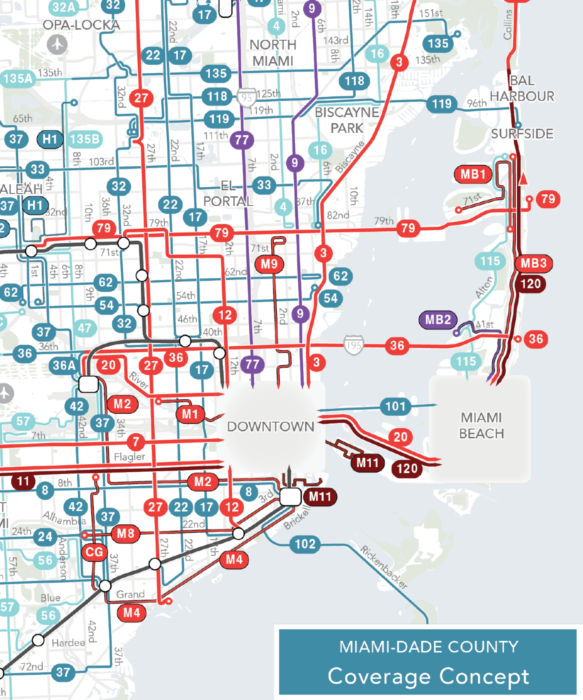
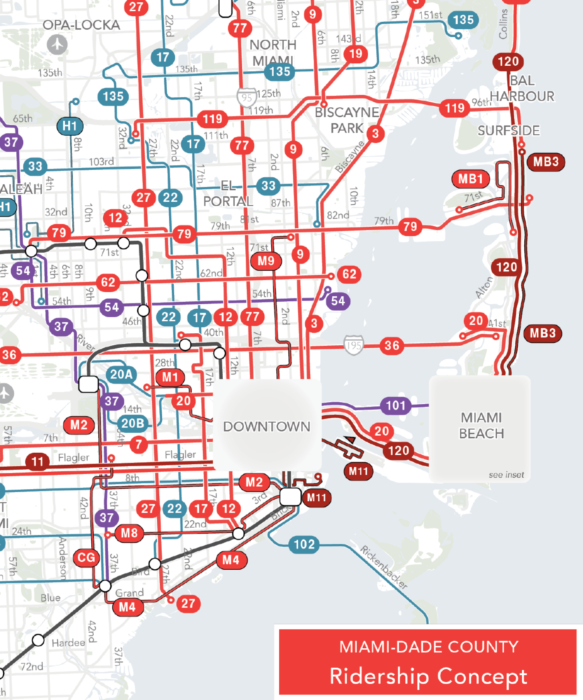
We previously released a Choices Report that highlighted one of the major shortcomings of the existing network, a lack of a frequent grid. The two network concepts we developed try to build a frequent grid, at least in the core of the network. Below are slices of the Existing Network, Coverage Concept, and Ridership Concept for the core of the region.

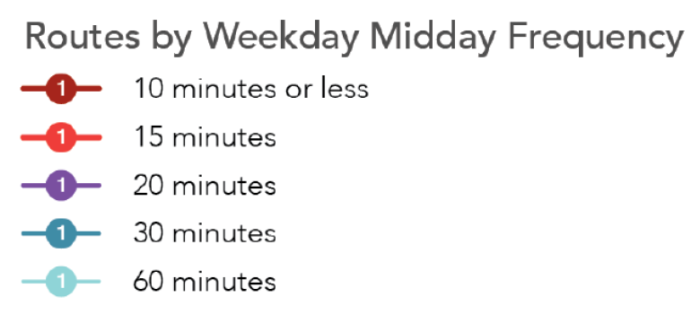
And the legend:

The concepts cost the same as the existing network, and they are fully implementable. If everyone loved one of the concepts, it would be possible for Miami-Dade and the cities to make the network changes and implement one of these in 6-9 months. But we aren’t asking people to pick one or the other. We’re asking people to tell us which concept they are closest to, so that the County Board and City Commissions can get input on the direction they should choose for Miami-Dade.

Some other key questions raised by these concepts include:

  • Should the trolleys be changed to make them complementary parts of a county-wide network? Both the Coverage and Ridership Concepts can provide more frequency on more streets because the city and county networks are designed to complement each other.
  • Should bus stops be placed farther apart so buses can go faster and people can get where they are going faster. Today, stops are about 1/8 of a mile apart. Both the Coverage and Ridership Concepts assume that stops are spaced about ¼ mile.
  • And, of course, how should the region balance the competing goals of ridership and coverage?

So if you know anyone in Miami-Dade County, send them to the project website to explore and express their views.  Encourage them to peruse the Concepts Report. And if you’re interested in reforming bus networks in general, watch the conversations around the concepts and the ultimate decisions by the local elected leaders. As with every network redesign we do, these concepts are here to help people decide what values they want transit to prioritize. We can help the community understand the options and the outcome, but it’s ultimately their decision.

Chattanooga: Choices for the City’s Transit Future

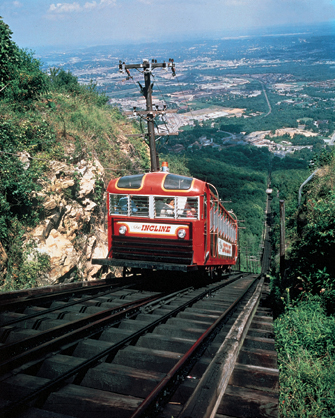
Chattanooga Incline Railway

Chattanooga, Tennessee’s most well-known transit infrastructure may be the Chattanooga Choo-Choo, a former train station made famous by a 1941 swing tune by Glenn Miller and His Orchestra, or perhaps the Lookout Mountain Incline Railway, a tourist-oriented funicular currently owned and operated by the Chattanooga Area Regional Transportation Authority (CARTA).  Most days though, Chattanooga’s transit line with the highest ridership is the Route 4 bus from downtown to the eastern suburbs. Although Chattanooga was an early adopter of electric buses, starting their downtown electric shuttles in 1992, transit has not been at the forefront of its planning policies in the past few decades.  Like many other similarly sized cities without urban growth boundaries in the US, development has sprawled outwards, enabled by highways, resulting in land use patterns that are difficult to serve by transit.

That is changing.  In recent years, Chattanooga has focused efforts on rekindling the inner city, adding housing, retail, and office space downtown, and becoming the first midsize city in the US to designate an urban innovation district.  As a recognition of their efforts to build vibrant public spaces, Chattanooga will be hosting the Project for Public Spaces placemaking conference this Fall, the third city to do so after Amsterdam and Vancouver.  But in order for a city center integrated within a growing regional economy to scale up without being choked by traffic congestion, Chattanooga needs better transit.  Today, the city is starting to reconsider the role of the bus and may be ready to make major changes to its bus services and perhaps invest more in it.


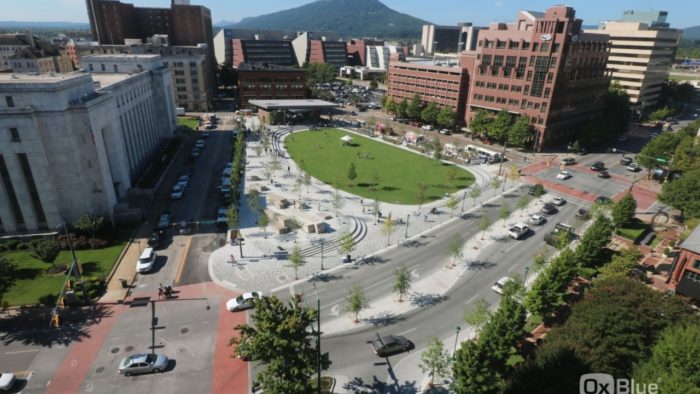
The recently revamped Miller Park in Downtown Chattanooga. Photo: downtownchattanooga.org

We’ve been studying the transit system in Chattanooga for over a year and in June CARTA released our report outlining four possible concepts of what the future of transit could look like. These four concepts show a range of options between coverage and ridership goals with no new funding and two options with additional funding for transit. Happily, the local newspaper’s coverage is clear and accurate.

The release of this report begins the period of public discussions and surveys. The results of that discussion will inform the decision that the CARTA Board makes in August about what direction the final plan should take.

Our report discusses four possible futures but most likely, the final plan won’t look quite like any of these. The key idea — as in much of our work — is to open up a “decision space” in which people can figure out where they want to come down on the two difficult policy decisions:

  • Ridership vs coverage? What percentage of resources should to go pursuing a goal of maximum ridership — which will tend to generate frequent service in the densest urban markets — as opposed to the goal of coverage — spreading service out so that as many people as possible have some service nearby?
  • Level of investment in service? How much should the community invest in service? The more it invests the more it gets in value, but the value it gets depends in part on how you answer the ridership-coverage trade-off.

If you live in Chattanooga or know anyone there, now is the time to get involved.  Download the report, read at least the executive summary, form your own view, and share it with us here!  The more people respond, the more confident we’ll be in defining the final plan based on their guidance.