Las Vegas

guest post: vehicle automation and the future of transit

Antonio Loro is an urban planner with a particular interest in transportation innovations. In research conducted for TransLink and Metrolinx, he investigated the potential impacts of vehicle automation technologies. The views expressed in this article are those of the author and do not necessarily represent the views of, and should not be attributed to, TransLink or Metrolinx.

AnthonyLoroVehicle automation is increasingly showing up on the radar of urban planning and transportation planning professionals. Technologies are developing rapidly, and some news stories report that fully self-driving cars are just a few years away. It’s tempting to envision automation ushering in a bold new era in urban transportation, where driverless cars whisk passengers between destinations safely and conveniently, use roads with great efficiency, and make public transit as we know it obsolete.

However, a closer look at vehicle automation reveals a more nuanced picture of the future. Automation capable of replacing human drivers in any situation may be many years away from the market. The traffic flow improvements enabled by automation will be limited in several ways. Buses and other forms of public transit will still be needed to efficiently move large numbers of travelers around cities. And various forms of automation in buses could enable major improvements in service.

The last two points have come up on this blog before (here, here and here), but since there are a variety of opinions on the implications of automation for transit, it’s useful to dig a bit deeper into these issues and take a critical look at when various forms of automation will arrive, how automation will affect traffic flow, and how it will affect travel behaviour. This post will delve into those questions to shed a bit more light on what automation means for the future of public transit.

According to some, vehicles that can drive themselves anywhere, anytime, without any human intervention – described as “Level 4” vehicles by the National Highway Traffic Safety Administration (NHTSA) – are just around the corner. In 2012, Google co-founder Sergey Brin said of their famous self-driving car: “you can count on one hand the number of years until ordinary people can experience this.” Many others have made bullish predictions. For example, the market research firm ABI Research foresees Level 4 cars on the roads by around 2020, and panelists at the Society of Automotive Engineers (SAE) 2013 World Congress predicted arrival between 2020 and 2025.

On the other hand, some point to a number of challenges that suggest Level 4 will emerge further down the road, perhaps not for several decades. Steven Shladover of the California Partners for Advanced Transportation Technology, a leading expert on vehicle automation, argues that Level 4 will be much more technically difficult to achieve than many optimists acknowledge (see Vol. 7, No. 3 here). According to Shladover, huge advances in technology would be needed to progress to systems capable of driving safely in the vast range of complex and unpredictable situations that arise on roads. In addition, such systems would have to be far more reliable than products like laptops or mobile phones, and extensive – and expensive – testing will be needed to prove reliability. While Google’s vehicles have driven long distances in testing – over 500,000 miles as of late 2013 – and have not caused any crashes while in automated mode, Shladover points out that this proves very little because their vehicles are monitored by drivers who take over when risky or challenging situations arise.

Legal and liability issues could also delay the emergence of Level 4 vehicles. A few American jurisdictions now explicitly allow automated vehicles on public roads for testing, and Bryant Walker Smith, a leading authority on the legal dimensions of vehicle automation, has found that automated vehicles are “probably” legal in the US; however, he also cautions that their adoption may be slowed by current laws. Laws will have to be clarified before Level 4 vehicles hit the mass market in the US and in other countries. Liability for crashes could also be a thorny question. If a human isn’t driving, presumably blame would shift to the manufacturer, or perhaps a supplier of system components, or a computer programmer. Resolving these issues could stall the emergence of automation.

While there is dispute as to when Level 4 vehicles will be on the road, most in the field agree that more limited forms of automation are coming soon. Some are already here. For example, Mercedes S-Class vehicles can simultaneously control speed and steering when road and traffic conditions allow, though the driver must continuously monitor the road. This is just shy of “Level 2” automation, since Mercedes’ system also requires the driver to keep their hands on the wheel. Numerous other vehicle manufacturers are developing advanced technologies that promise to take over driving duties, at least some of the time, on some roads. As technologies advance, “Level 3” vehicles could be on the market by 2020 to 2025, according to most experts. These vehicles would allow drivers to forget about monitoring the road and instead read or watch a movie, with the caveat that when the automated system is out of its depth, it would ask the driver to take over. (The takeover time is a matter of debate – anywhere from several seconds to several minutes has been suggested.)

Automation could be a boon for safety – or it could create new problems. On the plus side, it appears that crash avoidance systems already on the market may be effective. Of course, as machines take over more of the responsibility of driving, safety will only improve if the machines are in fact less fallible than humans. This might seem an easy task, considering the foibles of humans, but it’s worth remembering that some automation experts believe otherwise. And where driving is shared between human and machine, the safety impacts are especially open to question. A driver in a Level 2 vehicle might fail to continuously monitor the road, or a driver in a Level 3 vehicle could be engrossed in their movie and fail to take over control quickly enough when requested. In either case, automation could actually decrease safety.

After safety, one of the biggest selling points of vehicle automation is its potential for improving traffic flow, especially through increased road capacity. With their slow reaction times, human drivers can’t safely follow other vehicles closely, so even at maximum capacity, around 90 percent of the length of a freeway lane is empty. If machines could react quickly enough, road capacity would increase enormously. Some studies appear to suggest huge increases are in fact possible – for example, one study estimates that capacity would almost quadruple, and another finds quintupled capacity. However, their calculations consider endless streams of densely-packed vehicles. More realistic estimates assume that several vehicles, say four to twenty, would follow each other in tightly packed groups or “platoons”, with each group separated from the next by a large gap. These interplatoon gaps would provide safety and allow vehicles to change lanes and enter and exit the freeway. Studies that account for these gaps estimate that automation would increase capacity in the range of 50 to 100 percent (for examples, see here and here).

While the more realistic estimates of capacity increases are still very impressive, there are a number of caveats. First, short headways are possible only when automated vehicles are equipped with V2V, or vehicle-to-vehicle communication. Vehicles that rely completely on on-board sensors – such as the Google self-driving car, in its current form – cannot react quickly enough to the movements of other vehicles, so they would enable relatively small capacity increases. A second caveat: large capacity increases would come only when automated cars dominate the road. Studies have found that when fewer than 30 to 40 percent of vehicles on the road are capable of platooning, there would be little effect on capacity, and large increases would come only after the proportion of equipped vehicles exceeds 60 to 85 percent (e.g., see here). This is important, since new vehicle technologies will take some time to become commonplace. Imagine that as soon as automated vehicles hit the market, every new vehicle purchased is automated: it would then take two decades for automated vehicles to account for around 90 percent of vehicles on the road. If the rate of adoption is more realistic, but still rapid, it would take three decades or more before automated vehicles make possible large road capacity increases. A third major caveat: platooning is only feasible on freeways. Changing lanes, stopping at red lights, making left turns, parallel parking, stopping for pedestrians – such manoeuvres would make platooning impractical on city streets.

For city streets, however, there is the prospect of using automation to improve flows at intersections by coordinating vehicle movements. A good example is the “reservation-based” intersection, where there are no stop lights or stop signs – instead, cars equipped with V2I (vehicle-to-infrastructure communications) technology “call ahead” to a roadside computer that orchestrates the movements of vehicles and assigns time and space slots for vehicles to cross the intersection. Simulations show such an intersection could move almost as much vehicle traffic as an overpass – but so far, simulations haven’t included pedestrians and cyclists. Accommodating these road users in a reservation-based intersection would require signals with sufficiently long cycles, so capacity increases would be limited.

Vehicle automation would also bring a very direct impact: reduced or eliminated labour in driving. Time spent traveling in Level 2 vehicles could be less stressful, and could become more productive and enjoyable in Level 3 and especially in Level 4 vehicles. Profound changes in travel behaviour would result. As people increasingly let their robot chauffeurs deal with road congestion and other hassles of driving, travel by motor vehicle would become more attractive. Trips would tend to be longer and more frequent and travel at peak times would increase. Trip routes would also tend to make greater use of freeways with Level 2 and 3 vehicles, since it is primarily on these roads that the vehicles will be able to operate in automated mode.

These induced demand effects would tend to increase road congestion. Freeways would be the exception – if platooning-capable technology becomes widespread, freeway capacity would increase and congestion would drop. That is, until the surplus capacity is taken up by the “triple convergence” of mode shifts, route changes, and change of time of day of travel. However, the increase in freeway traffic would be constrained by capacity limitations on the rest of the road network – as freeway travel increases, new bottlenecks would form on streets near freeway entrances and exits, where automation does not boost capacity, thus restricting the volume of traffic that can access the freeway.

The upshot of the above observations on the capacity effects of automation is that even when the potential freeway capacity increases enabled by platooning are fully realized, automated cars would nevertheless be able to carry far fewer people than bus or rail on a given right-of-way. And, as mentioned, capacities on streets will be largely unaffected. Because the capacity improvements made possible by automation would be limited, we will still need buses and trains when space is in short supply and we need to transport large numbers of people. Larger vehicles will still fit a lot more people into a given length and width of right-of-way than platoons of small vehicles will be able to carry. As Jarrett would say, it’s a simple fact of geometry.

So, vehicle automation will not render large transit vehicles obsolete. On the contrary, it could enable significant improvements in bus service and increases in ridership. Automated steering enables bus operation at speed in narrow busways, which reduces infrastructure and land costs. It also enables precise docking at passenger platforms, which improves passenger accessibility and reduces dwell times. Automated control of speed enables bus platooning, allowing buses to effectively act like trains. Automation can be taken further yet: a driver in a lead bus can lead a platoon of driverless buses, thus providing high capacity with low labour costs. Similarly, individual buses or platoons can operate driverlessly, thus enabling increased frequency with low labour costs. “Dual mode” operation is also possible: imagine a busway where chains of buses leave the city running like a train until they separate at a suburban station, where drivers board and take them onward onto various local routings.

Some of these forms of automation have already been implemented in BRT systems. For example, a system in Las Vegas employed optical sensors to enable precise docking at passenger platforms, BRT buses in Eugene, Oregon used magnetic guidance to facilitate precision docking and lane-keeping in a pilot project, and systems in Paris and Rouen, France, and in Eindhoven, the Netherlands, use various types of guidance systems. While bus platooning and driverless operation have not been deployed so far, these applications could be achieved given sufficient technological advances – or by using a low-tech shortcut. The simple solution is to keep other vehicles or humans out of the way of the automated bus. If buses operate on busways with adequate protection, platooning and driverless operation is possible with existing technology. (Similarly, current driverless train systems are able to operate driverlessly, even with decades-old technology, by virtue of the well-protected guideways they run on.) Developing a vehicle capable of driving itself in the simplified environment of a protected busway is a considerably easier task than developing a vehicle that can drive itself on any road, anytime.

With the arrival of Level 4 automation, driverless buses could operate on the general road network. This would make it possible to operate smaller buses at higher frequencies, since labour costs would no longer constrain frequency. If you shrink driverless buses small enough – and provide demand-responsive service for individual travelers – you end up with driverless taxis. This points to the possibility that public transit service may be more efficiently provided by driverless taxis (or driverless share taxis) in low-density areas, thereby replacing the most unproductive bus services and improving transit productivity overall. (Of course, while automation could boost productivity, even driverless demand-responsive service would still have low productivity where densities are low.)

While it’s a seductive story that driverless cars will transport us to a realm of much improved safety, convenience, and efficient road use – and where public transit has dwindled away – the future is likely to be more complicated. Advanced automation is indeed coming soon, though we might not see Level 4 technologies for a while. Automation could improve safety, though it could also generate new problems. It could also improve road capacity, but the improvements would be limited in several ways. All this suggests that we needn’t worry about (or celebrate) how vehicle automation will make public transit obsolete. Instead, let’s focus on how to use automation to the advantage of public transit. 

yes, great bus service can stimulate development!

Are you sure that rail "stimulates development" and that buses don't?  In a major report released today, the Institution for Transportation and Development Policy (ITDP) attacks this assumption head-on.  

Per dollar of transit investment, and under similar conditions, Bus Rapid Transit
leverages more transit-oriented development investment than Light Rail Transit
or streetcars.

What really matters to transit-oriented development [TOD] outcomes?  According to the report, the #1 predictor is strong government support for redevelopment, while the #2 predictor is real estate market conditions.  The #3 predictor is the usefulness of the transit services — frequency, speed, and reliability as ensured by an exclusive right of way.  Using rail vs bus technologies does not appear to matter much at all.

While BRT is is having overwhelming success across the developing world, ITDP's argument is aimed at North America, so it rests on North American examples.  Cleveland's HealthLine, a practical urban BRT linking two of the city's strongest destinations, emerges as a great urban redevelopment success story as well as the overall highest-quality BRT service in the US.  Las Vegas, Ottawa,  Eugene, and Pittsburgh's eastern line all play key roles in the argument.  Las Vegas, whose busway is incomplete but is in exactly the right place to serve heavy demand, is one of the most interesting stories, where BRT is playing a key role in the remarkable pedestrianization of what used to be one of the most famous car-only landscapes in the world.  

There will be plenty of quarrel over the details.  But this report does represent a "coming out" for the very concept of bus-based transit oriented development.  For too long, the identification of "transit oriented development" (TOD) with rail has bordered on tautological: if there wasn't rail, it was less likely to be called a TOD, no matter how useful the bus service was.  In fact, almost everything that's been built in every North American inner city has been TOD in the sense that bus service — usually of high quantity if not high quality — has been intrinsic to the neighborhood's appeal and functioning.

This is not to say that I agree with ITDP's anti-rail view.  I support many exclusive-right-of-way light rail projects, and I am not anti-rail except to the extent that rail partisans insist on being anti-bus.  In most North American cities, if you're ideologically anti-bus, then you are hostile to most of your city's transit system, and to most of what transit can practically achieve in the near future at the scale of the whole city.  Great transit networks are those where all the modes work together to maximize everyone's liberty.  All claims for the hegemony of one mode over another are distractions from creating the most effective transit for a city as a whole.

But technology wars meet so many human needs that they will always be with us, and so given that it's best they be as balanced as possible.  Bravo to ITDP for having the courage to speak up about the redevelopment value of highly useful and liberating transit services, regardless of what's going on under the floor.

great american “metro areas”

When any US study or journalist refers to “metro areas,” they probably mean this:

KaweahGap

DSCN1102

DSCF3808

Mantanuska

Melakwa_Lake

DSCF4221

These are all photos of US Metropolitan Statistical Areas (MSAs).  Many, many national studies — most recently the Brookings study on “transit and jobs in metropolitan America” — mean “MSA” when they say “metro area.”

MSAs, however, are aggregations of counties. They’re the red patches on this map:

Core_Based_Statistical_Areas
Counties come in all kinds of weird sizes, and are usually irrelevant to anyone’s lived experience of a metro area.  Eastern US counties are mostly small, so MSAs there are often credible.  But western counties are often huge, so MSAs have to be huge too.  Almost two-thirds of California’s land area is a metro area by this defintion, including the “Riverside-San Bernardino-Ontario MSA,” which contains most of the Mojave Desert.  Metro areas in America include the Grand Canyon,  a big chunk of the Everglades, and the vast Voyageurs wilderness of northern Minnesota, accessible only by canoe or snowmobile.

So when the Brookings Institution, for example, declares that Riverside-San Bernardino is doing poorly on transit travel times to work, they’re referring partly to travel times from Needles to Riverside, a distance of about 230 miles (370 km) over open desert.  They’re also implying that there ought to be intense transit service between the Riverside area and the Palm Springs area, even though locals largely experience these as two different metro areas.  (Their centroids are 50 miles apart, the towns between are mostly semi-rural in nature, and if those facts don’t convince you, there’s also a 10,000-foot mountain in the way.)  What matters to the MSA is that the two metro areas are in the same counties as Riverside-San Bernardino, so nothing else about their lived geography can possibly matter.

A deeper problem arises when all the demographic statistics of an MSA are declared to be features of a “metro area.”  Consider the Visalia-Porterville MSA, site of the top photo above.  The MSA, identical to Tulare County, has a 2000 population of 368,000.  All of these people are counted in MSA-based statistics about “metropolitan America,” but only about half of them live in a city over 50,000.  The other half live in much smaller towns and in rural areas.  (The rural areas also have high labor needs, so they support semi-mobile populations, validly picked up by the census, that have no relationship to any city.)  A fundamentally rural and small-town culture, indistinguishable from many other entirely rural counties, is being described as metropolitan whenever the Visalia-Porterville MSA is referenced as part of generalizations about “metropolitan America.”  This culture is not just small and easily dismissed statistical “noise.”  It’s half of the population of the MSA.

This is one of those absurdities that we’re trained to think of as eternal.  Many weird and misleading boundaries (e.g. some counties, city limits etc) are going to persist even if they have no emotional or cultural meaning, simply because influential people are attached to them as a matter of self-interest.  But how many people are really attached in this way to MSAs?  And is it really impossible, with all the increasingly detailed information in the census, to describe metro areas in a more subtle and accurate way?

Even if we’re stuck with them, is it really appropriate to keep saying “metro area” when you mean MSA?  It’s statistically convenient given how much data is organized by these crazy units.  But are you really misleading people about what a metro area is?

In the sense that usually matters for urban policy, “metro area” means “the contiguous patch of lights that you can see at night from an airplane or satellite.”  You can approximate this with census blocks.  Their technical definition is something like “any agglomeration of contiguous census blocks that all have a non-rural population or employment density.”  Census blocks are small enough that they can aggregate in a way that follows the geography, connecting what’s really connected and separating what’s really separate.  Defining “metro area” in that way would finally mean what ordinary people mean by “metro area.”

What’s more, it would really cut down on bear attacks in “metropolitan America.”

Photos:

  1. Kaweah Gap, Sequoia National Park, Visalia-Porterville MSA, California.  Credit: Davigoli, Wikipedia.
  2. Lake Mead National Recreation Area, Las Vegas-Paradise MSA, Nevada.  (my photo)
  3. Duck Lake and High Sierra, John Muir Wilderness, Fresno MSA, California.  (my photo)
  4. Matanuska Glacier, Anchorage MSA, Alaska.  Credit: Elaina G, via Google Earth.
  5. Melakwa Lake, Alpine Lakes Wilderness, Seattle-Tacoma-Bellevue MSA, Washington.  Credit: Wikipedia.
  6. Joshua trees in open desert southwest of Las Vegas, Las Vegas-Paradise MSA, Nevada.  (my photo)


The Perils of Average Density

In his 2010 book Transport for Suburbia, Paul Mees notices a fallacy that seems to be shared by sustainable transport advocates and car advocates.  Both sides of this great debate agree that effective transit requires high density.

Sustainability advocates want higher urban densities for a range of reasons, but viability of public transit is certainly one of them.  Meanwhile, advocates of car-dominance want to argue that existing low densities are a fact of life; since transit needs high density, they say, there’s just no point in investing in transit for those areas, so it’s best to go on planning for the dominance of cars.  Continue Reading →

Line Numbering: Geek Fetish or Crucial Messaging?

Commenter Mike recently laid out a nice explanation of the line numbering system in Aachen, Germany, and then asked, fatefully:

How do professionals assign line numbers?

The answer is:  Much as geeky amateurs do, when drawing imaginary networks.  It’s a process of (1) imagining beautiful systems of order, and (2) willing them in to being.  Unfortunately, real-world professionals have to proceed through the additional steps of (3) clashing with proponents of competing systems, (4) enduring the derision and sabotage of anarchists, and finally (5) resigning to a messy outcome where only traces of beauty remain, visible “between the lines” so to speak, for those still capable of enchantment. Continue Reading →

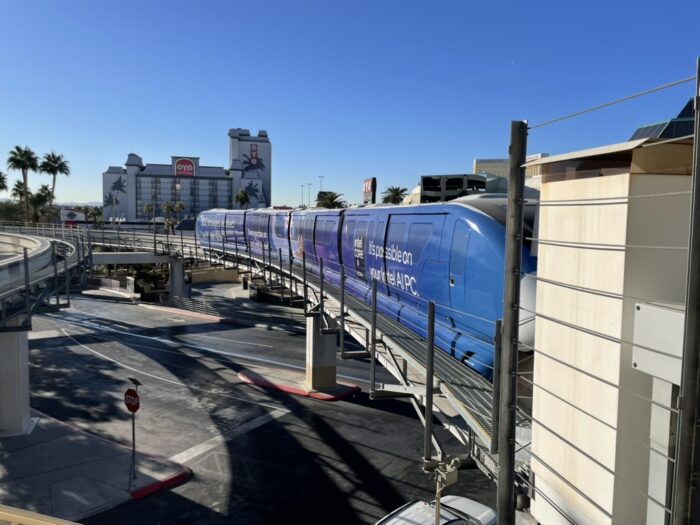
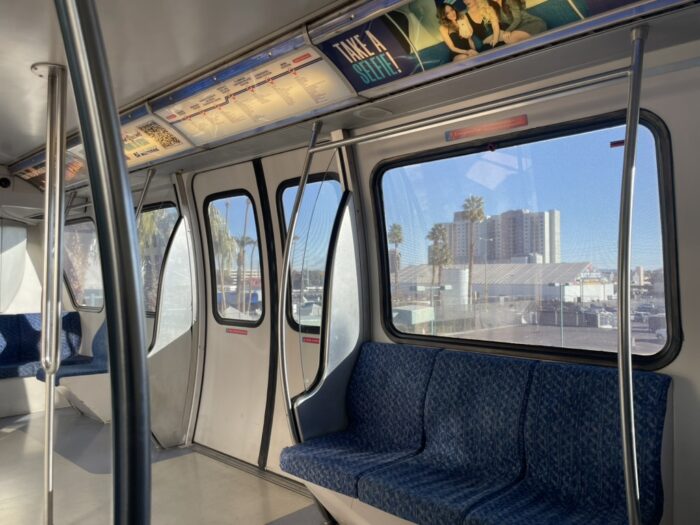
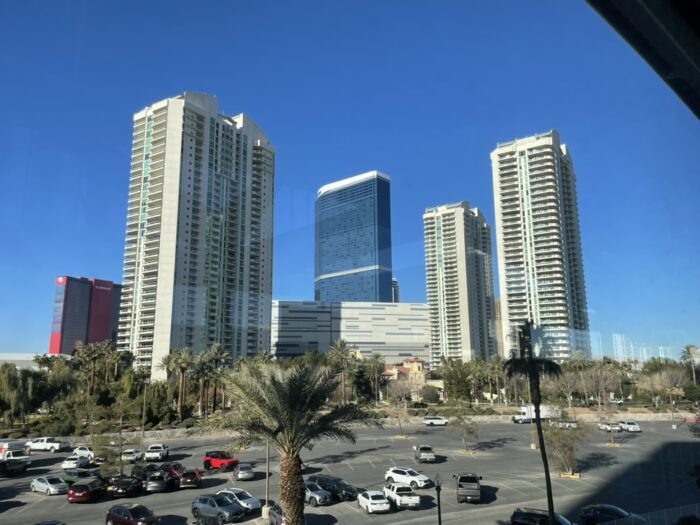
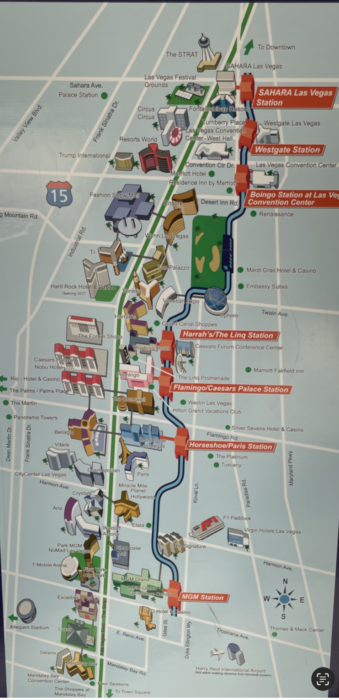
Learning, Again, From Las Vegas

DSCF9181
Tired of arguing about streetcars?  Let’s take a break and talk about something we’re more likely to agree on — Las Vegas!

While the city plays a crucial role in American culture as a test-site for exotic street names, I suspect we’d mostly agree that it’s not going to be a leader in sustainable urban form anytime soon. While the grid pattern of the city has some advantages (more on grids soon), Las Vegas has a particularly bad habit of building blocks of apartments in places where efficient transit will never be able to serve them and where basic commercial needs are still too far to walk. Thus achieving all of density’s disadvantages and none of its benefits.

But there are surprises.  I just completed my annual trip to Las Vegas, to see family there, and thought I’d update this 2007 item from my personal blog about this capital of churn:

Continue Reading →