Can good planning help address the grievous problems of the Palestinian territories, including the challenge of conceiving its patchwork of lands as a viable state? My friend Doug Suisman, a Los Angeles architect in private practice, has been working on the problem for years, through a remarkable project called the Arc. The New York Times profiled it five years ago. Despite all the bad news from Israel and Palestine since then, the work has continued. The idea is to have a plan for the urban structure and transport infrastructure of a Palestinian state, something that’s ready to go when an independent state is created and that can even be part of the run-up to independence. Continue Reading →
Strategic Transit Planning
u.s. transit capital funding: a big picture?
An email asks a seemingly eternal question, from reader Aaron Brown:
I … wanted to reach out to see if you’d be willing to provide any thoughts on the massive capital funding backlogs that major transit systems face here in the US. The latest reports I’ve seen throw around numbers above $50bn just to bring systems into a state of good repair, excluding any expansion. Given the current condition of local, state, and federal budgets, this number seems extremely daunting to me.Here in Chicago, for instance, we have a pretty solid transit system (relative to most US cities), but one that is old and badly in need of repairs. Again, however, the amount need just to bring the system to a state of good repair ($7bn for the CTA alone) seems overwhelming. We have aging buses and railcars, tracks and ties in need of replacement, and an L system with structures over 100 years old that are all competing for limited funds. And this is in a city and transit system that is seeing record ridership and will need to expand over the next few decades to serve one of the largest (and growing) metro areas in the country. Continue Reading →
Willingness to Pay for Transit Improvements
Do your city’s political leaders understand what funding sources people would support if they knew what they were buying? A few weeks ago, the Source (a blog by the Los Angeles transit agency Metro) reported on a survey showing that current riders would pay 50c more in fares for a doubling of their frequency of service. This isn’t as encouraging as it sounds, because a doubling of frequency, even with significant ridership increases as a result, will cost a lot more than 50 cents per new rider. But it’s a useful soundbite. These questions, broadly called “willingness to pay” questions, need to be asked more, and more probingly. Continue Reading →
Sydney: Grid Networks for Gridless Cities
Whenever I talk about the value of grid networks, as I did here, someone always says: But my city isn’t a grid. For example, Sydney, where I live now, is about as ungridlike a city as you’ll encounter. In fact, there’s no large system of order in Sydney’s road network at all. Some roads follow what were once Aboriginal tracks, but mostly it just grew, one bit at a time, an accretion of millions of short-term decisions.
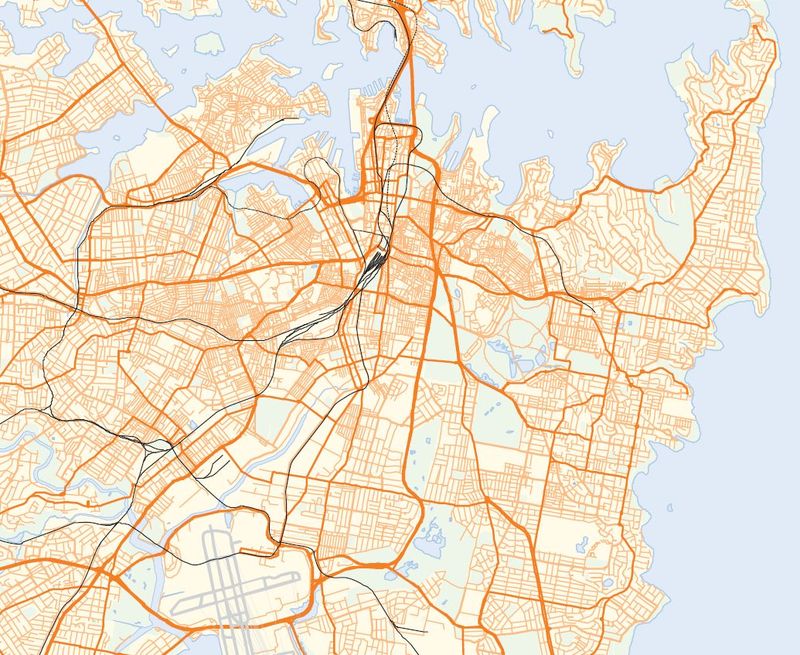
One of Sydney’s biggest problems is that the road network is so focused on the CBD (the Central Business District located top-centre in this image) that traffic is forced into the CBD that doesn’t want to be there. But the problem is much, much worse if you’re a transit passenger. As part of the Sydney Morning Herald‘s Independent Public Inquiry, discussed here, I did a quick review of the inner-city bus network looking for the pattern of frequent service — service that runs every 15 minutes or better all day. The frequent network is the portion of the network where you don’t have to worry about a timetable, and where transit can therefore be used with some sense of spontaneity and freedom. To my knowledge, nobody had drawn a map of inner Sydney’s frequent network before. It turned out to look like this:
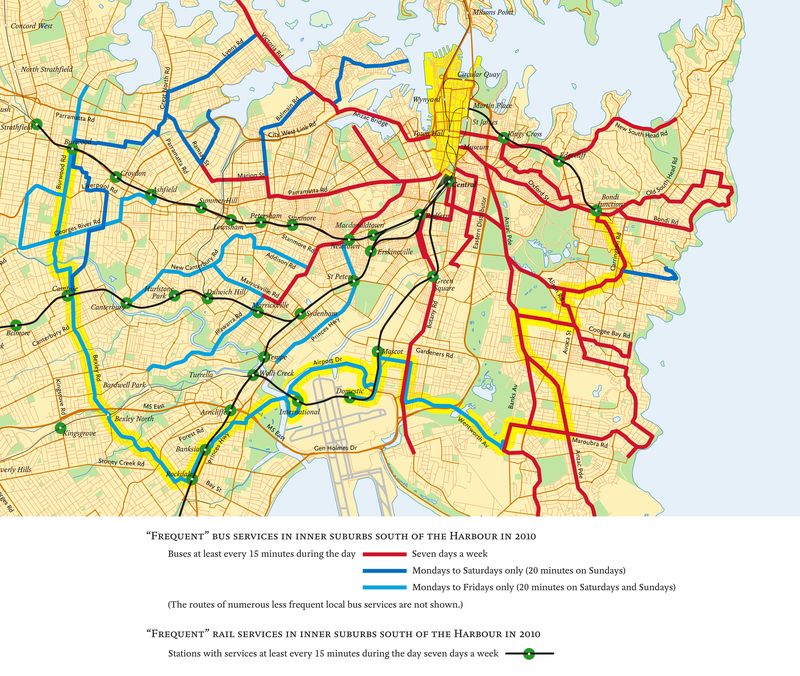
If you want to get around with any spontaneity in the inner part of Sydney — where densities are highest, obstacles to driving are greatest, and car-free lifestyles should be most attractive — the network forces you to go through the CBD (the yellow wedge on the north edge of the drawing). In the whole inner city of Sydney there is only one frequent crosstown or orbital service — one that runs perpendicular to the radial lines, like the circular element of a spider web. It’s highlighted in yellow. By contrast, most major North American and European cities have a whole grid of these orbital services; they are often the most productive routes in the network, in terms of ridership per unit of operating cost.
As part of the inquiry, I sketched a map to give just a taste of what an inner city frequent grid network might look like for Sydney. It’s not a proposal, just a possible starting point for thinking about one. But if you can’t imagine doing a grid network in a gridless city, you might find it interesting to stare at for a bit. (All this is in the Preliminary Report of the Inquiry, in Section 4.2, and readers interested in the local detail are encouraged to dig there.)
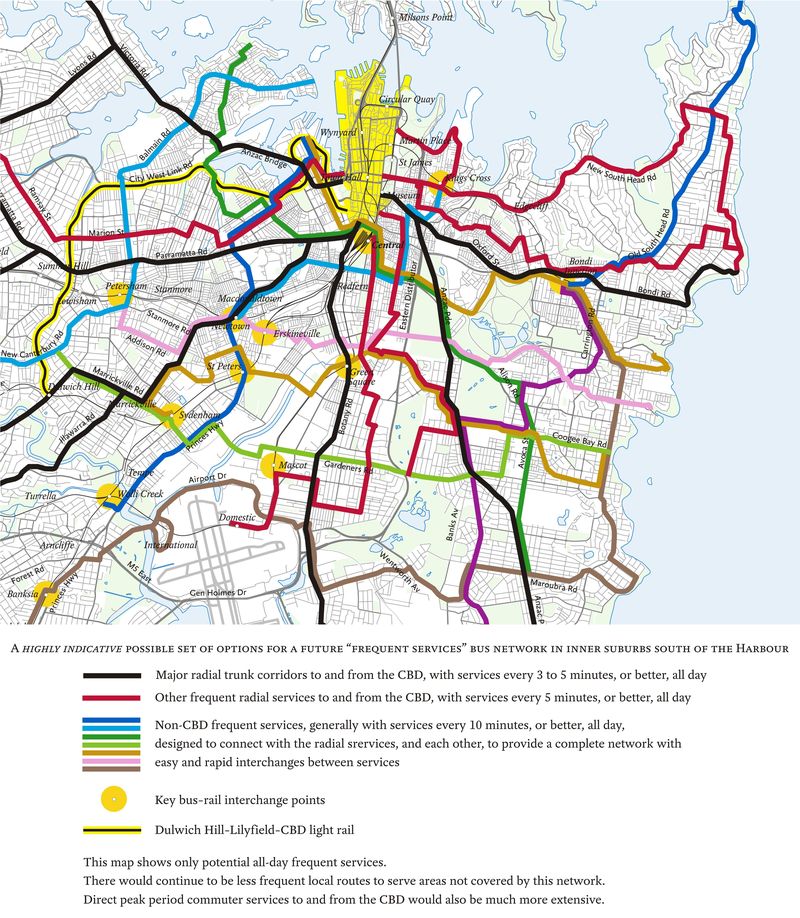
Sydney’s road network is so radial, and the CBD is such a large destination, that the grid takes more of a spider-web form (as defined here). I highlighted this in the diagram by using black and red for radial lines and all the other colours for orbitals, so that people could see how orbital services might work and how they could all fit together, with each other and with commuter rail and light rail, to form a complete inner city network.
But in the middle part of the map you’ll notice some lines that do try to run straight east-west, even though the lacerated street network requires you to make many turns to keep going the same direction. As I explored in more detail here, most grid networks involve a fusion of standard rectangular grid lines and spider-web (or polar grid) lines. The rectangular lines express a “serve everywhere” impulse, while the spider-web lines express a “focus on the centre” impulse. Network design is a process of finding the balance and making them work together.
There are many ways to design such a pattern for Sydney. A detailed planning effort would feature months of work exploring various options, but what I sketched here, based on three years’ observation of the inner city and about three hours of focused thought, is at least a step toward visualizing the future.
So yes, your city may not be a grid. But still, if you want a transit network that’s useful for going at high frequencies from anywhere to anywhere, the answer will be some kind of grid, built on connections, with some mix of rectangular and spider-web elements, all fitted with more or less struggle to the unique shape of your city.
vancouver: the almost perfect grid
In the last post, which explains why grids are such an efficient structure for transit, I mentioned that Vancouver has one of the best transit geographies I’ve ever encountered. Here’s what I mean.
A grid pattern of arterial streets covers almost all of Vancouver. Most of the time, parallel major streets are spaced about every 800-1000m apart, and since a comfortable walking distance is about half that, this spacing is perfect for efficient transit. Continue Reading →
Sydney: An “Independent Inquiry” on Public Transport
For the last four months, I’ve been part of a team looking at the big-picture problems of public transport in Sydney, sponsored but not controlled by the city’s main newspaper, the Sydney Morning Herald. We released the draft report today, so I can finally talk about it. Continue Reading →
Long-term Transit Plans: Asking the Real Questions
For several years I worked on a Strategic Public Transport Network Plan for Australia’s national capital, Canberra, so I’m happy to report that the plan has now been released for public comment.
The concise Executive Summary pulls together a number of key ideas about long-term transit planning that I’ve found useful in many cities, so even if you don’t know or care about Canberra you might find it interesting.
The most important single idea in the plan (as in much of my long-term planning work) is the Frequent Network, which consists of services that will run every 15 minutes or better all day, every day of the week. This is the level of service that can motivate people to choose a transit-dependent lifestyle, because it assures you of the ability to get around without building your life around schedules. The proposed Frequent Network includes Rapid service (red lines in this image, stopping at “stations” every 1 km or so, averaging 40 km/hour) and Local service (orange, stopping every 200-400m, averaging 20 km/hour). (As always, click image to enlarge.)