For the past 18 months, we have been redesigning the bus network for Miami-Dade County, Florida with the local advocacy group Transit Alliance. As the final public engagement phase was coming to an end, the pandemic reached the United States, and like many other agencies, Miami-Dade Transit went into crisis management mode. So our work paused for about four months.
As the pandemic wore on, it became apparent that the agency needed more than a single transit network ready to implement. It needed a plan that could adapt to a range of unpredictable futures. Nobody knows how long the pandemic will go on, or what affect it will have on tax revenues that the agency relies on.
So, in finalizing the Better Bus Network, we worked with county staff and Transit Alliance to develop a Resilience Plan, to guide future decisions about how to ramp service up or down in the face of an unknown future.
But first, let’s talk about how we got here.
In the first phase of the project, we developed a Choices Report to analyze the existing network and discuss key questions that determine how the network should be designed. We took input from the public about those questions and developed two concept networks that highlight the tradeoffs between focusing on coverage and focusing on ridership. We returned to the public to ask them which way they lean between these the two concepts. Remember that it’s never one or the other; the ridership and coverage concepts represent two ends of a spectrum. Based on public input, we designed a Draft Network that was halfway between the two Concepts and now we revised it into the Final Network.
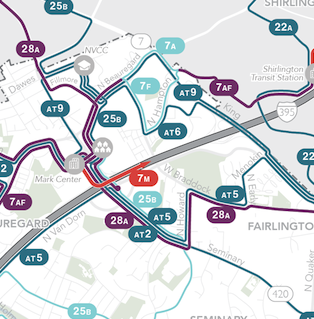
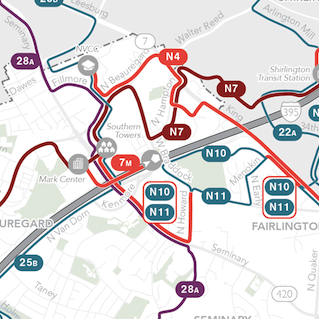
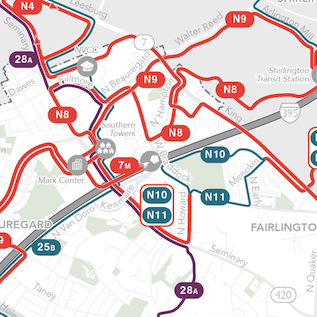
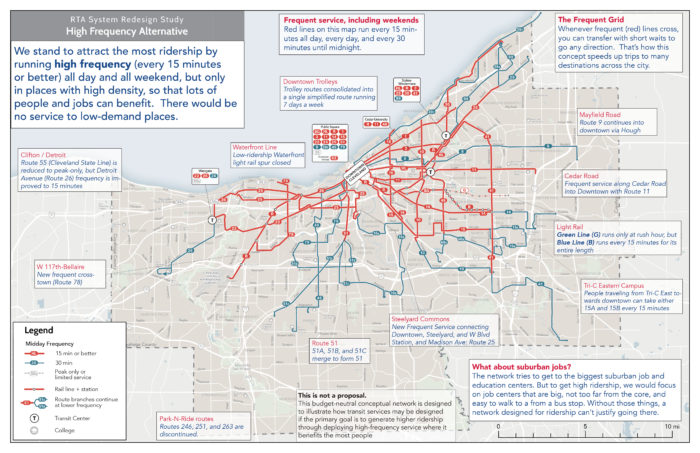
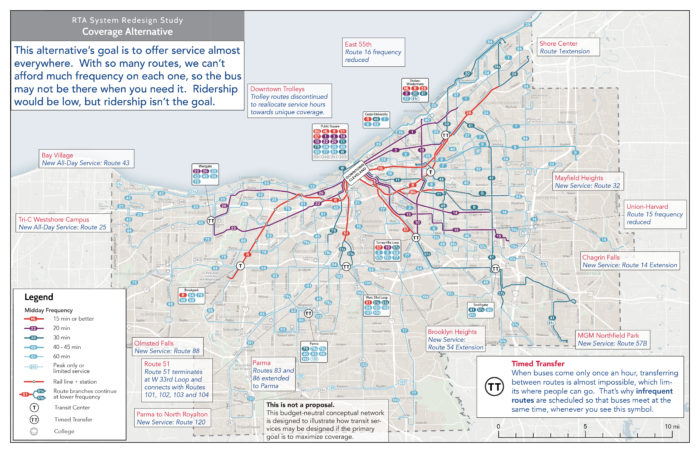
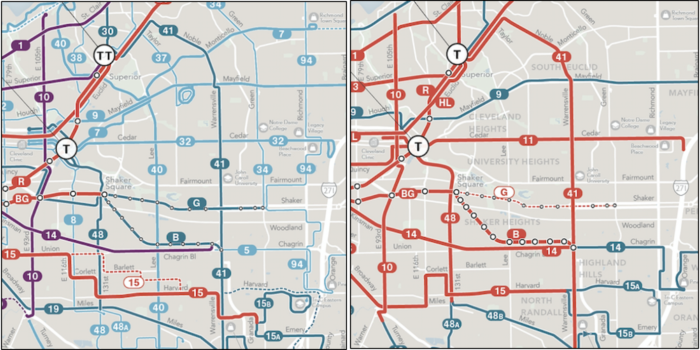
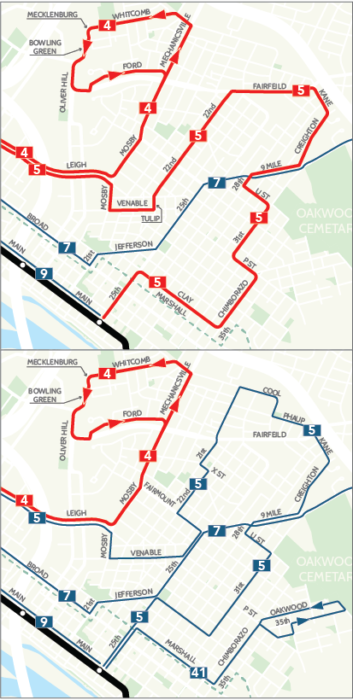
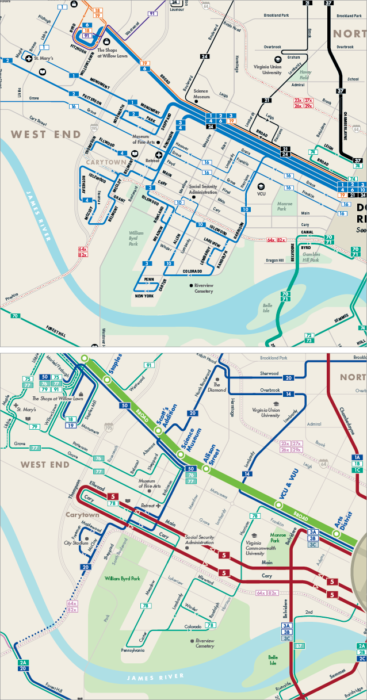
Below are slices of the Existing Network and New Network for the core of the region (click the maps to see the full-size maps of both networks).
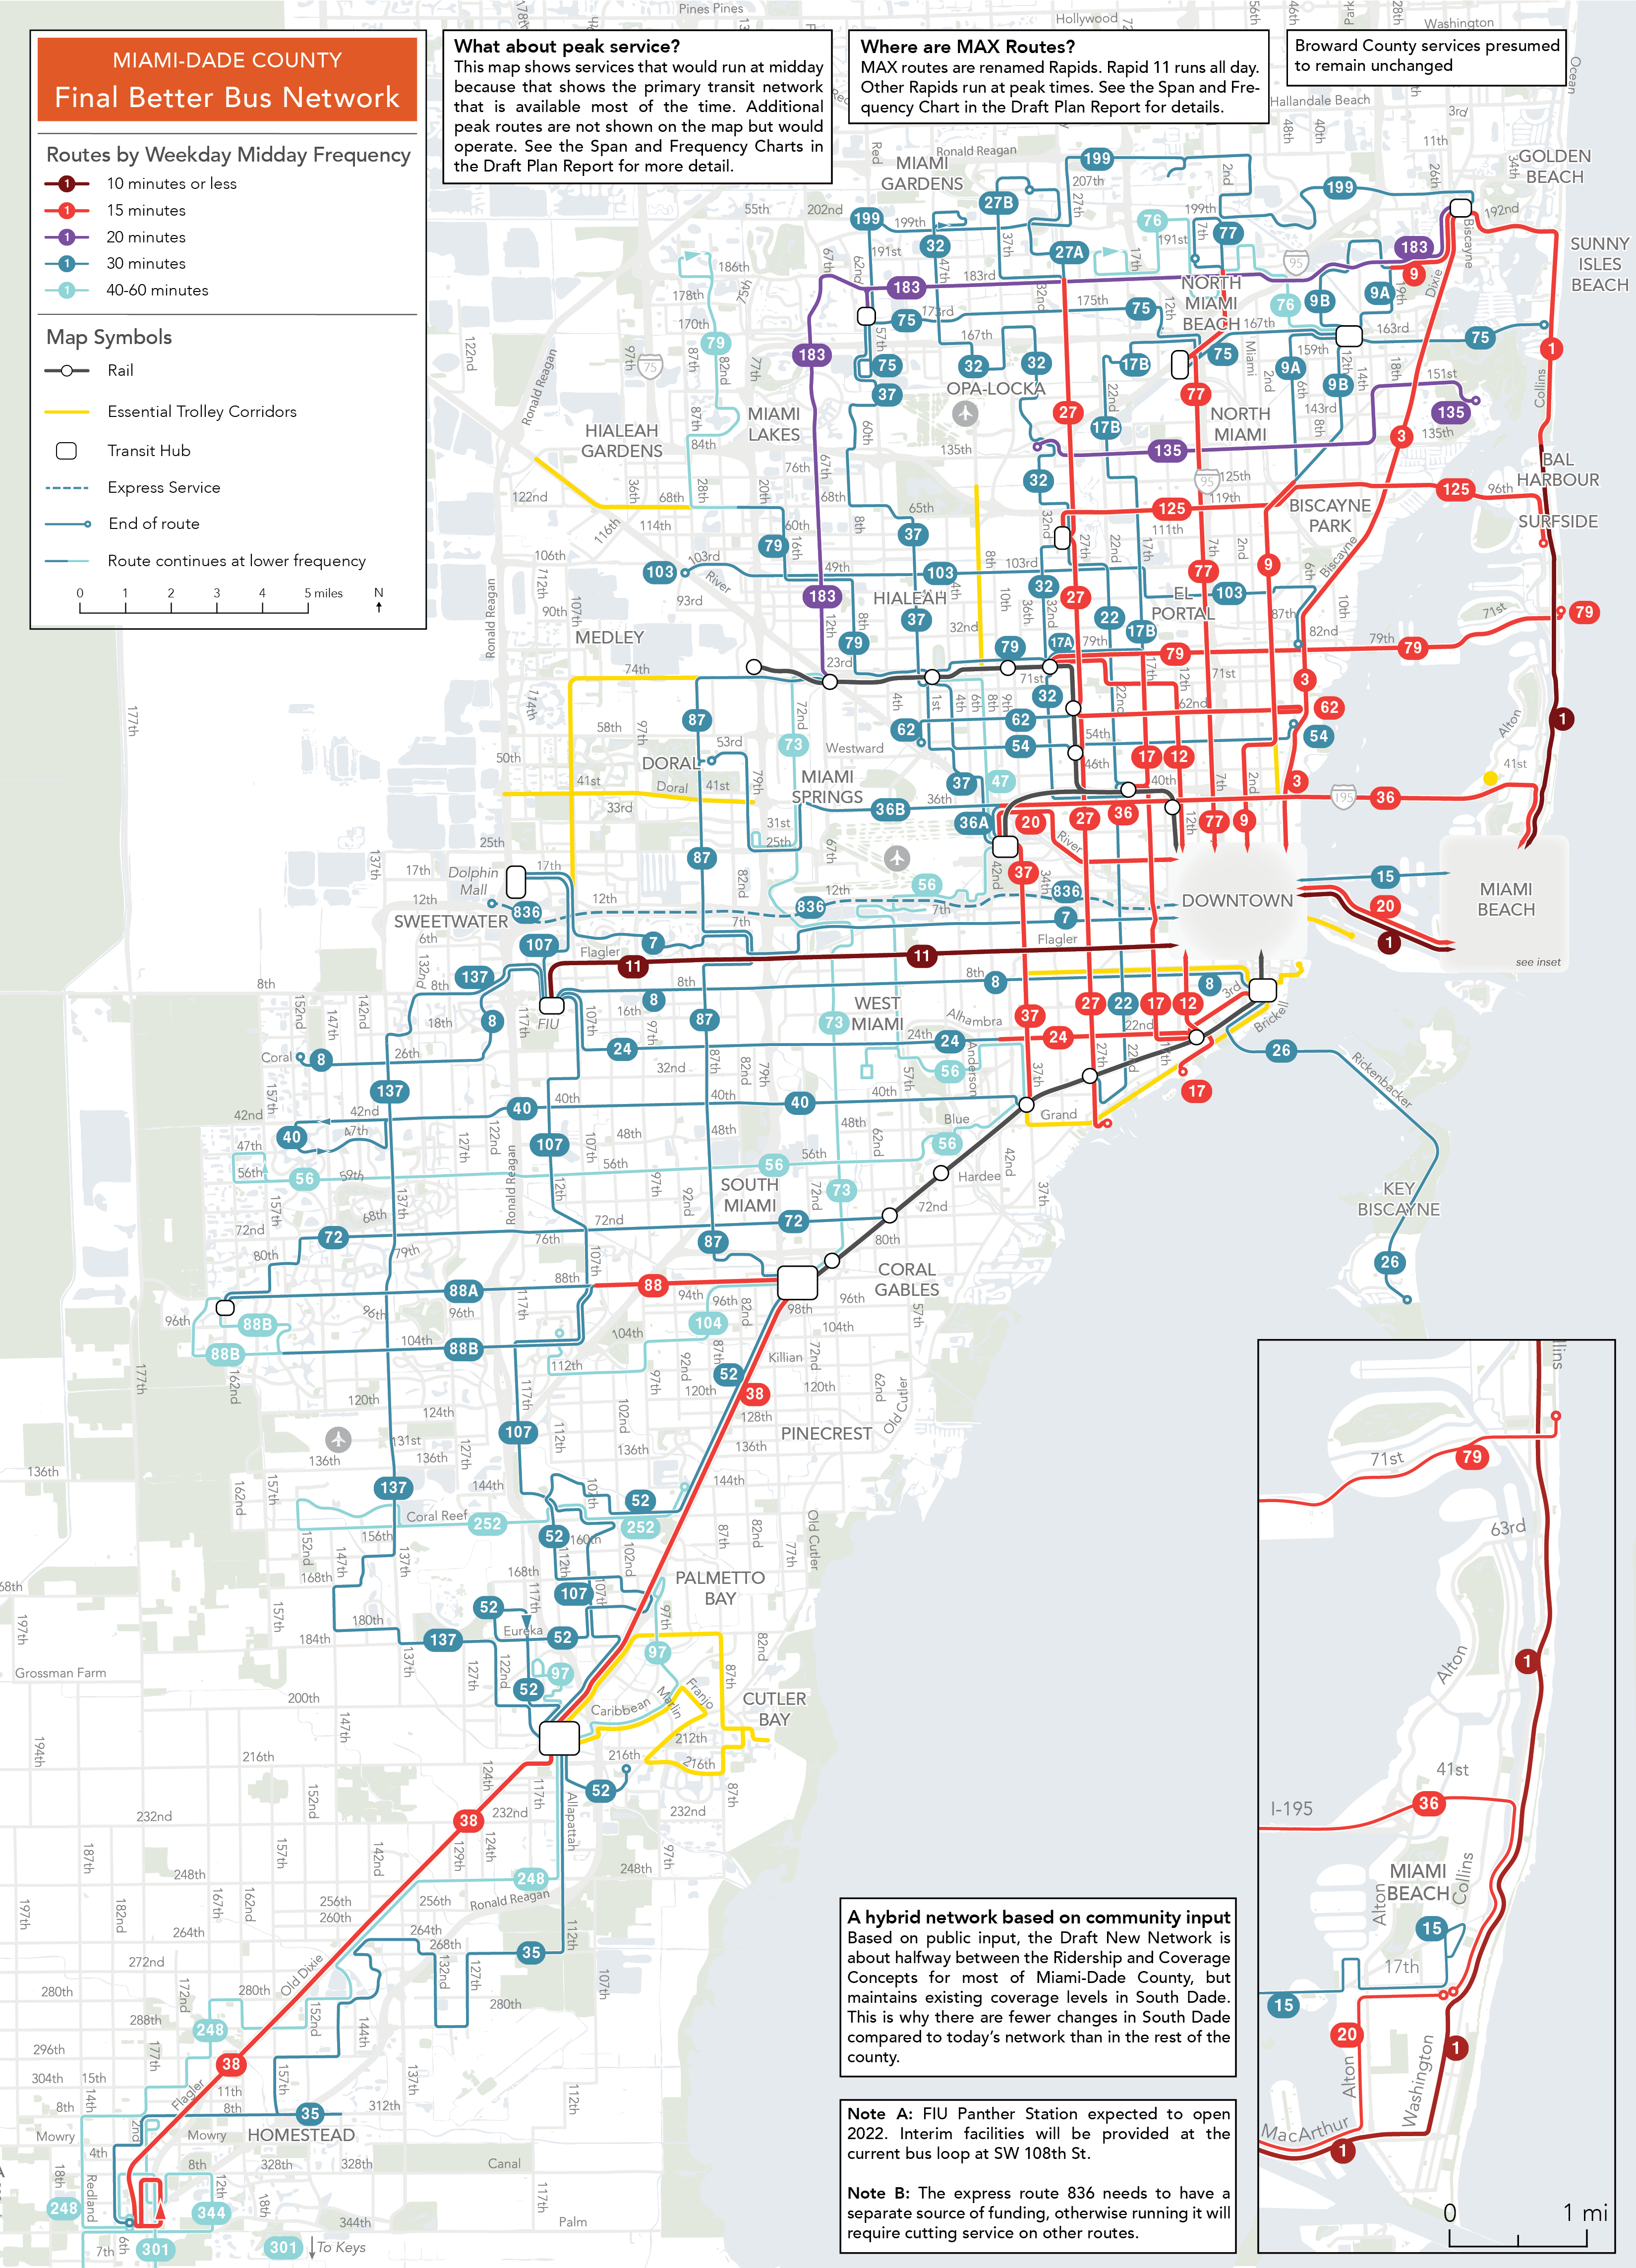
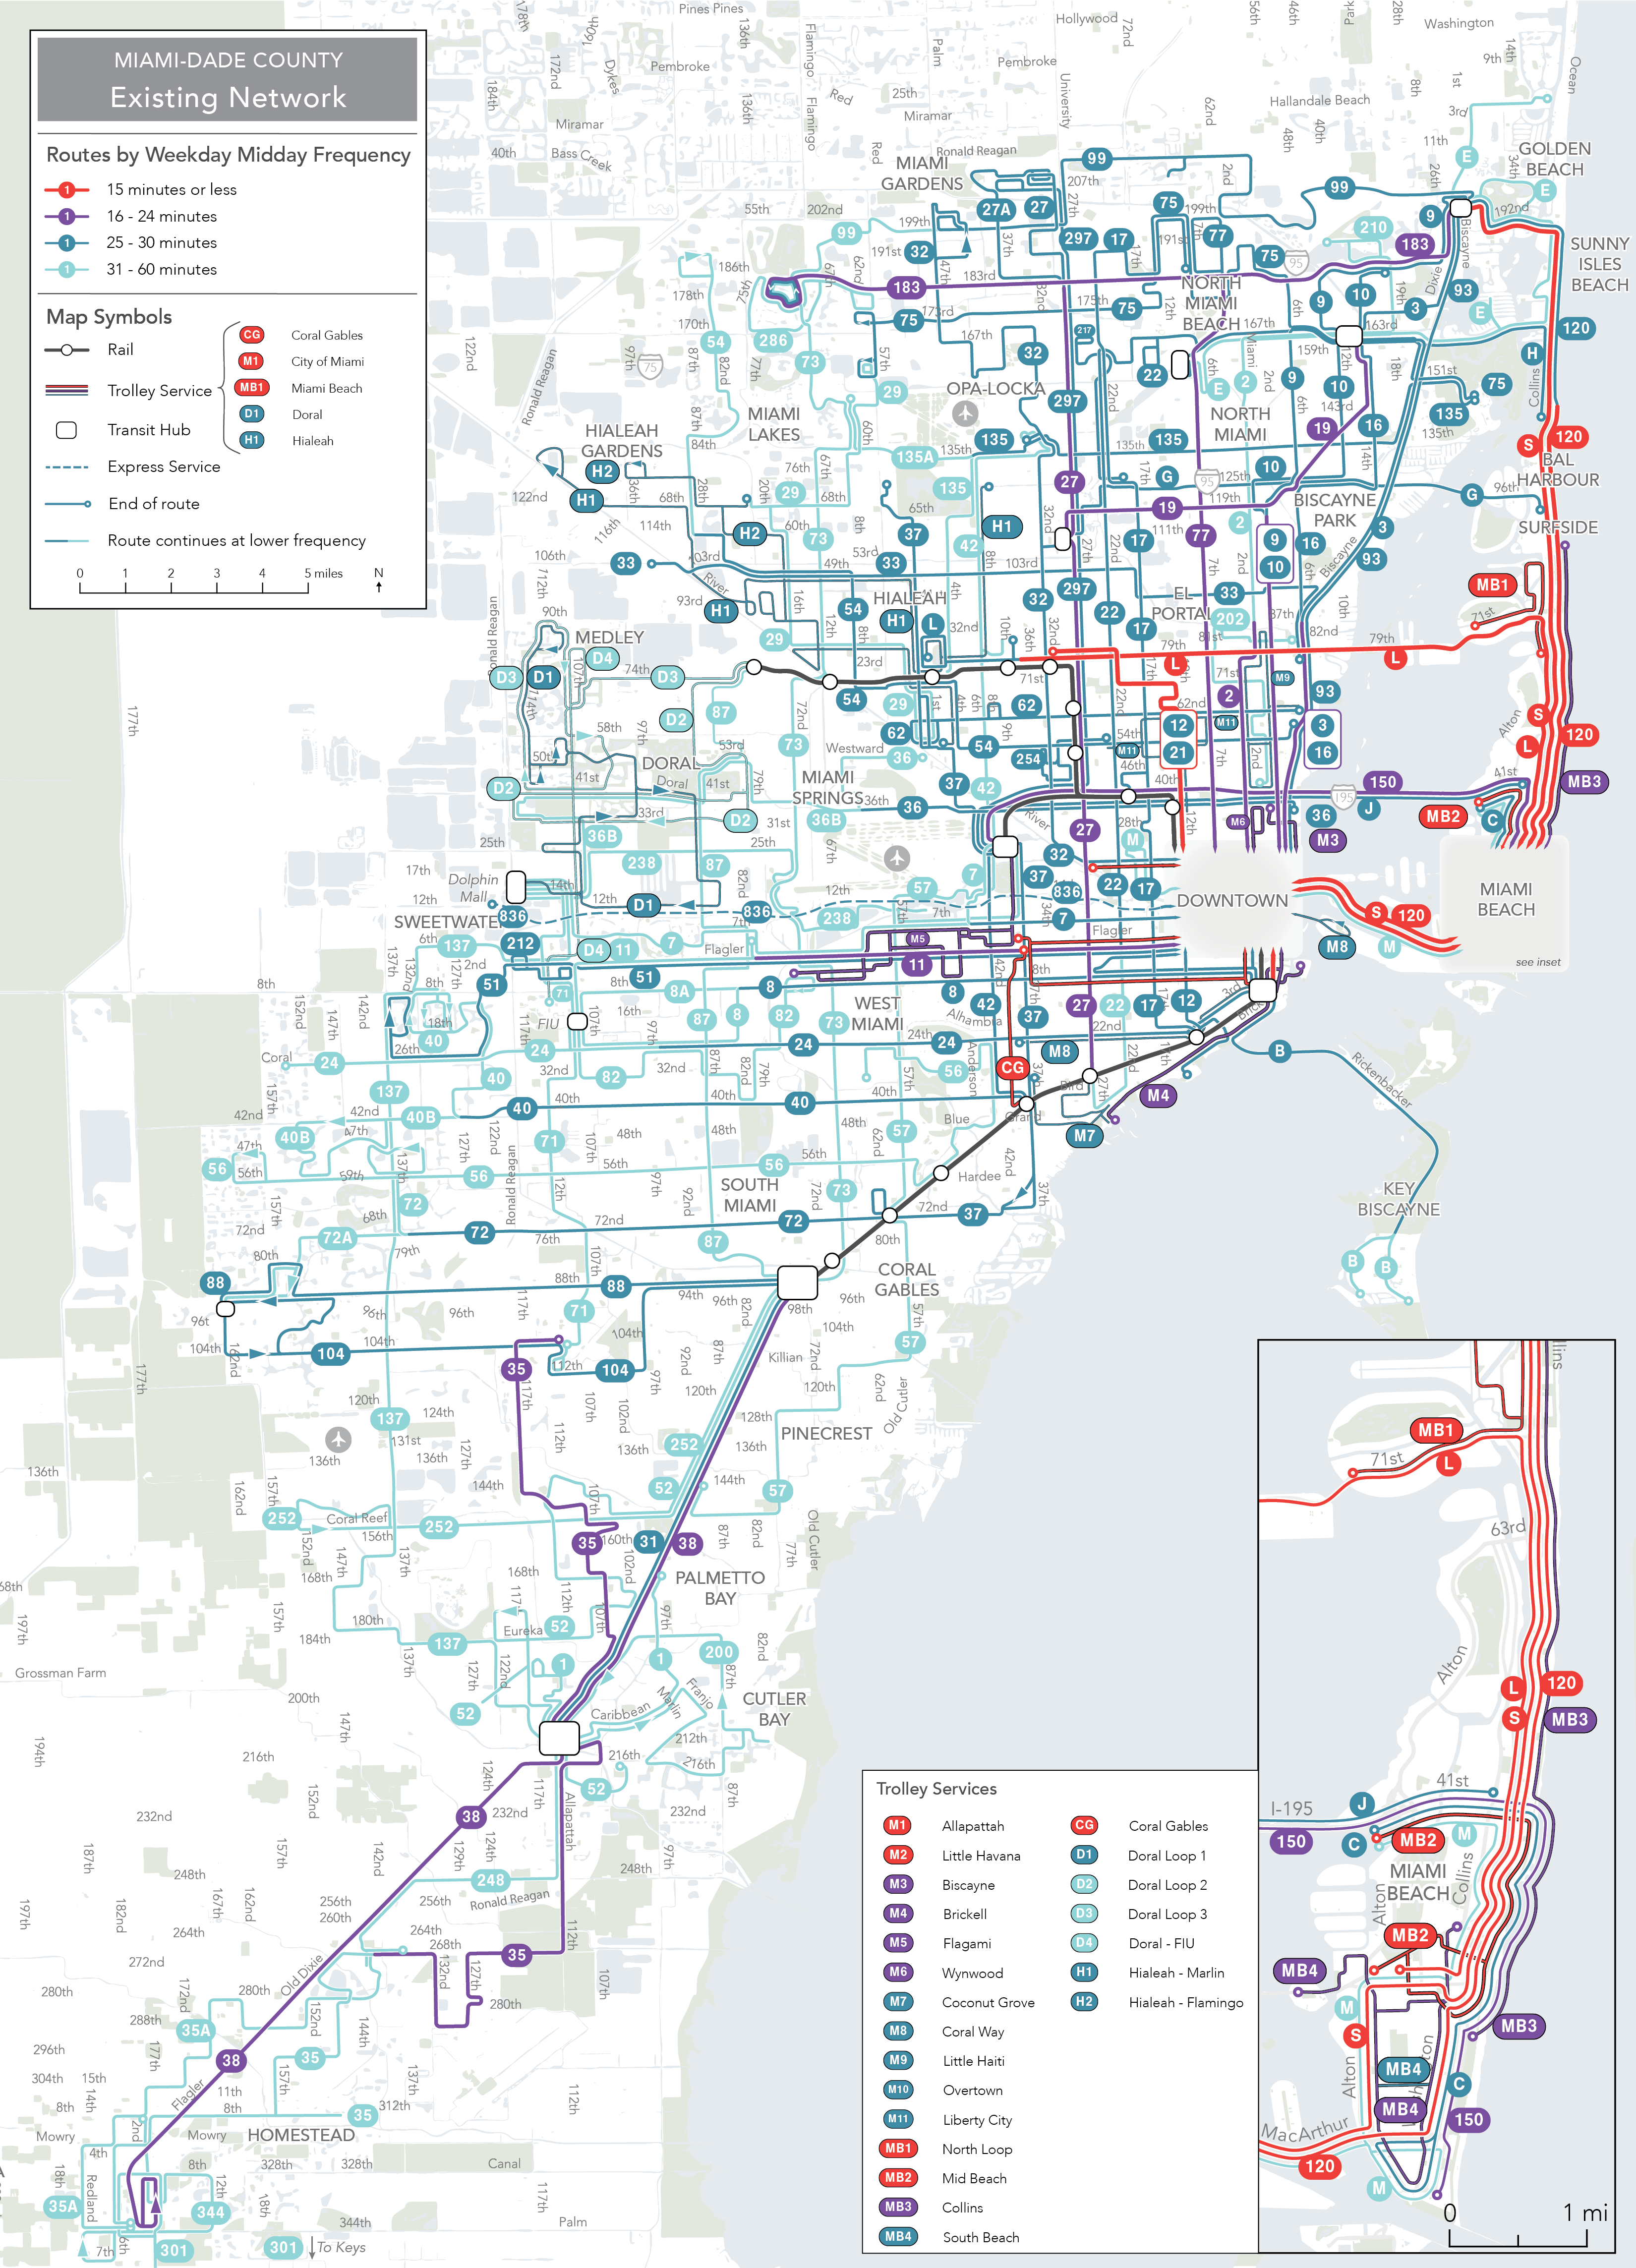
A comparison of the maps of the Existing Network and the Final Better Bus Network in Miami-Dade County, Florida. Note the line colors, which indicate midday frequency.
Click here for the full map of the Existing Network
Click here for the full map of the Final Better Bus Network
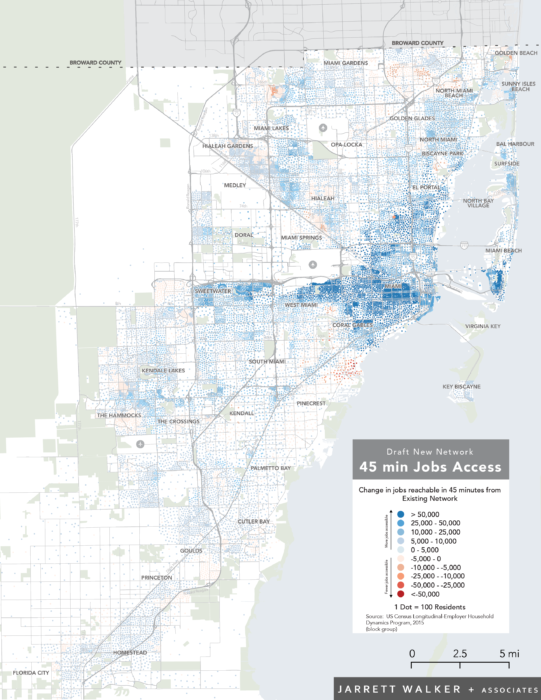
The New Network creates a frequent grid that helps residents get to more places sooner. In this network, 353,000 more residents are near a frequent route (an increase of 13% over the existing network). With the new network, the average resident can reach 36% more jobs in 45 minutes by walking and transit.
The frequent grid means that it is easier for people to make connections between routes allowing them to get to many more places in a reasonable amount of time. The following animation shows where someone can get to in 45 minutes by walking and transit from Liberty City (NW 12th Avenue and 62nd Street). The gray area shows where someone can get to with the Existing Network and the light blue area shows where they can get to with the New Network. With the Better Bus Network, someone living in Liberty City can get to 60% more jobs and 50% more people. This is what we mean by access to opportunity.
This map shows the areas reachable from Liberty City within 45 minutes using the Existing Network and using the redesigned Final Network
This vast expansion in access is only possible because of the frequent grid. This means that if Miami-Dade Transit has less revenue but wants to maximize access like this, they have to protect the frequent grid. That is what the Resilience Plan does. The network’s corridors are divided into tiers to establish what service should be provided at different levels of revenue.
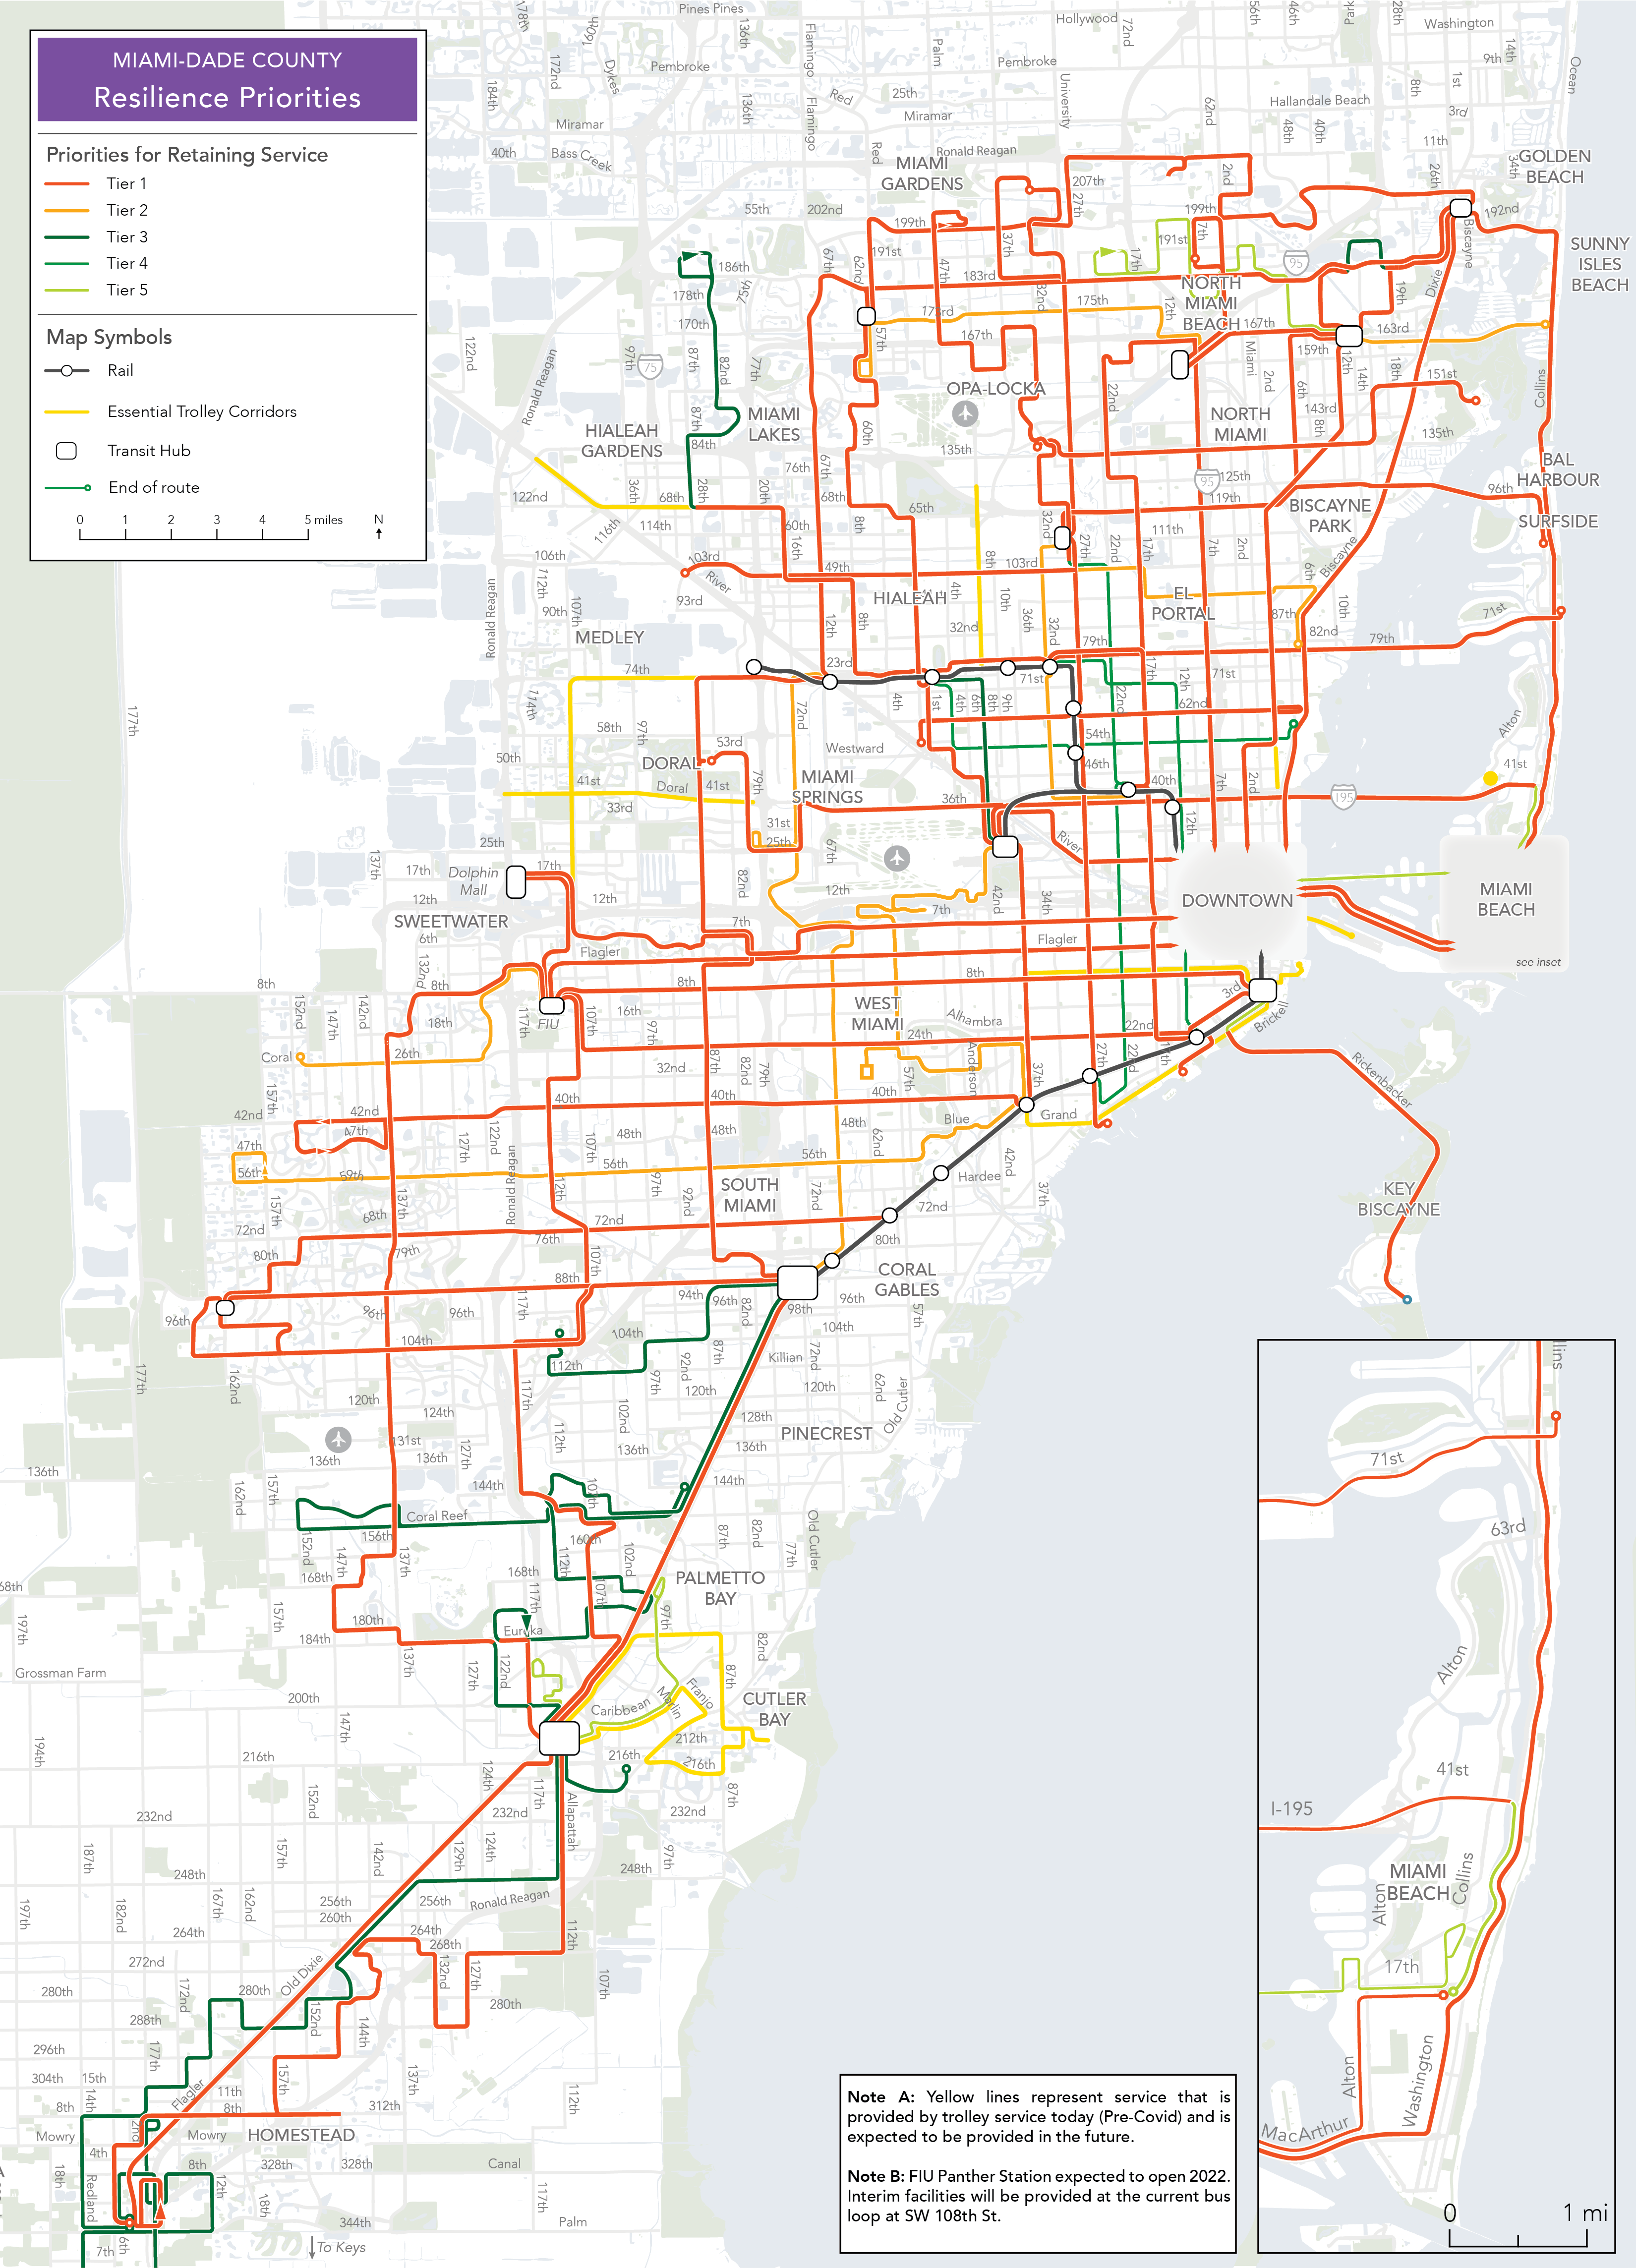
The Resilience Plan protects the frequent grid in case of budget shortfall.
In the grimmest financial scenario (Tier 1), the network would keep only frequent corridors spaced every mile, and a few coverage routes that are critical to ensuring equitable access. Yes, this network will make people walk longer distances. But when they get to a route, a bus is always coming soon. If the County has more revenue, they can add the service in Tier 2 and so forth.
Nobody wants to see these service cuts, but if they become necessary, MDT will be able to minimize the damage to people’s access to opportunity by using the Resilience Plan. On the other hand, if MDT did service cuts the usual way – by leaving the routes as they are but cutting frequencies – access to opportunity would decrease drastically. Consolidating routes to make them more frequent can actually make people’s trips faster, despite the longer walks.
This Final Network is now in the hands of the County Commission to endorse and, if approved, to be implemented by Miami-Dade Transit. There will likely be additional opportunities to comment on this plan before it is implemented. If you’re in Miami-Dade County, remember to submit a comment or tell your Commissioner about this Plan, particularly if you like it. Sadly, most of the public comments received on transit plans are negative even if the plan is broadly popular, because people who like it falsely assume it will happen anyway. This plan will not be implemented if it does not attract strong support. The County would like constructive comments about the plan, which will be used to make the final implementation even better. But if you like the plan, it’s important to say that as well!


