Are your transit authority and city government working together to make buses as functional and useful as possible? A new TRB report summarizes the industry’s own consensus on where the easy wins are for improving bus service. Peyton Chung has the rundown: Continue Reading →
On-Time Performance
san francisco: winning speed and reliability battles
Major San Francisco transit lines take longer than they did a century ago, as they have been obstructed by traffic and slowed by heavy passenger loads using (until recently) inefficient pay-as-you-board methods. A New York Times piece by Zusha Elinson lays out the statistics.
(It's important to clarify, right away, that this has nothing to do with streetcars as a technology. You could easily be misled by this subtle bit of anti-bus bias:
In 1920, the F-Stockton streetcar carried passengers from the Financial District at Market and Stockton Streets all the way to the Marina at Chestnut and Scott Streets in a zippy 17 minutes. Today a very similar trip on the 30-Stockton, the successor to the F-Stockton, takes a half-hour if the stars are properly aligned.
In general, streetcars replaced by buses have slowed down more, over the last century, than those that remained streetcars, but that's an expression of how much more was invested in streetcars than in buses. The main lines that use the Market Street Subway — J through N — have picked up or shed just a couple of minutes from their 1920 times, even though back then they ran on the surface along Market St (about 3 miles) while now they're in a subway, effectively functioning as rapid transit. No such improvements were made for streetcars that became bus lines, so of course their performance deteriorated more. In fact, the 30-Stockton relies heavily on maneuverability in unpredictable Chinatown traffic; a streetcar in exactly the same traffic, unable to move around obstacles, would be even slower and less reliable.)
The real message of this story, though, is the need to have a conscious intention about the speed and reliability of transit. Highway planners ruled the late 20th century with their clearly defined notion of "Level of Service" or cars, which mowed down opposition through its simplistic A-F letter-grades. Just after 2000, the Transit Capacity and Quality of Service Manual sought, at first, to claim this same authority-through-simplification for transit. But while the TCQOS is a spectacular reference guide, few in the business believe that a single A-F score can capture the many important ways that transit succeeds and fails.
My own work in this area has always advocated a stronger, more transit-specific approach that begins not with the single delayed line, but rather with the functioning of an entire network. Don't just ask "how fast should this line be?" which tends to degenerate into "What can we do to make those forlorn buses move a little faster without upsetting anyone?" Instead, ask "What travel time outcomes do we need across this network?" Or turn it around: How much of the city needs to be within 30 minutes of most people? – a question that leads to those compelling Walkscore travel time maps, which are literally maps of individual freedom.
A network speed standard would identify necessary speed standards for each service type, but especially for the Frequent Network, because high frequency means greater impact of delay — both on passenger freedom and the agency's bottom line. We* used this approach in a Seattle Transit Plan study about 7 years ago:
1. Define the Frequent Network (every 15 min or better, all day, every day), including any segments that are "Rapid" (faster with fewer stops)
2. Define the policy operating speed standard for each product (frequent local vs rapid)
3. Map the existing scheduled speeds on each segment against this standard, creating a map with screaming red segments meaning "deficient."
4. Prioritize interventions to improve transit speed based on those deficiencies.
This is quite different from a classic cost-benefit approach in which we count the riders currently on a segment and assign value based on their total travel time saved, because it acknowledges that (a) a dysfunctional segment is probably driving away customers regardless of how many are on it now and (b) the outcome is the network, not just a single line.
We had a lot of success with this in Seattle at the time. Once the deficiency map was drawn, engineers noticed segments that they hadn't identified as problems before, and went to work on fixing them. Note too that the method cleanly separates problem from solution. Don't start with what you think is possible. Start with what you need. Define the absence of what you need as a citywide problem that affects the whole network. Then fix those deficiencies. If you're going to go to war with three businesses over "their" strip of on-street parking, you're more likely to break through the "big agency attacks struggling small business" frame if you're defending the entire city's transit system.
Remember: a line is only as reliable as its least reliable point, and a journey through a network is only as reliable as the least reliable of its lines involved. So one localized problem affecting speed and reliability (such as stops too close together) actually affects a vast area, and drags down public expectations for an entire network product. If it costs the agency money (as slower service always does) then it's also a direct detriment to the overall abundance of transit service. That's the frame in which you win battles over three on-street parking spaces, a signal phase, or even an entire tranist lane.
San Francisco's Transit Effectiveness Project is, to a great extent, the culimination of exactly this thought process. I remember in the 1980s or early 90s a time when Muni proposed to eliminate just one consequential bus stop; 17th & Mission. The story became: "Big, bad transit agency launches personal attack on the people and businesses at 17th & Mission." The TEP has worked to change that conversation, emphasizing that on high-frequency services, the speed of every segment is part of the whole city's transit outcomes. The same process has made it easier to do a range of other locally-hated citywide goods such as removing parallel routes that were too close together.
Does your city's transit system have a similar project underway, one that moves beyond route-by-route analysis and looks at how every speed/reliabilit deficiency harms the whole city's transit system?
*I was with Nelson\Nygaard at the time. The project was the City of Seattle "Urban Village Transit Network" study of 2004, which became a foundation of the Seattle Transit Plan.
san francisco: cameras will enforce transit lanes
Lanes that protect transit's speed and reliability are only as good as their enforcement. San Francisco, like many cities, has long had a few lanes whose enforcement was so spotty as to render them advisory. Now, the city is getting serious, with camera enforcement and significant fines.
I think another feature will eventually be necessary: Full painting of bus lanes in the same way that we usually paint bike lanes, along with signage on approaching intersecting streets, so that there is no "I didn't know" excuse. Sydney, for example, paints its bus lanes deep red, with gaps at the points where cars can cross for turns.
In addition, if you approach as a motorist on an intersecting street, you will see a sign with a lane diagram of the street you're approaching, so that there's no excluse for turning into a bus lane. Fines (stiff) are often advertised prominently.
Basics: Finding Your Pulse
When transit services are running every 30 minutes or worse, you can’t assume they connect with each other just because they cross on the map. Schedules need to be coordinated to make connections at low frequencies possible. The only technique that does this comprehensively is called a pulse or timed transfer.
A pulse is a regularly scheduled event, usually happening at the same time each hour, in which transit vehicles from a range of routes — usually running every 30 or 60 minutes — are scheduled to all meet together. A group of hourly local routes, for example, might all come to the pulse point between :22 and :25 after the hour and leave at :30. That way, nobody has to wait more than 8 minutes for a connection even though the services in question are hourly.
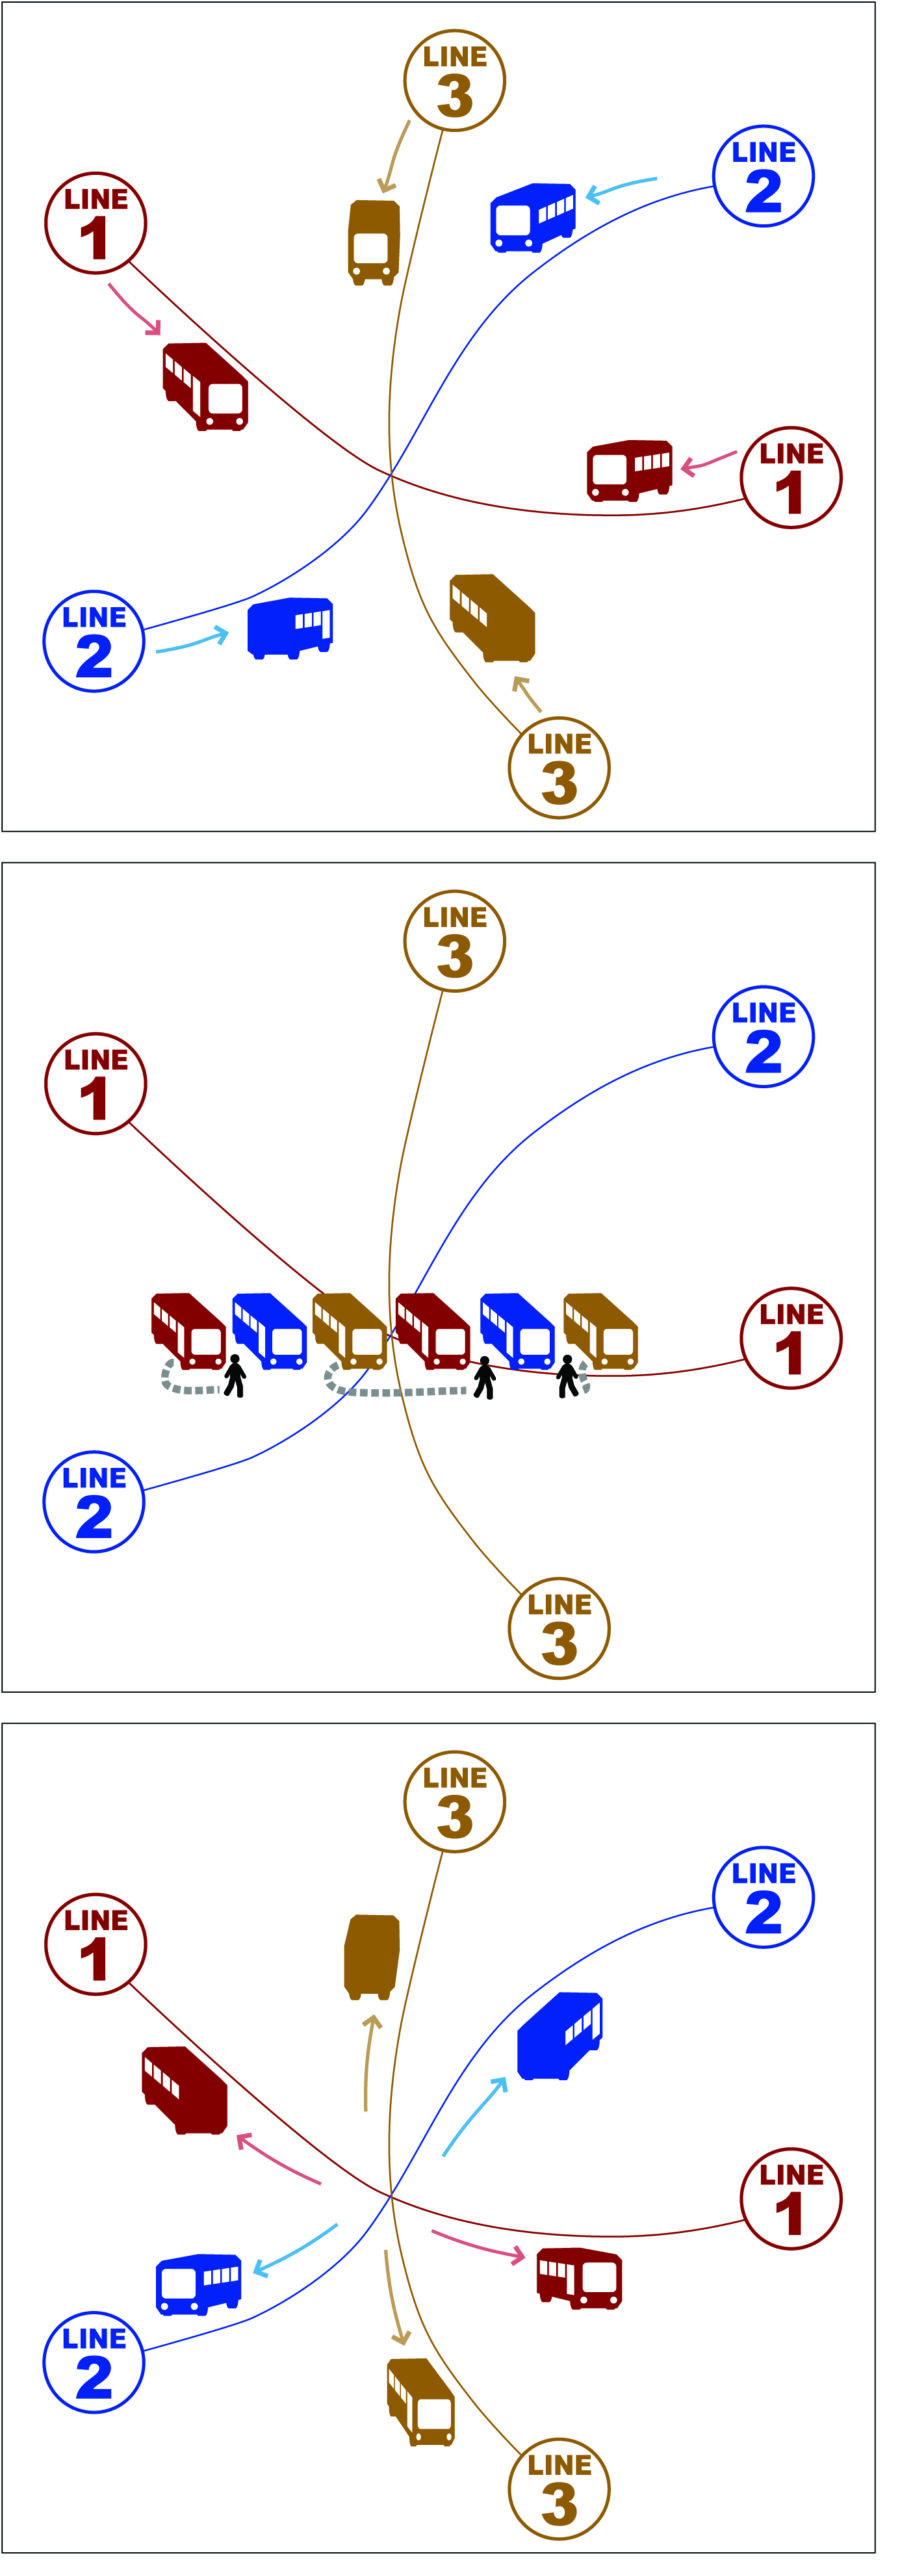
Often, pulses are organized around a main transit line, such as a trunk bus or rail line that takes you to a nearby larger city. In these cases, the main line vehicle usually doesn’t dwell as the local buses do, since it’s the most crowded service and hence the most speed-sensitive. Instead, the locals arrive a few minutes before the trunk passes through, and leave a couple of minutes after.
Pulses are the only way to provide connection wait times that are much, much better than the frequency of the services involved. A pure pulse is also equally convenient for connections between any pair of lines, and thus for travel in any direction.
For this reason they are used almost universally, in North America, in small-city networks where frequencies are low and often also in suburban areas of large cities. If you’re in a North American suburb or small city and see a large number of buses hanging out together on a street corner, you’re probably watching a pulse.
I was introduced to pulse scheduling in Portland at a tender age. I was a teenage transit geek then an undergraduate working part time at TriMet, the transit agency. This happened to be the period (1979-85) when the lattice of suburban pulse networks was being constructed.
We spent a lot of time thinking about how the pulses interact with each other. For example, if you have a pulse of buses at Beaverton Transit Center at :05 and :35 past the hour, and one route goes from Beaverton to Sunset Transit Center in 12-14 minutes, how do you schedule the Sunset Transit Center pulse? Do you set it at :20 and :40, so that this connecting route can serve both pulses but with just a few minutes to spare? When this route is late, a lot of connections will be missed and a lot of people stranded. Or do we just set the Sunset pulse at :05 and :35, so that the bus linking the two transit centers has lots of spare time but now has too much time to kill and will tend to arrive inconveniently early for one pulse or the other. Or do we just accept that this line isn’t going to hit one or the other of the pulses precisely?
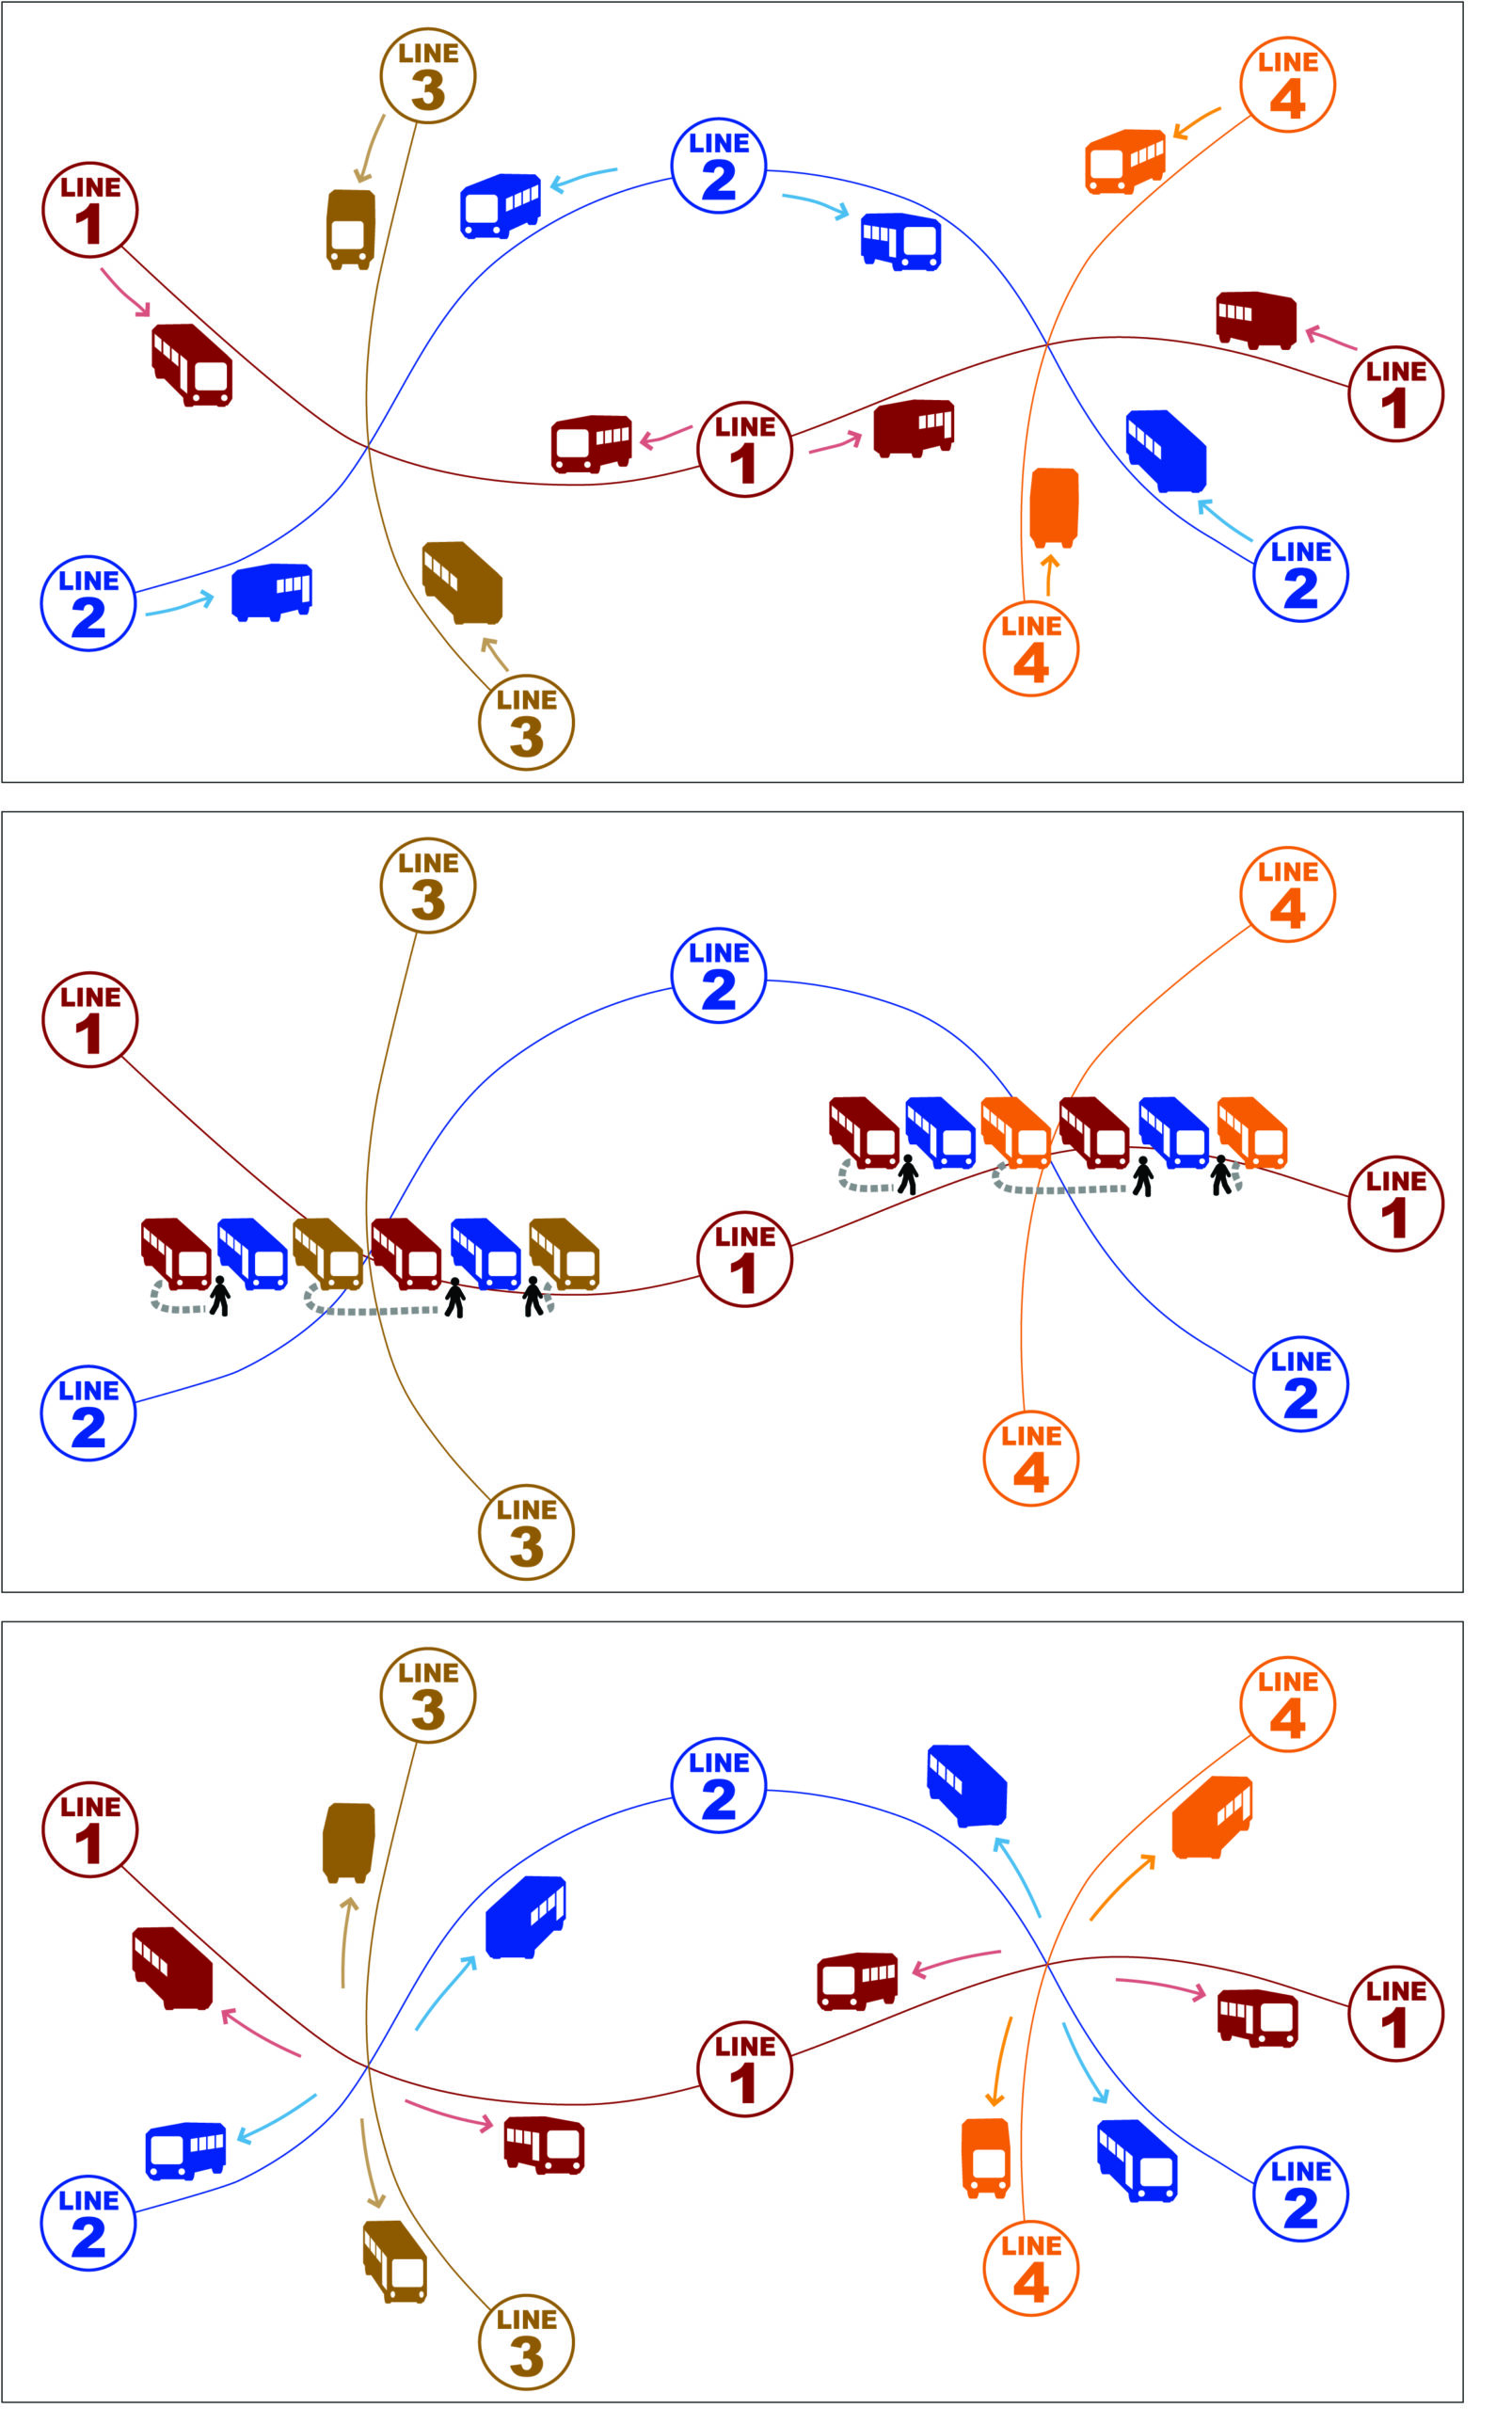
In lattices of multiple pulses, the travel times between the pulse points become critical. In this example, if Lines 1 and 2 have different travel times between the two pulse points, the timing may not work well for both of them. Good network design thinks about this problem as routes are being designed.
To do pulse scheduling, we have to plan the pulse schedule as we’re designing the network. In the two-pulse problem I outlined above, we will think hard about the line connecting the two pulses and ask if we can either make it a little shorter (so that it will get there more reliably in 15 minutes) or a little longer (so that it will get there in 30 minutes without so much time to spare). I have designed some large networks with multiple pulse points, all designed to work harmoniously. To do that, I’ve always designed lines between pulse points with the specific goal of making them a certain length.
Pulse scheduling requires an intimate two-way conversation between the planning and scheduling tasks, but not all public transit authorities are not set up to have this conversation. Sometimes, planning and scheduling are too far apart organizationally and become structurally incapable of noticing and exploiting pulse opportunities. In other cases, pulses may simply not be the prevailing habit; there may be nobody around who is in the position to suggest them.
The organizational challenge presented by pulsing is, to me, a positive feature of the concept. Better integration of planning, scheduling, and operations management has many benefits, and if the pulse challenge helps motivate an agency to get there, so much the better.
But pulse scheduling does have some practical limitations. In particular, it struggles in any environment where the running times are prone to vary a great deal.
Pulses are about managing a low-frequency network, so they aren’t generally needed in inner cities where frequencies are every 15 minutes or better. Pulses are almost universal in small-city design in North America, because most such cities have little traffic congestion and can therefore run a pulse reliably. The best big-city agencies also do some kind of pulse late at night, when their services are very infrequent.
But in the suburban areas of big cities, running times vary due to traffic congestion and pulse operations struggle. I suspect that the difficulty of guaranteeing pulses in these settings is the main reason that big suburban agencies are reluctant to advertise their pulsing too much. Small-city agencies, which don’t deal with such severe congestion, are more likely to emphasise that at the heart of their network, they have a pulse.
A lattice of interconnected pulse points, all beating as planned in unison or alternation in a pattern that repeats each hour, is a thing of beauty if you can visualize it, especially because if the motion of pulsing suggests the movement of blood through the heart. It’s like watching the inner life of a large multi-hearted organism. This can be a nice metaphor for other kinds of thinking about your city.
1 Ross R. Maxwell, “Converting a Large Region to a Pulsed-Hub Public Transport Network.” Transportation Research Record, paper 03-4020, p 128. Original paper here.
Beyond “On-Time Performance”
A San Francisco reporter emailed me yesterday with this question, regarding the city’s main transit system, Muni:
As you know, Muni set a goal in 1999 when the [San Francisco Municipal Transportation Agency] board was formed, to have a 85 percent on-time performance standard. That was voted on in 1999 (Prop. E). Since then … the agency has yet to the meet goal or even gotten close to it. The highest it’s been was 75 percent a few months ago. … I wanted to ask if you if there is any danger for Muni to be so focused on this one standard? Are performance metrics evolving and why are they evolving? What else should Muni to be looking at as far as improving reliability?
The Perils of Succeeding “On Average”
Two recent comments on different topics got me thinking about averages, and why people like to talk about them more than they like hearing about them.
Toronto transit expert Steve Munro made this comment on the familiar perils of transit operations in that city:
In Toronto, the TTC reports that routes have average loads on vehicles, and that these fit within standards, without disclosing the range of values, or even attempting any estimate of the latent demand the route is not handling because of undependable service. Service actually has been cut on routes where the “averages” look just fine, but the quality of service on the street is terrible. Some of the planning staff understand that extra capacity can be provided by running properly spaced and managed service, but a cultural divide between planning and operations gets in the way.
If On-Time Performance is 96%, Why Am I Always Late?
A New York Times article today highlights the perennial misunderstanding embedded in how transit agencies typically measure on-time performance.
By official accounts, 2009 was a banner year for the commuter railroads that serve New York City. Of all the trains that ran last year, the railroads said, nearly 96 percent were on time — one of the best performances since they began keeping records.
But the reality, as nearly any rider would tell you, can be considerably different, and vastly more frustrating. Continue Reading →
Now, Anyone Can Monitor Reliability
Can you think of a better way to measure service reliability than the ones your transit agencies use? Can you develop ways to analyze the system’s performance that will reveal more precisely where and why things go wrong? Now, any transit geek with a head for statistics can try out these ideas, and share what they discover, for any transit agency that publishes a real-time information feed. Continue Reading →
Transit Advertising and Transit Self-Esteem

This Air New Zealand ad, on a bus shelter in Sydney, raises the issue of transit self-esteem. “$100 says the bus won’t be late,” it says, then, in much smaller print: “Looks like you win.”
Should transit agencies accept advertising that demeans their service?
Advertisers are often tempted to do exactly that, especially when selling vacations or other forms of escape from the everyday. The bus is both a profitable site of advertising and an irresistible metaphor for the tedious life. If you imagine your transport mode as a romantic partner, the bus in mixed traffic is the worst of both worlds: neither sexy nor capable of commitment. When advertising on a bus, it’s not surprising that advertisers find ways to play on that. Continue Reading →
If Your Bus is Late, Should the Agency Pay?
An engineering professor in Montréal got his transit agency to pay for his taxi fare because his bus didn’t show up. Unfortunately, it took many days of his time in small-claims litigation, so his trophy, a $40 check from the agency, should probably be framed rather than cashed.
Now and then a transit agency tries some kind of “on time or we pay” guarantee. In the Montréal suburb of Laval, for example, the buses are equipped with Global Positioning System (GPS) technology. The deal is that if your bus is more than five minutes late (a fact that the agency can verify via GPS), you can demand a free bus ticket, which is nice but not much of an incentive for the agency. It seems to me the same GPS-driven approach could be used to implement a policy if “when we’re more than x minutes late, we stop collecting fares.” That would actually help a late bus get back on time, because fare transactions are so time consuming. Continue Reading →