Author Archive | Chris Yuen

Miami-Dade: Dinos que piensas sobre estos conceptos de transporte público

This page is available in English here

Nuestro trabajo más reciente en el sistema de transporte público de Miami-Dade ya está disponible en línea, y estamos buscando gente de la región para que nos cuenten su opinión a través de esta encuesta.

El respetado grupo de abogacía, Transit Alliance, está llevando a cabo el proyecto Better Bus en nombre de Miami-Dade Transit y varias ciudades clave. Transit Alliance y el condado nos contrataron este año para que ayudemos a desarrollar alternativas para el sistema de transporte público que ilustren como este podría cambiar si el sistema de trolleys estuviese mejor integrado a toda la red del condado y si el balance entre las metas de un sistema de alta frecuencia y uno de alta cobertura fuese a cambiar.

El periódico local, el Miami Herald, publicó un buen artículo sobre las redes conceptuales y las opciones que pretende ilustrar.

Anteriormente publicamos un Informe de Opciones que destaca las deficiencias del sistema actual, especialmente la falta de una red de alta frecuencia. Los dos conceptos que desarrollamos intentan construir una red de alta frecuencia, por lo menos en el centro del sistema. A continuación, pueden ver secciones de la red existente, la red de alta cobertura, y la red de alta frecuencia.

La leyenda:

Los dos conceptos cuestan lo mismo que el sistema existente y se pueden implementar en su totalidad. Si todos prefieren uno de estos dos conceptos, Miami-Dade y las ciudades pueden hacer los cambios necesarios e implementarlo dentro de 6 a 9 meses. Pero no estamos haciendo que a la gente elija uno o el otro. Les estamos pidiendo que nos digan hacia cuál concepto se inclinan para que la Junta del Condado y la Comisión de la Ciudad reciban información sobre la decisión que deben tomar para Miami-Dade.

Otras preguntas clave sobre estos conceptos incluyen:

  • ¿Se deben cambiar las rutas de los trolleys para que formen parte del sistema del condado entero? Ambos conceptos proveen rutas de mayor frecuencia en más calles porque los sistemas del la ciudad y el condado están diseñados para complementarse mutuamente.
  • ¿Se debería aumentar el espacio entre paradas para que los autobuses puedan ir mas rápido y así la gente puede llegar a donde quieren ir más rápido? Hoy, el espacio entre paradas es aproximadamente un 1/8 de milla. Ambos conceptos asumen un espacio de 1/4 de milla entre paradas.
  • Y por supuesto, ¿cómo la región debe balancear las metas contradictorias de alta frecuencia y alta cobertura.

Si conoces a alguien en el Condado de Miami-Dade, enséñale la página del proyecto para explorar y expresar sus opiniones. Anímalo a leer atentamente el Informe de Conceptos. Y si tú estás interesado en la reforma de sistemas de autobús en general, mira las conversaciones sobre los conceptos y la decisión final que tomarán los líderes electos. Como con todo rediseño que hacemos, estos conceptos están para ayudar a la gente decidir que valores quieren priorizar con el transporte público. Podemos ayudar a que la comunidad entienda sus opciones y los efectos de esas opciones, pero al final es tu decisión.

Chattanooga: Choices for the City’s Transit Future

Chattanooga Incline Railway

Chattanooga, Tennessee’s most well-known transit infrastructure may be the Chattanooga Choo-Choo, a former train station made famous by a 1941 swing tune by Glenn Miller and His Orchestra, or perhaps the Lookout Mountain Incline Railway, a tourist-oriented funicular currently owned and operated by the Chattanooga Area Regional Transportation Authority (CARTA).  Most days though, Chattanooga’s transit line with the highest ridership is the Route 4 bus from downtown to the eastern suburbs. Although Chattanooga was an early adopter of electric buses, starting their downtown electric shuttles in 1992, transit has not been at the forefront of its planning policies in the past few decades.  Like many other similarly sized cities without urban growth boundaries in the US, development has sprawled outwards, enabled by highways, resulting in land use patterns that are difficult to serve by transit.

That is changing.  In recent years, Chattanooga has focused efforts on rekindling the inner city, adding housing, retail, and office space downtown, and becoming the first midsize city in the US to designate an urban innovation district.  As a recognition of their efforts to build vibrant public spaces, Chattanooga will be hosting the Project for Public Spaces placemaking conference this Fall, the third city to do so after Amsterdam and Vancouver.  But in order for a city center integrated within a growing regional economy to scale up without being choked by traffic congestion, Chattanooga needs better transit.  Today, the city is starting to reconsider the role of the bus and may be ready to make major changes to its bus services and perhaps invest more in it.


The recently revamped Miller Park in Downtown Chattanooga. Photo: downtownchattanooga.org

We’ve been studying the transit system in Chattanooga for over a year and in June CARTA released our report outlining four possible concepts of what the future of transit could look like. These four concepts show a range of options between coverage and ridership goals with no new funding and two options with additional funding for transit. Happily, the local newspaper’s coverage is clear and accurate.

The release of this report begins the period of public discussions and surveys. The results of that discussion will inform the decision that the CARTA Board makes in August about what direction the final plan should take.

Our report discusses four possible futures but most likely, the final plan won’t look quite like any of these. The key idea — as in much of our work — is to open up a “decision space” in which people can figure out where they want to come down on the two difficult policy decisions:

  • Ridership vs coverage? What percentage of resources should to go pursuing a goal of maximum ridership — which will tend to generate frequent service in the densest urban markets — as opposed to the goal of coverage — spreading service out so that as many people as possible have some service nearby?
  • Level of investment in service? How much should the community invest in service? The more it invests the more it gets in value, but the value it gets depends in part on how you answer the ridership-coverage trade-off.

If you live in Chattanooga or know anyone there, now is the time to get involved.  Download the report, read at least the executive summary, form your own view, and share it with us here!  The more people respond, the more confident we’ll be in defining the final plan based on their guidance.

Miami: Starting a Network Redesign

We’re excited to get started on a bus network redesign in Miami!

Miami-Dade Transit runs a large network of about 100 routes, running over 750 buses across a huge area over 40 miles long. Over the last five years, the Metrobus system has lost about 1/4 of its riders, which has caused Miami-Dade leadership to question the current bus network and how well it’s serving the county.

Like many other Sunbelt cities, Miami is growing and a lot of that growth is in a few places: around downtown, on the beaches, and in a few key centers such as Coral Gables. These densifying centers are reaching the point where cars simply don’t work anymore, and transit is essential to the continued growth and prosperity, not to mention equity. Thus, there are increasing demands for more useful service in these core areas.

As in many cities, the edges of the region are also seeing new development designed almost entirely for car dependence. And many people moving to the edges are doing so because they have limited incomes and the housing is cheap. But the land use design and distance means that the cost to serve them with transit is very high. These trends are stretching Miami-Dade Transit farther and farther geographically on a limited budget. This combination of forces is putting great demands on transit in opposite directions and is heightening the difficulty of the ridership-coverage tradeoff.

A key question in the process will be the different roles of different transit agencies. Many municipalities have begun running their own municipal bus routes. Some, like the Miami Beach network, are extensive. As Miami-Dade has lost riders municipal systems have seen big ridership increases, rising from 7.4 million riders per year in 2013 to 10.9 million in 2017. Where these municipal routes compete with county-wide Miami-Dade routes, many people are choosing the municipal routes, in part because they are free. These trends are causing greater segmentation of transit services across the county and adding to the complexity that an average rider must manage when trying to figure out how to make a trip or trying to understand the whole system.  They also represent a degree of duplication that could potentially be reallocated to create more frequent and useful service.

As always, public input (including but not limited to riders) will be essential to figuring out what direction Miami-Dade wants to go. For that effort, we are especially excited to partner with Transit Alliance Miami, a local non-profit organization advocating for walkable streets, bikeable neighborhoods and better public transit. Transit Alliance advocated this project for years, and now they are actually leading the process on behalf of Miami-Dade County, with a big emphasis on involving the community in decision-making throughout the process. We think this is the first US bus network redesign that is led by a community advocacy group.

We expect there will be some early outreach on key choices in the summer. In the fall, we expect to release two concepts for how the future network could look, and this will be a key point for public input. All of that input will guide us on a final plan, which we expect will be voted on this winter. Keep an eye on the Transit Alliance twitter feed and website for regular updates throughout the redesign process and opportunities to provide input and respond to concepts.

Cleveland: Tell us what you think about these alternative networks!

Our work on Greater Cleveland’s transit network is now available online, and we’re looking for people from the area to provide their input through this online survey.  The transit agency, GCRTA, hired us this year to help develop transit network alternatives that would illustrate what the transit network could look like if it shifted its focus more towards attracting higher ridership, and what it what the network would look like if it shifted towards extending coverage, as well as what the possibilities may be with different levels of funding.

The local newspaper, the Plain Dealer, has a great article about the networks and what they are intended to illustrate.

Cleveland is fortunate to have a relatively dense, and walkable pre-war era development pattern across much of the city, but as with most places in the United States, the trend over the past half-century has been the continual spread of residents and jobs to far-flung locations across the region. Since the region as a whole is growing very slowly, or not at all, this slow dispersal of the tax base poses a long-term challenge for the stability of transit resources and travel markets as more people and jobs flee to the margins of Cuyahoga County, or beyond.

When operating resources are limited, as in GCRTA’s case, the ridership/coverage tradeoff is put front and center in any discussion of what transit can do. Today’s network extends to most, but not all, of the developed area of the county, and provides little high-frequency service within the dense, walkable core of the region. Reaching more of Cuyahoga County would mean curtailing frequency in dense areas even more. But building a robust frequent network would require pulling back from many of these lower-density suburban areas, as there is little waste or duplication to reallocate in the current service design of RTA’s network.

In this context, RTA has brought us in to help explore what the transit network could look like today, if different policy priorities were emphasized more strongly in network design. Further on in the project, we’ll also be developing alternatives for different financial scenarios. Right now, RTA is conducting outreach on two alternatives: a High Frequency Alternative which brings frequent service to most of the dense, walkable central areas of Cleveland and the inner-ring suburbs, and a Coverage Alternative, which spreads low-frequency service to more of county.

The purpose of these alternatives is to illustrate for the public, stakeholders, and the agency’s Board of Trustees the potential outcomes of a policy choice to focus more on ridership or on coverage. (You can click each map below to explore a larger annotated version).

The High Frequency Alternative concentrates service so that lines run more frequently, reducing waiting times and making travel by transit more convenient. The network would reach fewer places, but where it does reach, trips would be faster than with the Existing Network.

As a result, over 40% more jobs would be accessible by the average county resident in an hour with the High Frequency Alternative. But on the other hand, the reduction in overall network extent reduces the number of people within a ½-mile walk to transit by over 20% from current levels.

You can compare the structure of the network on Cleveland’s east side to see this principle in action:

GCRTA Existing Network (left) compared with the High Frequency Alternative (right)

On the other hand, the Coverage Alternative spreads out service across the county, but spreading it out means spreading it thin. Frequencies would be lower throughout the network. This means that the network reaches more places but some trips would take much longer. Because these are budget-neutral alternatives, expanding the reach of the network requires reducing service levels on other routes, some routes that run every 45 minutes today would run every 60 minutes, and RTA’s single existing 15-minute bus service would run every 20 minutes. About 25,000 more people would be within a ½-mile walk of a transit stop, about a 5% increase from the Existing Network.

We hope these alternatives clearly illustrate the ridership/coverage tradeoff as it applies to Cuyahoga County and Cleveland. If you live in the area, please tell us what you think! You can learn more about the project and alternatives here.  Then, if you live, work or study in Cuyahoga County, be sure  take this short online survey.


Bus Crashes Auto Show with Killer Ad

By Christopher Yuen

This coming weekend for the first time, GO Transit, Toronto’s regional transit agency, will be displaying one of their buses at the Canadian International Auto Show.  They’ve also made a fantastically theatrical ad touting an amazing technology that’s even better than the self-driving car.

Dramatic?  Yes, but only fitting for a densely populated city where nearly 50 percent of commutes into downtown are made by transit, and where the mobility of everyone is dependent on not everybody travelling in individual cars, self-driving or not.

Early Positive News from Richmond, Virginia Redesign

by Scudder Wagg

It’s been nearly three months since the launch of the Pulse Bus Rapid Transit line, and the bus network we helped design, for the City of Richmond and its transit agency.

The early news looks positive for ridership. For some context, the redesigned network was intended to shift the balance of the network from about 50% ridership focus to about 70% ridership focus.

Prior to the launch of the new network, weekly ridership was averaging about 141,000. The first week of the new network saw huge ridership, 226,000 for the week, but that was driven by free rides. Immediately after the launch, ridership remained near or above the pre-launch ridership levels (if you ignore the July 4 holiday week). And since August, ridership has climbed to about 157,000 per week, an 11% gain.

Any gain at this point is good news.  It’s normal for there to be a slight dip in ridership just after implementation, as people take time to adjust to the new network, and for ridership to then grow gradually over two to three years.

Some of this gain is attributable to the new partnership with Virginia Commonwealth University (VCU). VCU has partnered with the transit agency by investing $1.2 million per year in exchange for transit passes for all students, faculty, and staff. VCU was drawn to this partnership in part by the obvious value that the new BRT and Route 5 (part of our network design) provided to the University. And its willingness to invest in the service is a good sign of the renewed confidence that many have in the usefulness of transit service in Richmond.

That confidence is reinforced by the expansion of service that happened this past weekend in adjacent Henrico County. The County decided this past spring to add evening and weekend service on three routes and extend service to Short Pump, the largest suburban retail and jobs center in the region. That expansion launched on September 16.

More time and data will help make clear how much ridership growth is attributable to network design and how much is attributable to other factors. But the early signs are positive, and we hope they continue in that direction and spur additional improvements in transit for Richmond.


Scudder Wagg, who played a central role in the Richmond project, manages the US East Coast practice for Jarrett Walker + Associates.

Is Ride-Hailing to Blame for Rising Congestion?

Throughout the past few years, the explosive growth of ride-hailing services such as Uber and Lyft have changed the landscape of urban transportation.  Proponents of ride-hailing have long argued that these services benefit cities by reducing the need for people to own their own cars and by encourage them to use other transportation options, ultimately reducing the total vehicle miles driven in cities.

Last week, a new report by Bruce Schaller suggests that these ride hailing services are in fact, adding to overall traffic on city streets, and risk making urban cores less desirable places to live. Notably, Schaller’s report finds that:

  • TNCs added 5.7 billion miles of driving in the nation’s nine largest metro areas at the same time that car ownership grew more rapidly than the population.
  • About 60 percent of TNC users in large, dense cities would have taken public transportation, walked, biked or not made the trip if TNCs had not been available for the trip, while 40 percent would have used their own car or a taxi.
  • TNCs are not generally competitive with personal autos on the core mode-choice drivers of speed, convenience or comfort. TNCs are used instead of personal autos mainly when parking is expensive or difficult to find and to avoid drinking and driving

Schaller points out that on balance, even shared rides, offered by Lyft Line and Uber Pool, add to traffic congestion.

Shared rides add to traffic because most users switch from non-auto modes. In addition, there is added mileage between trips as drivers wait for the next dispatch and then drive to a pickup location. Finally, even in a shared ride, some of the trip involves just one passenger (e.g., between the first and second pickup).

To many readers, Schaller’s report implies that Uber and Lyft are primarily to blame for the increasing traffic congestion and declining transit ridership in many US cities.  Citylab published a rebuttal to Schaller’s report, titled “If Your Car Is Stuck in Traffic, It’s Not Uber and Lyft’s Fault”.  The author, Robin Chase, founder of Zipcar, disputes the scale of ride-hailing’s impacts on traffic congestion in cities.  Chase writes:

[In major urban areas], taxis plus ride-hailing plus carsharing account for just 1.7 percent of miles travelled by urban dwellers, while travel by personal cars account for 86 percent.

Chase contends that traffic congestion is not a new problem in cities and that ride-hailing is no more responsible for it than the personal automobiles that still make up the majority of trips.

Special taxes, fees, and caps on ride-hailing vehicles are not the answer. My strong recommendation for cities is to make walking, biking and all shared modes of transit better and more attractive than driving alone—irrespective of the vehicle (personal car, taxi, or autonomous vehicle). Reallocate street space to reflect these goals. And start charging all vehicles for their contribution to emissions, congestion, and use of curbs.

On taxing or limiting all vehicles — called (de)congestion pricing — Chase is right on the theory and Schaller’s report doesn’t disagree.  From Schaller’s report:

Some analysts argue for a more holistic approach that includes charges on all vehicle travel including personal autos, TNCs, trucks and so forth, paired with large investments to improve public transit.  This is certainly an attractive vision for the future of cities and should continue to be pursued. But cordon pricing on the model of London and Stockholm has never gone very far in American cities. Vehicle mile charges have been tested in several states, but implementation seems even further from reach.

Yes, ideally, we would aim to charge every vehicle for precisely the space it takes up, for the noise it creates, and for the pollution it emits, and to vary all that by location and time-of-day. However, we have to start with what’s possible.

Ultimately, the most scarce resource in cities is physical space, so when we allow spatially-inefficient ride-hailing services to excessively grow in our densest, most urban streets, we risk strangling spatially efficient public transit and fueling a cycle of decline.  If we are to defend the ability to move in cities, we have to defend transit, and that means enacting achievable, tactical policies even as we work on building the coalitions needed for bigger change.  Reasonable taxes or limitations on TNCs are one such step.

Finally, these interventions should really be locally-focused, because like all urban transportation problems, this one is extremely localized.  Lyft wants us to think of them as feeders to transit, which is a fine idea.  But what is actually profitable to TNCs is to swarm in the densest parts of cities, increasing congestion and competing with good transit, and that’s where they do net harm.  Lyft and Uber knows where every car is at every moment, so it would be perfectly possible to develop cordon-based surcharges to focus any interventions on the actual problem.  Otherwise, it will be easy to say that by restricting TNCs in Manhattan we’re keeping someone in outer Queens from getting to the subway, which is not the point at all.

Christopher Yuen and Jarrett Walker

The rise of “Super Commuters”

The Apartment List Rentonomics blog, which writes on real-estate statistics and economics, recently posted a census analysis on the “Rise of Supercommuters”.  It describes a recent increase in the percentage of people with commutes 90 minutes or longer each way.  This thoughtful analysis is well worth a read.  It finds that:

  • Nationwide, one in 36 commuters are super commuters, traveling 90+ minutes to work each day, spending hours on public transportation or battling traffic.
  • Super commuting is becoming increasingly common: the share of super commuters increased 15.9 percent from 2.4 percent in 2005 to 2.8 percent in 2016.
  • The share of super commuters is highest in expensive metros with strong economies — New York, San Francisco, Washington, D.C., Atlanta and Los Angeles, and in their surrounding areas.
  • Super commuters are more likely to rely on public transportation than those with shorter commutes. An estimated 91.4 percent of non-super commuters drive to work, compared to just 69.7 percent of super commuters.
  • In most U.S. metros, low-income commuters are more reliant on public transportation than high-income commuters, creating a nexus between super-commuting and poverty. When transit usage falls sharply with income it suggests that transit is used out of financial necessity rather than as a lifestyle choice.

But the term “Super Commuter” sounds too heroic.  “Super commutes” aren’t something to celebrate.  People should be free to arrange their lives this way, but shouldn’t be forced to by the housing market.

For the commuter, spending three hours of unpaid time a day commuting is only a response to a lack of reasonable alternatives.  For taxpayers, it represents a high cost- both in providing infrastructure, and in increased traffic congestion.  The US Census itself calls commutes over 90 minutes “Extreme commutes”.  That to me, better describes these long commutes- they are something that a few people may have to do because of their job or family situation, but something that shouldn’t be made the new normal.  “Extreme” also captures the right connotation.  As in “extreme sports,” it suggests something that most people would rather watch than do, and that many don’t even want to hear about.

We can also draw parallels between increases in in the prevalence of these extreme commutes and the decrease in overall transit ridership over the past few years.  They are both symptoms of the suburbanization of poverty, and to some extent, the middle class.  These suburbs are not geometrically conducive to high-ridership transit, and as a result the transit options are poor, so many people who move there, resort to driving.  But driving such long distances every day can cost thousands of dollars over the course of a year, so some people would still rather endure the low frequencies and limited spans of suburban transit service to access the city.

The article goes on to conclude that:

Reversing the growth in super commuting requires investment in both increasing housing supply and improving transportation.

Both increasing housing supply and improving transportation have the potential to reduce commute distances, but the location of this new housing and improved transportation are crucial.  Transit always achieves higher ridership per hour of service in dense, mixed-use urban centers, than in unwalkable outlying suburbs, so if we want to reduce the percentage of transit commutes that take more than 90 minutes each way, we will have to substantially increase densities in places where fast, frequent, and useful transit is most feasible.  That means a mixture of housing and jobs, and building up, not out.


Richmond, Virginia: our Redesigned Network starts June 24!

On Sunday June 24, 2018 Richmond, Virginia will wake up to a new transit system, including its first Bus Rapid Transit line — the Pulse.   The redesigned network for the whole city is the result of a design process that our firm guided, in cooperation with the local office of Michael Baker International, for the City of Richmond and Greater Richmond Transit Company (the transit agency).

The redesign process began in early 2016 with our team leading city staff, stakeholders and the public in a conversation sparked by our Choices Report. We focused on key trade-offs, like ridership versus coverage and the right balance between peak service and all-day service.  Importantly, this project was led by the City of Richmond, not the transit agency, so it was closely aligned with the city’s own goals for itself, including its redevelopment.

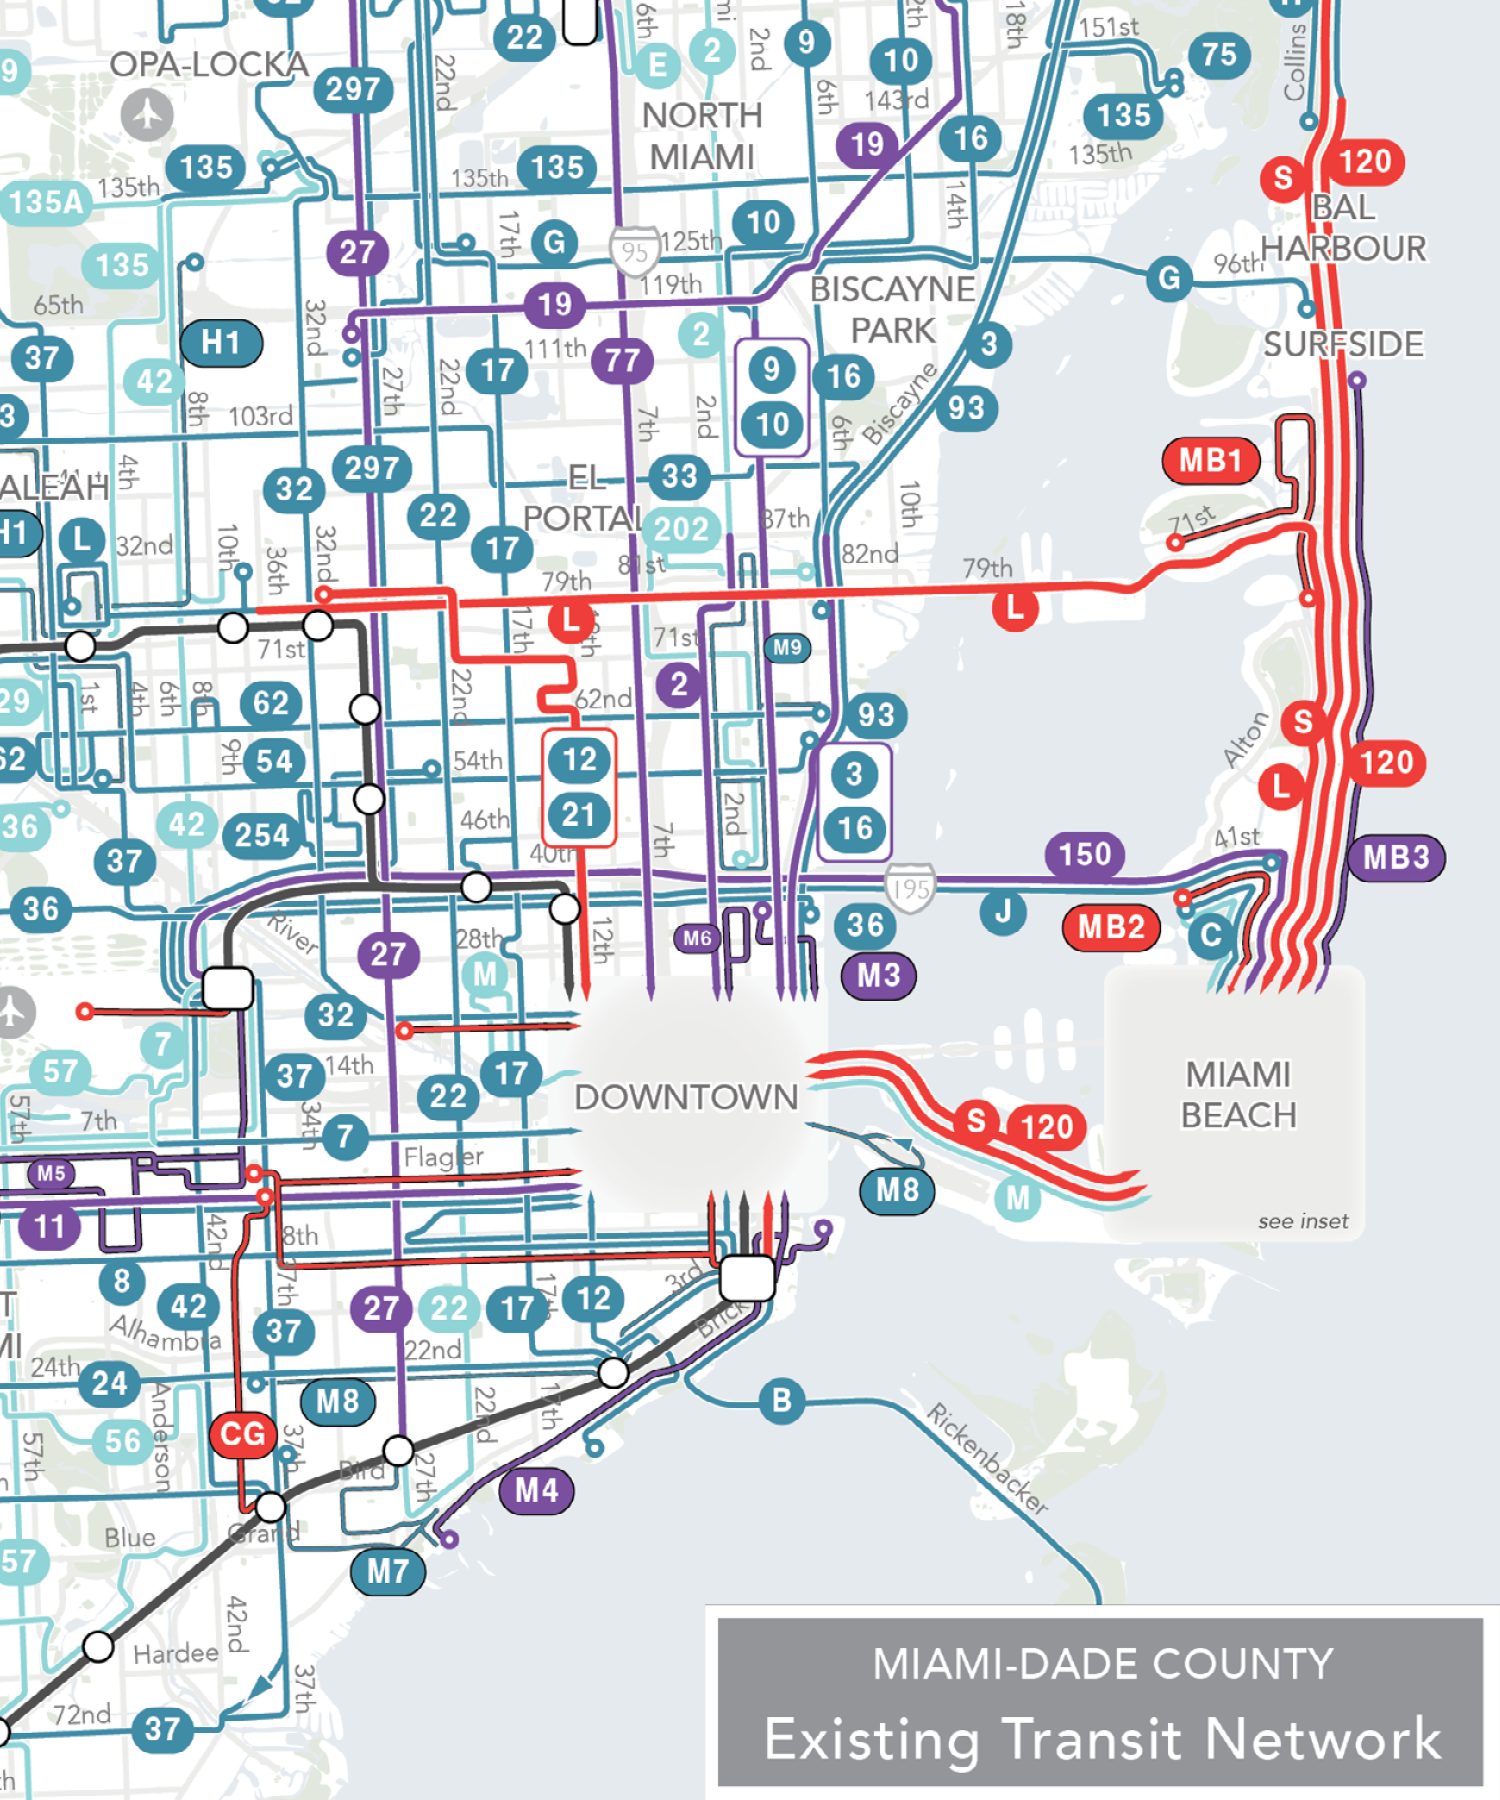
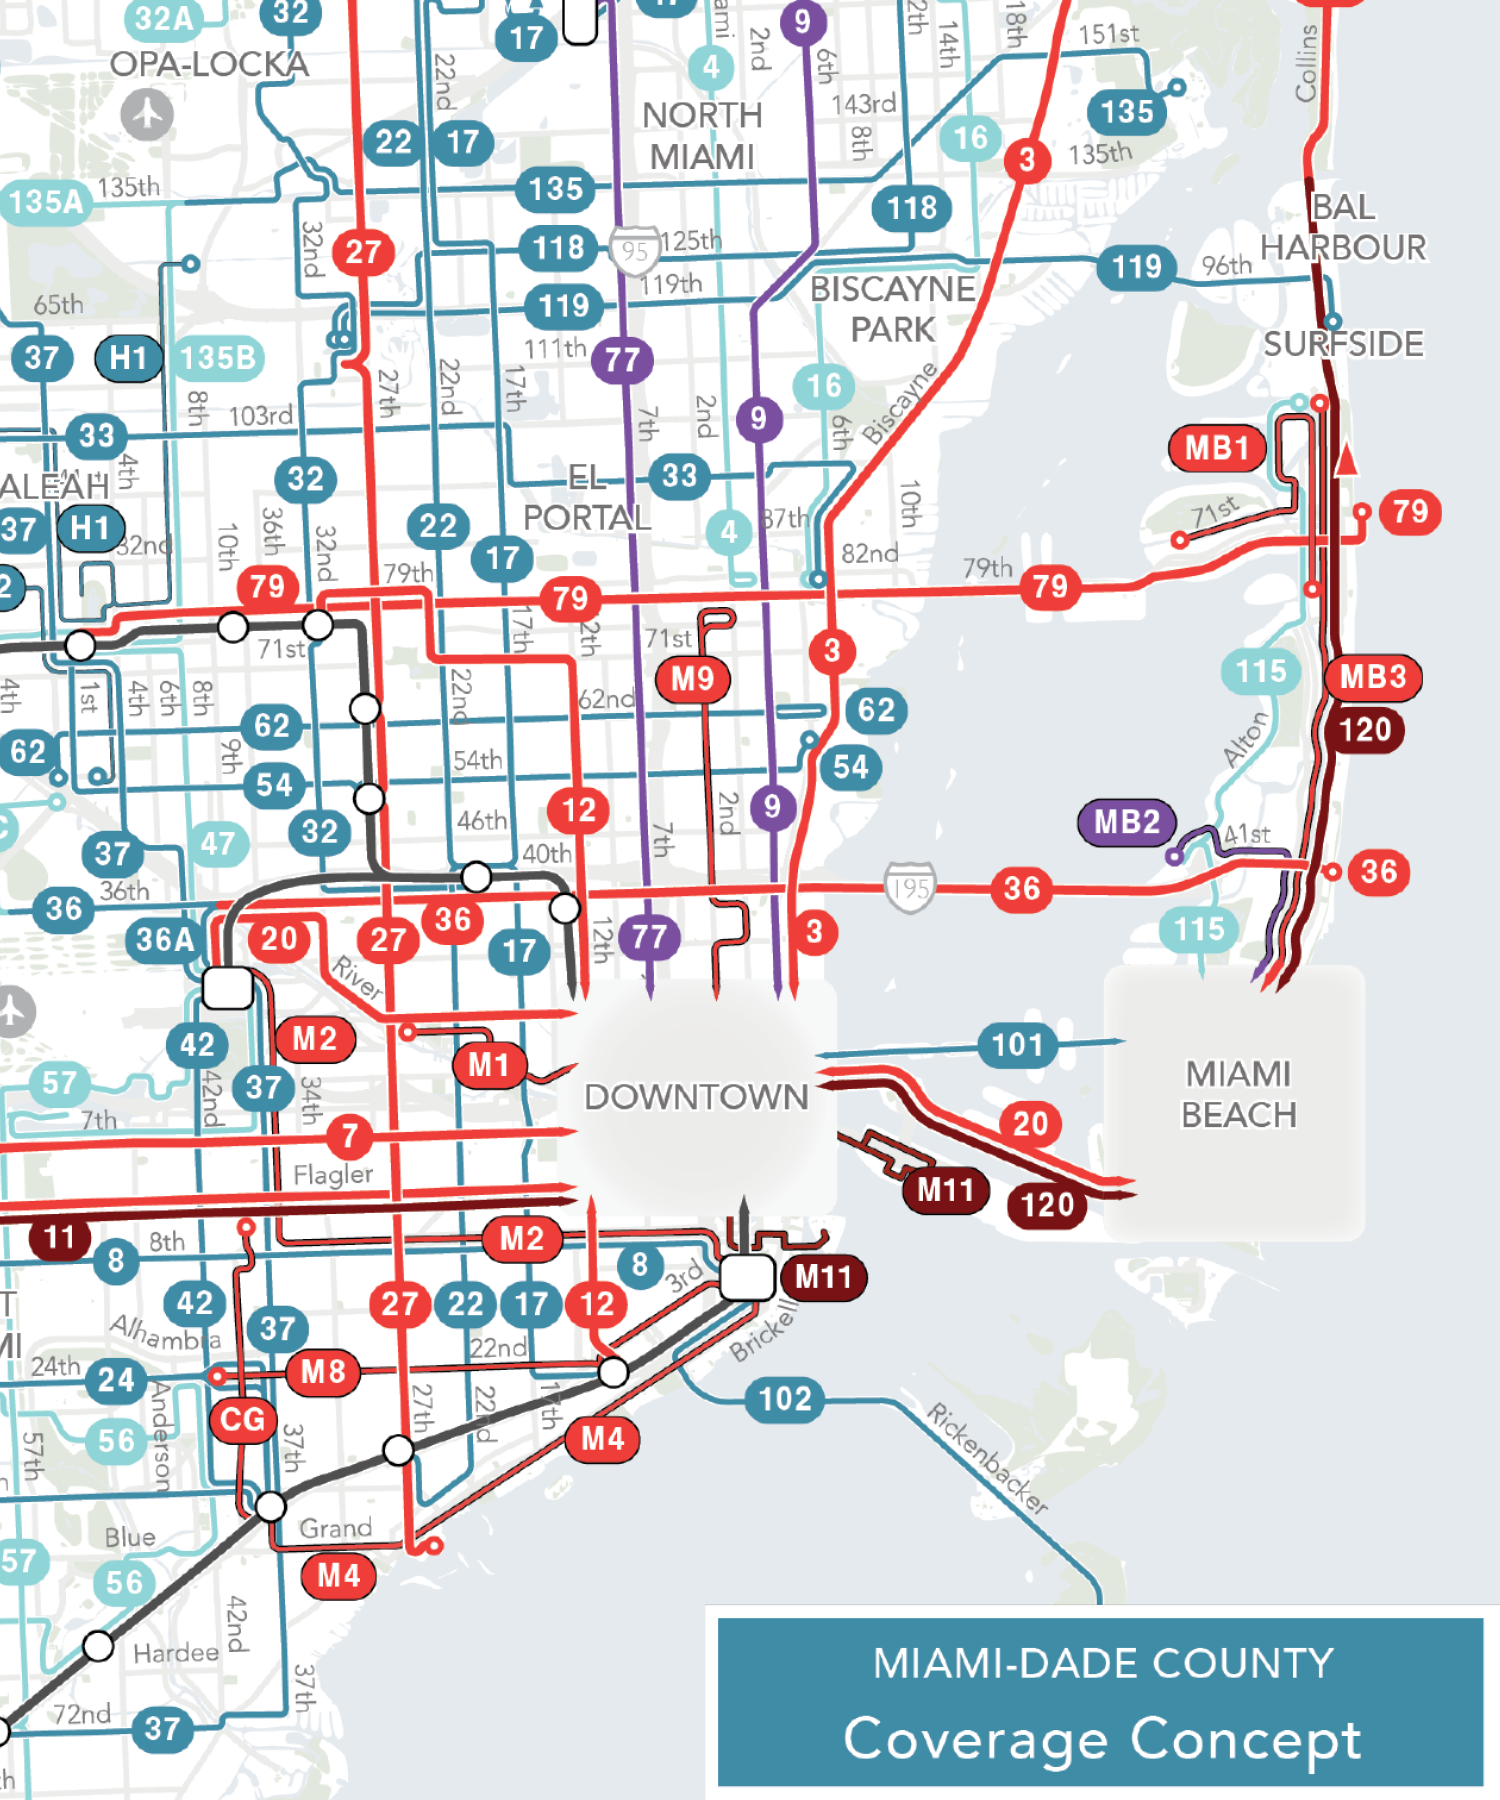
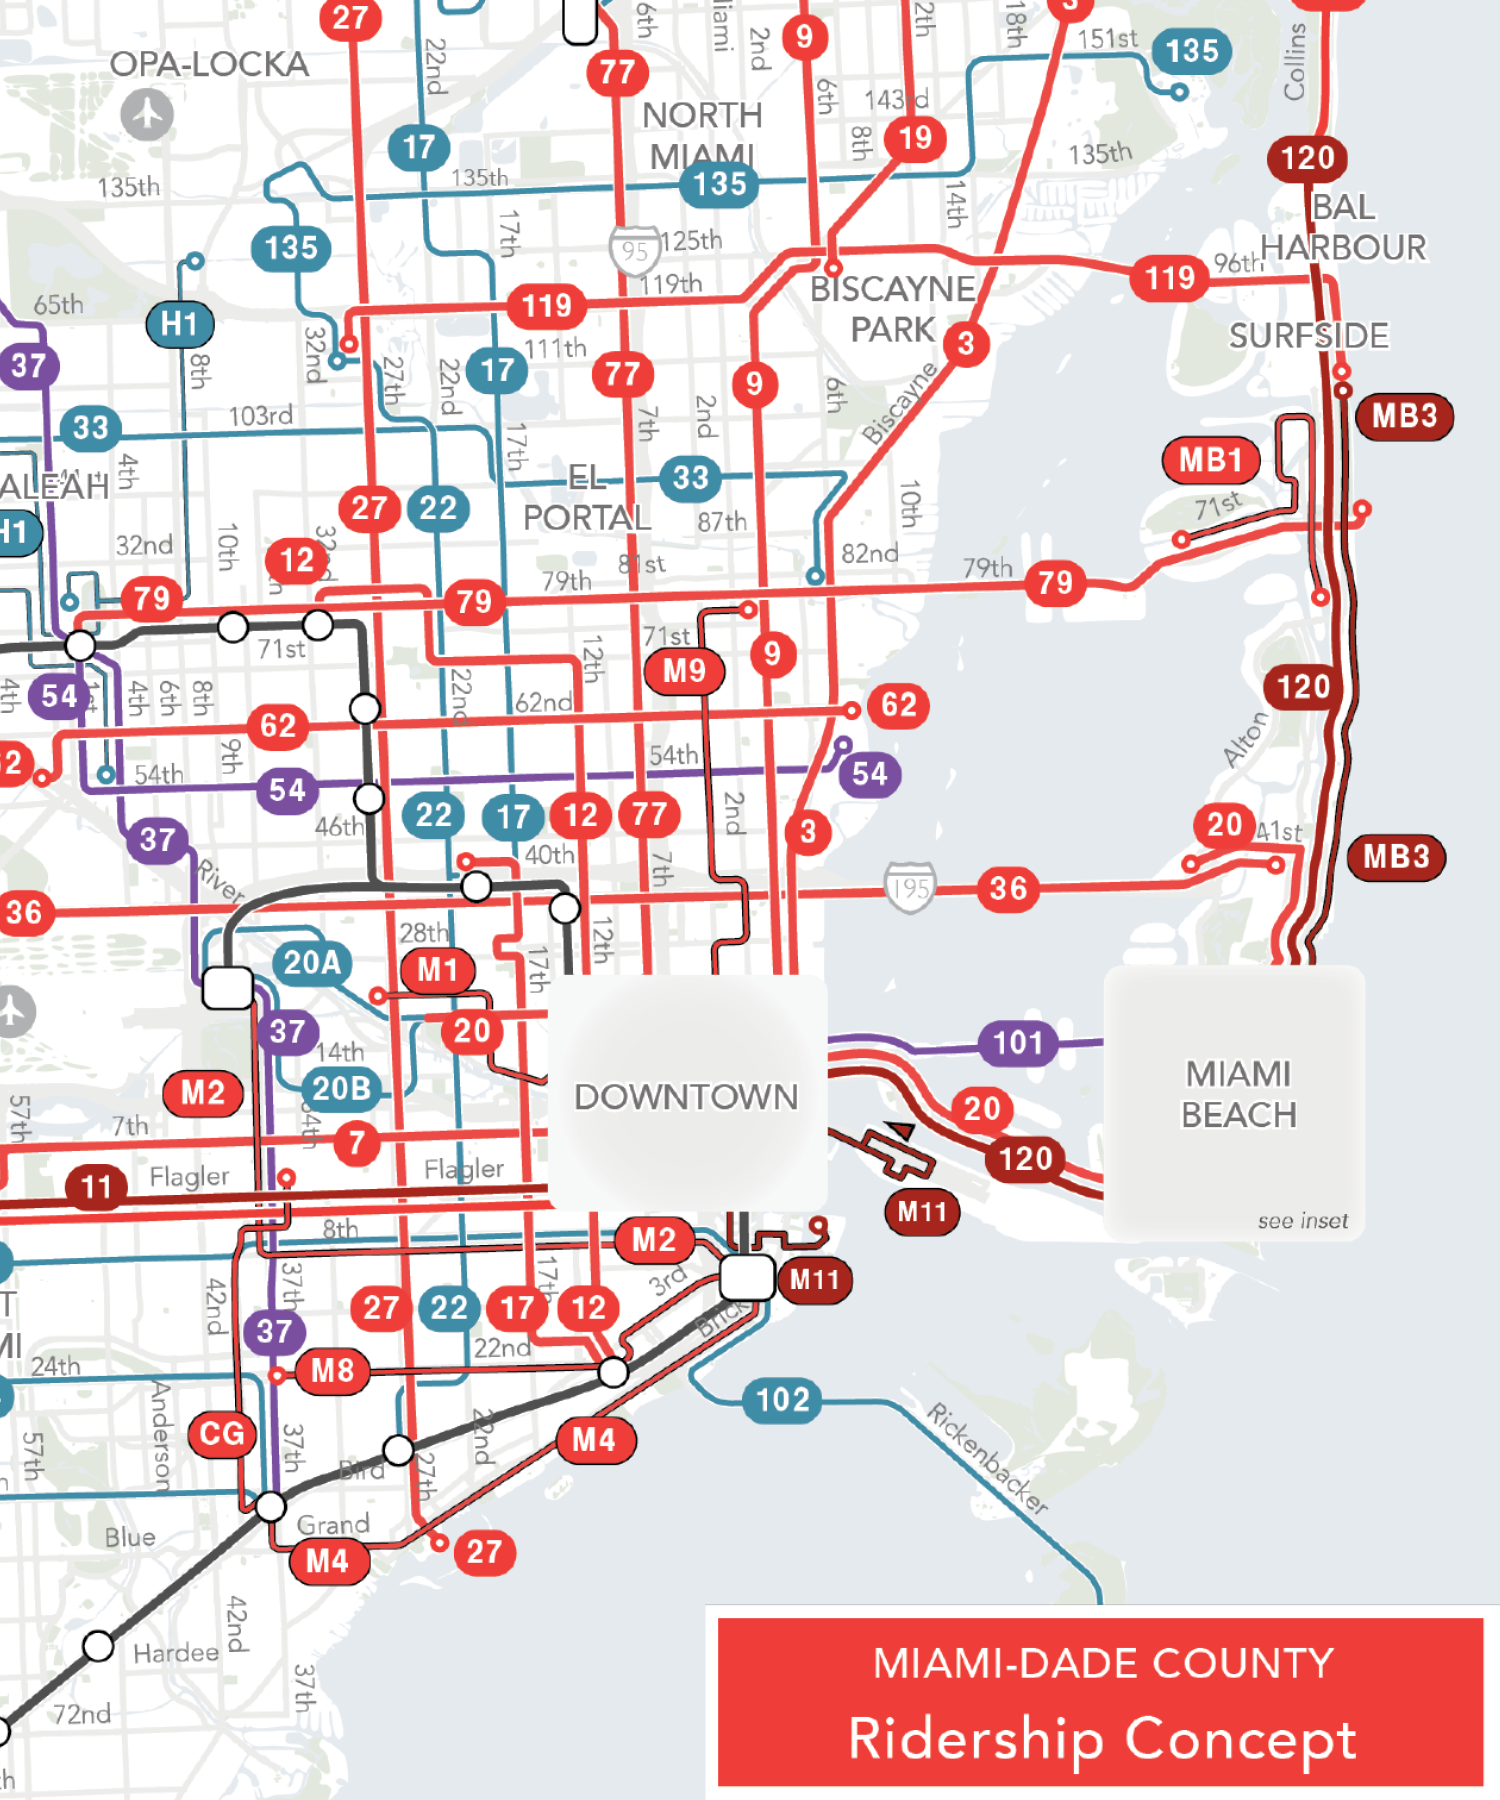
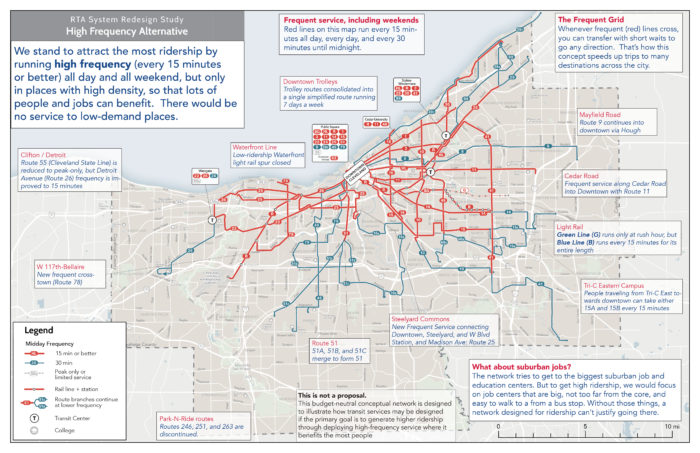
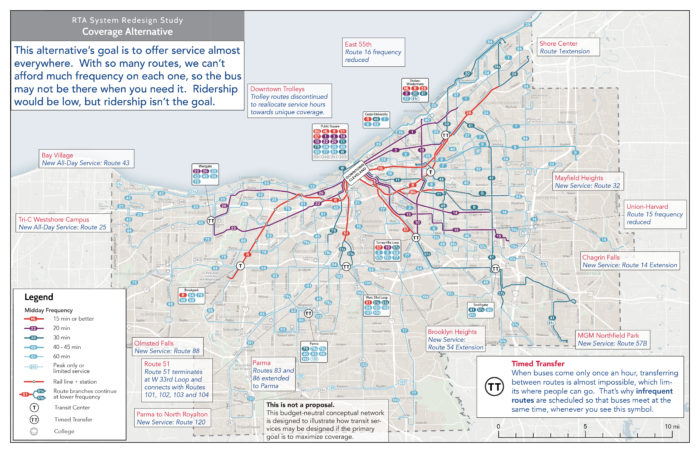
We then developed three concepts of how to redesign the City’s bus network around the new BRT line and guided a conversation around those concepts and the goals they represented. The Familiar concept represented little change.  A Coverage concept focused on covering every part of the city even where ridership would be low.  A Ridership concept focused more on high-ridership services, like frequent lines in high-demand corridors.  Response from the public and stakeholders leaned toward the Ridership concept, though there was a wide diversity of opinion.

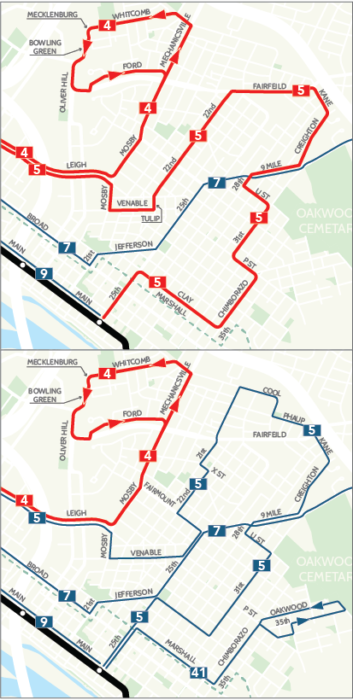
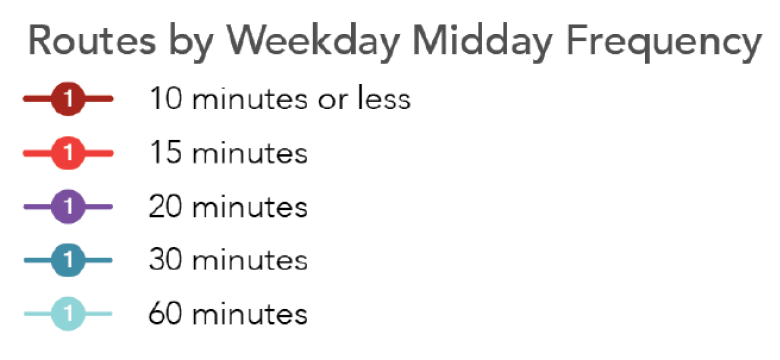
The top map shows the original proposal for the east end of the city.   Red = every 15 minutes.  Blue = every 30 minutes. Residents told us they preferred shorter walking distances and lower frequency, so we revised the proposal to the map below.

By January 2017 we published a draft recommended network with six new high frequency lines in addition to the BRT, clockface frequencies, more through-routing (instead of terminating) downtown, and a network that maintained nearly all existing coverage of people and jobs.

While response to the draft recommendation was very positive, the East End of the city raised some concerns. We had designed a high frequency line (Route 5 in the map) that required a longer walk for some residents. After more thought and review, the community and the city decided they would prefer to have shorter walks and longer waits. So, we revised the network design to have two lower frequency lines (Routes 5 and 41 in the map) instead of one higher frequency line.

We published the final network plan in March 2017 and since then the City and GRTC have been working hard to prepare for the big day when everything changes overnight, including additional tweaks and updates to the network in light of new information and additional community feedback. But overall, the basic network structure that will be implemented on June 24 is what was in the final plan from March 2017.

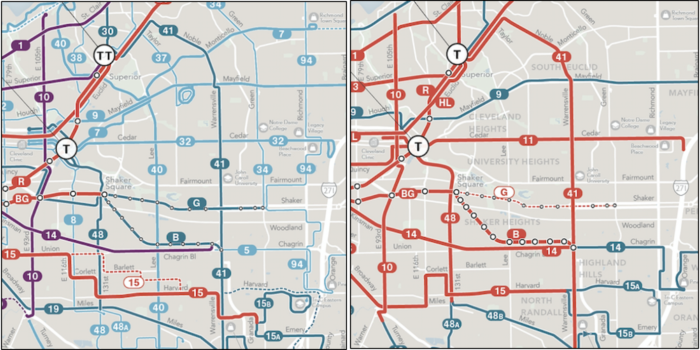
You can see how the new network drastically simplifies things by comparing the existing system

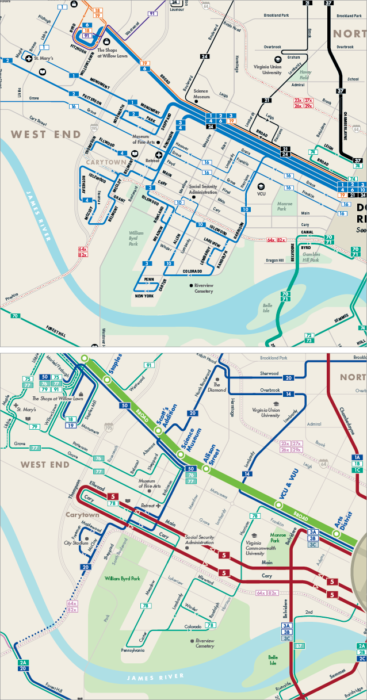
The top map shows the network before the redesign and the lower map shows the network after the redesign.

map to the new map in near west part of the city, which includes the Fan and Museum District neighborhoods. Previously, many routes piled together onto Broad Street to create a lot of service there, but it was not well organized and led to more bunching of buses than useful frequency. The new network is radically simpler, with more direct lines and frequent lines focused on the major east-west corridors in this part of the city. So there are now two major frequent lines in this area, the BRT line on Broad Street and the frequent Route 5 on the Main/Cary couplet.

And there is a new orbital line (Route 20) connecting the north, south and west parts of the city without requiring a transfer downtown. This is really important for Richmond because of the prevalence of jobs in the western part of the region while most lower cost housing is in the north, south, or east.  We wanted this line to be every 15 minutes, and we hope it will be soon; for now, budget constraints are holding it to a 30 minute frequency.

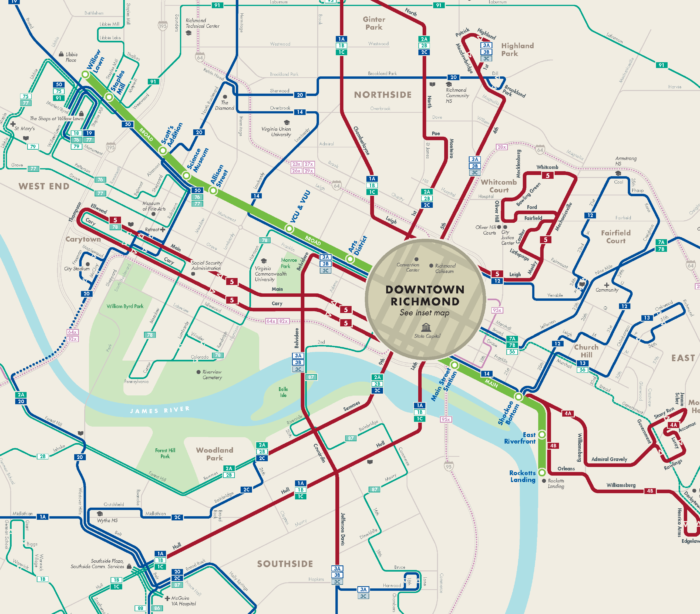
Also, GRTC has taken this opportunity to improve the communication in its system map. In the old map colors represented which parts of the city each route served. In the new map, colors represent frequency, which makes it much easier to see where the useful service is. (The new map is by our friends at CHK America, but the red-blue-green color scheme for frequency is one we’ve been using for years.)

Throughout the process we led the network design and guided the stakeholder conversations. We worked closely with our local partners at Michael Baker International who led the public outreach and key local government coordination. And the City provided strong leadership throughout to ensure the process led to a clear and convincing direction when City Council unanimously approved the policy direction for the plan in February 2017.

We’ve had fun working with GRTC, the City and surrounding counties on a ten-year plan for transit improvement. We’ve been leading an intensive effort on the network design in Henrico County, which covers Richmond’s northern suburbs, including concepts for a major expansion of transit into the county.  That is all leading toward a new Transit Development Plan for GRTC which will be completed in the next few months. Meanwhile, Henrico County has already taken major steps to implement parts of the plan. Starting in September, there will be evening and weekend service on three routes in Henrico (currently they do not have any service in the evening or on weekends). They will also extend service to the airport and along West Broad Street to Short Pump to serve the one of largest suburban office parks in the region and the largest shopping mall in the region.

When local governments start leading on transit, big things can happen. The fast movement on so many fronts in the last two years is due, in part, to the City of Richmond and Henrico County taking a much stronger role in guiding and planning for transit in coordination with GRTC, instead of leaving all the advocacy to the transit agency.

We’re pleased to have helped shepherd the conversation to this point, but much credit goes to all the GRTC, City, County, State, and regional agency staff (and other supporting consultants) who have worked hard on these issues for years and to the local transit advocates and organizers who have built grass roots support for more transit across the region.

So, get excited, Richmond and Henrico, for your new transit system is coming soon. And for those of you from other places who are interested in experiencing a transit redesign first hand, perhaps you should plan a long weekend trip to Richmond for the June 24 opening. You could even volunteer to help with the changeover!

New York: Bus Network Redesign on the Horizon!

by Christopher Yuen

MTA New York City Transit has just unveiled a plan today to completely revamp its bus network.   Some elements of the plan that will be especially impactful (from their press release) include:

A completely redesigned bus route network.  NYC Transit is performing a top-to-bottom, holistic review and redesign of the entire city’s bus route network – the first in decades – based on public input, demographic changes and travel demand analysis.  Route changes will provide better connectivity and more direct service in every neighborhood, with updated stop spacing and the expansion of off-peak service on strategic routes.

Collaboration with NYCDOT, NYPD, & local communities.  NYC Transit will collaborate with NYCDOT [the city’s Department of Transportation] to expand the implementation of bus lanes, exclusive busways, queue jumps, bus stop arrival time displays and bus priority technology on traffic signals and buses known as “traffic signal priority.”  Many of these changes will also require robust community outreach.  NYC Transit will also advocate for strengthened [police] enforcement of bus lanes, dedicated transit-priority traffic teams, and legislative approval to expand bus-mounted cameras beyond 16 existing routes to help enforce bus lane rules in more locations.  (Most of the big wins in urban transit require transit agencies and city governments to work together.)

Speeding up boarding by using all doors.  NYC Transit is pursuing new approaches to speed up bus boarding, particularly using upcoming electronic tap-to-pay readers to facilitate all-door boarding.  While purchasing fare media with cash will always be an option with the new fare payment system being developed by the MTA, NYC Transit will also explore cashless options to speed up boarding time in select circumstances.

Transit routes are often tweaked in response to infrastructure changes, local desires, and complaints. Some of these changes serve specialized markets and may work well for some people’s specific trips, but over time, they erode the ability for a system to work well for the everyone else.  It takes a clean-slate redesign approach to create a network of simple, frequent and reliable lines.  The result, as has been the case in Houston, Coloubus, and Anchorage, is usually less routes in total, but more routes at higher frequencies all day, 7 days a week.

It’s also promising to see the New York MTA include measures to improve the speed and reliability of buses.  Since the speed of urban transit is not determined by how fast vehicles go, but by how often they have to stop, increased stop spacing, all-door boarding and properly enforced bus-only lanes will help keep people moving, especially during rush hour when traffic congestion and crowding has its worst impacts.   It’s also important to note that for transit, time is money, so faster service means more service for the same operating budget.

New York’s plan is ambitious, and potentially very impactful, so this will be an interesting story to follow over the coming years.