At about 15 square miles, the City of Alexandria is relatively small, but it is firmly within the core of the Washington metropolitan region with key job centers like the large Department of Defense facility at Mark Center, a historic Old Town that draws many tourists, burgeoning employment centers like Eisenhower East, and many leafy suburban neighborhoods. It grew and changed dramatically, along with the rest of Washington region, in the latter half of the 20th Century, much of it in an auto-oriented design. And like many of the inner suburban areas of the Washington region, Alexandria is trying to find its way to a more transit-focused future, because in the nations 6th largest metro area, there’s just not room for everyone to get around by car.
When looking at Alexandria in the context of the ridership recipe, a key feature is that most of the density is around the edges of the city, along the Metrorail lines to the east and south, and along I-395 to the north. But not all of that density is equally suited to high transit ridership. In the western parts of the city, much of the development is auto-oriented, with less connected streets and poor walkability. In the middle of the city is a large area of primarily low density residential that is not dense or walkable. This doughnut pattern makes the transit network design and planning work particularly interesting and challenging for Alexandria.
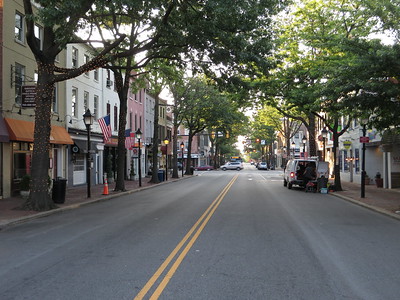
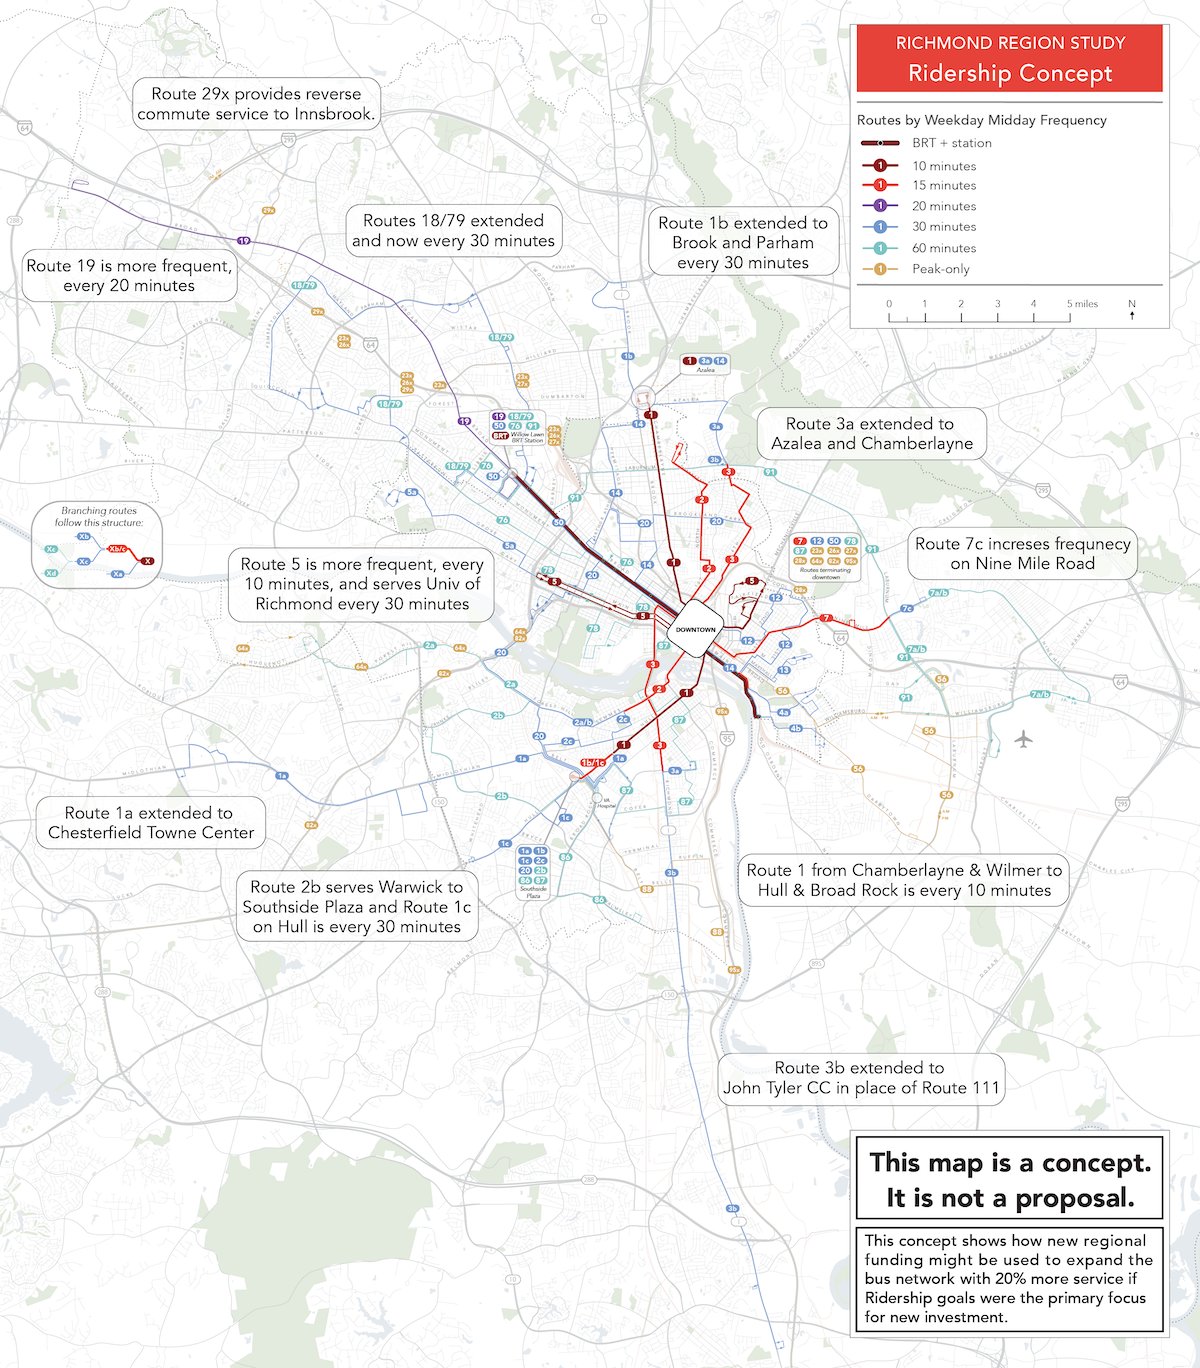
Old Town Alexandria (Photo: Ken Lund https://flic.kr/p/o5Pgtc)
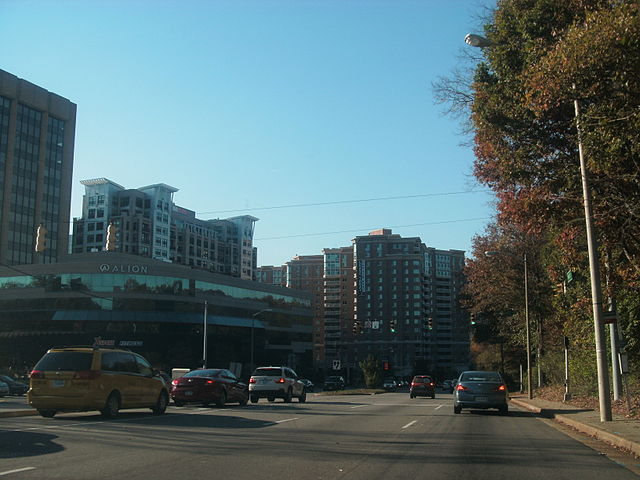
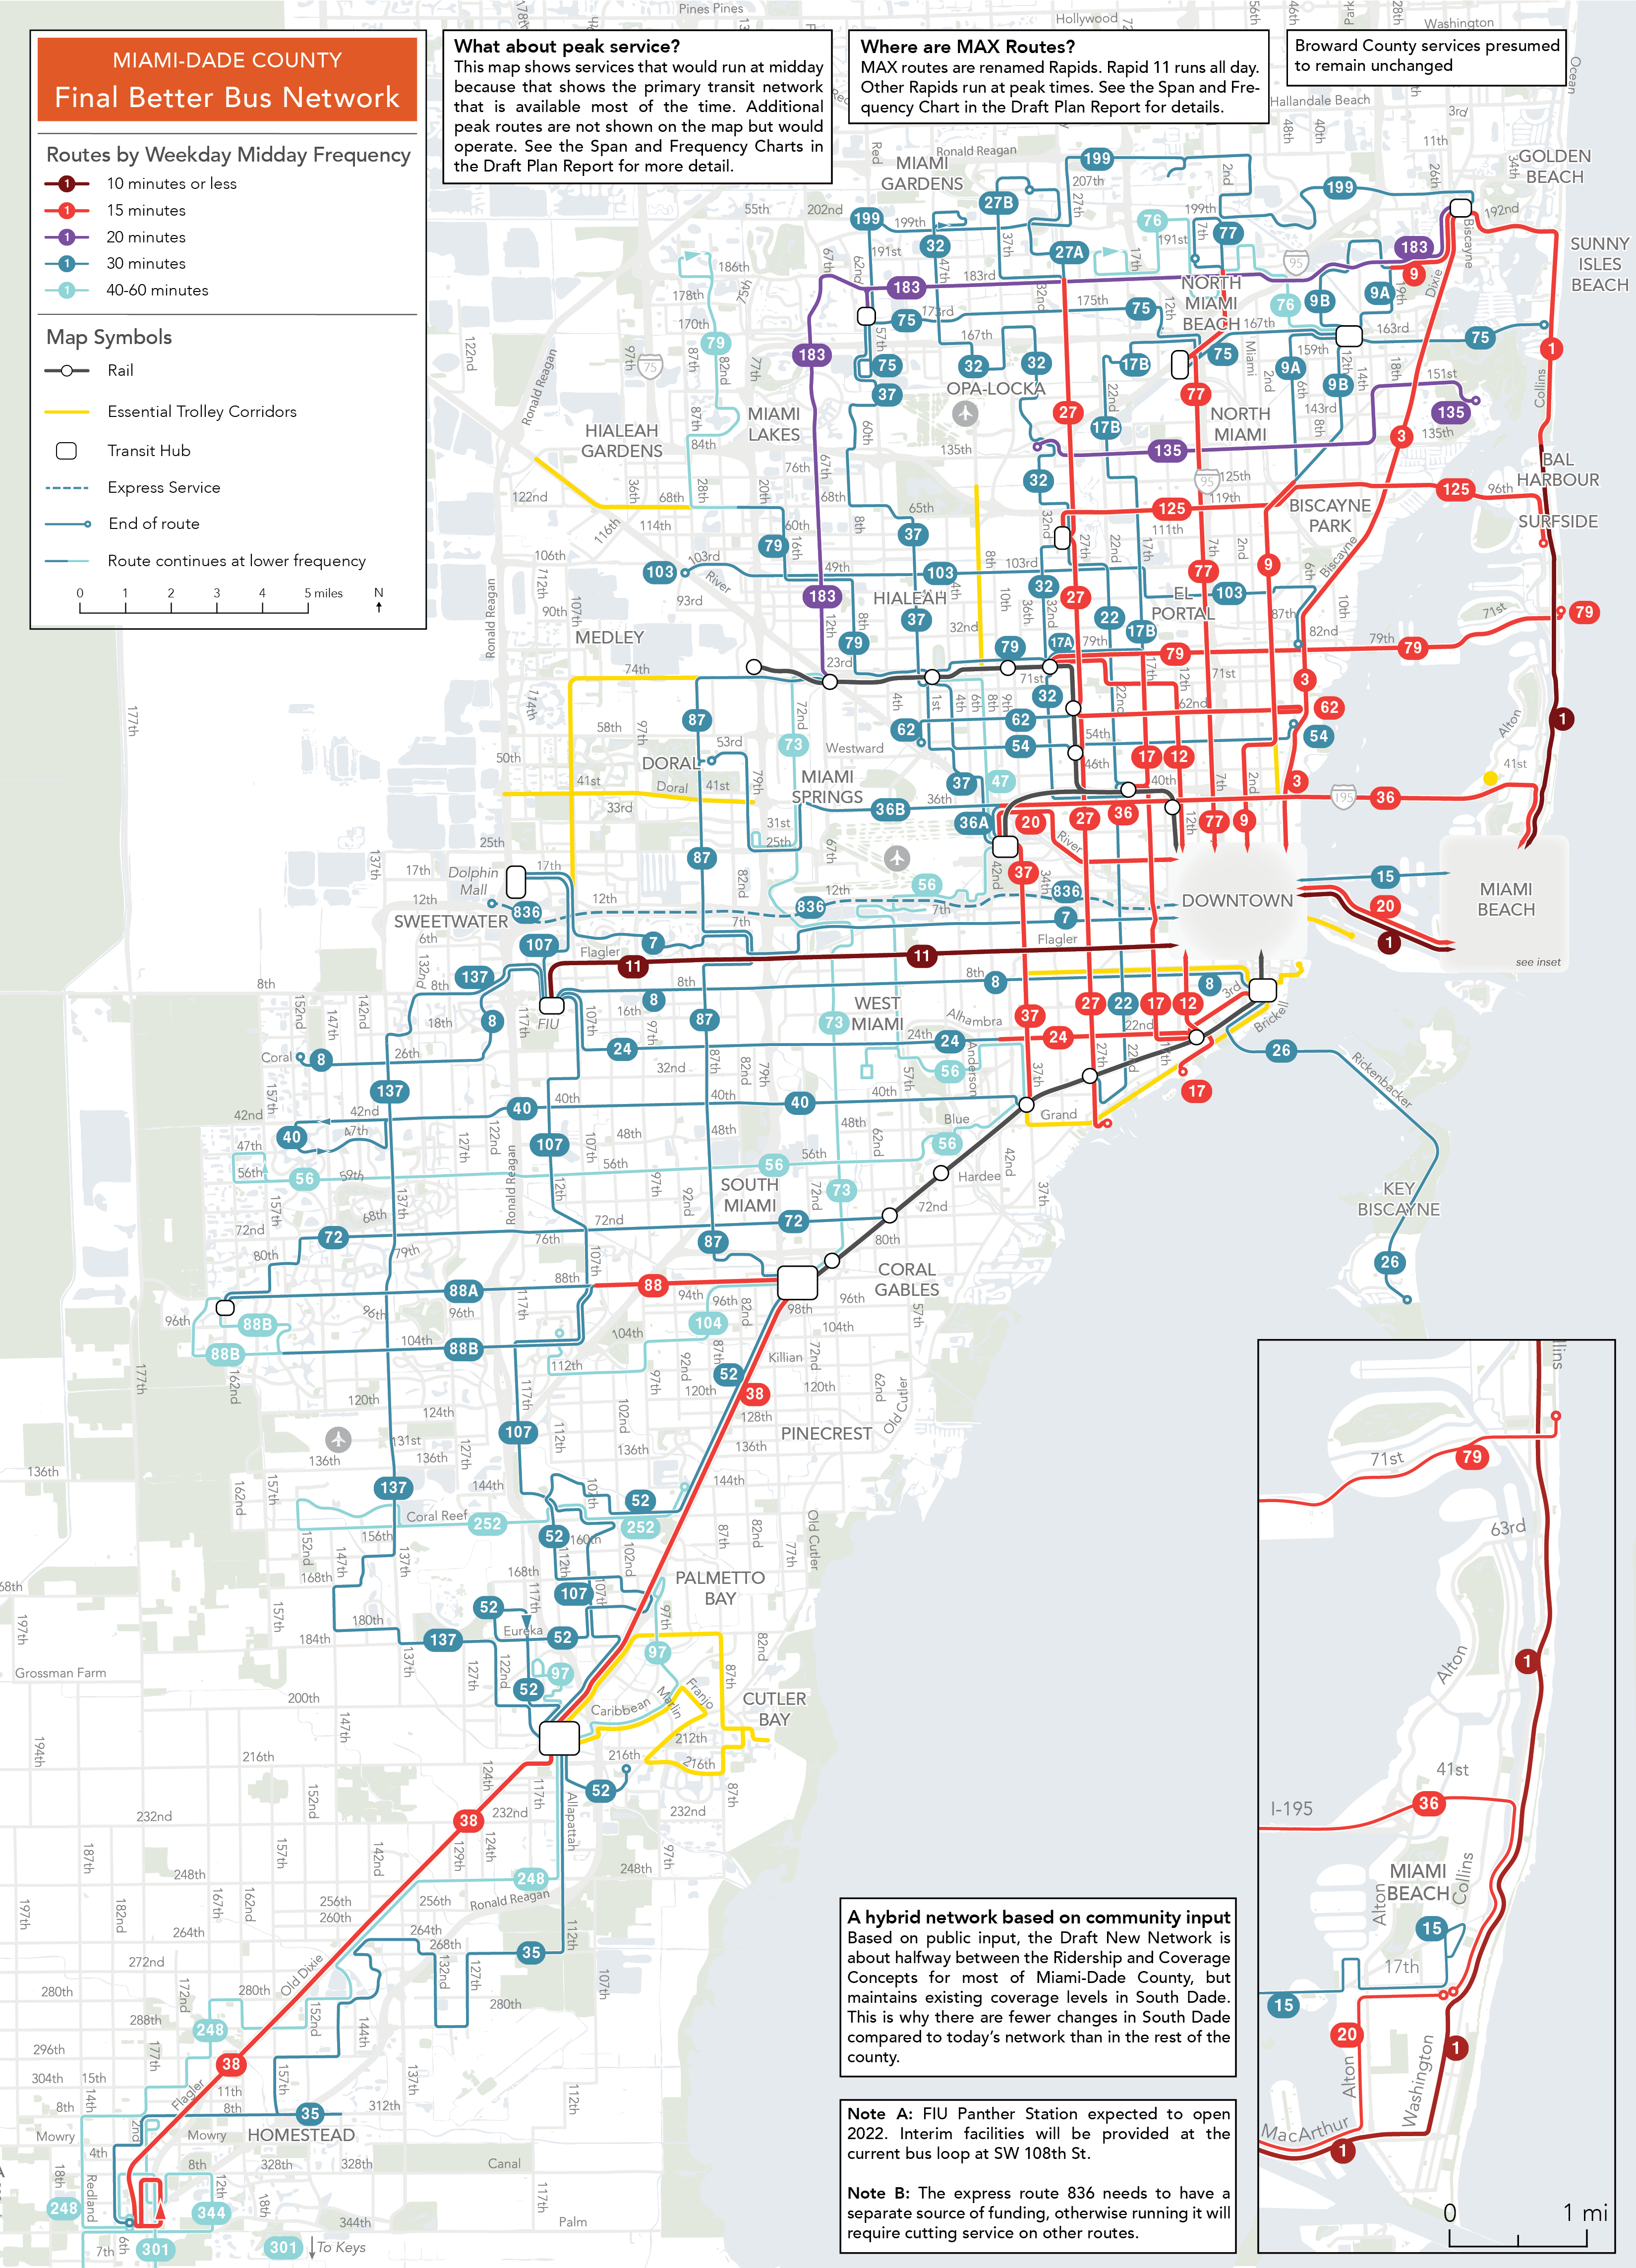
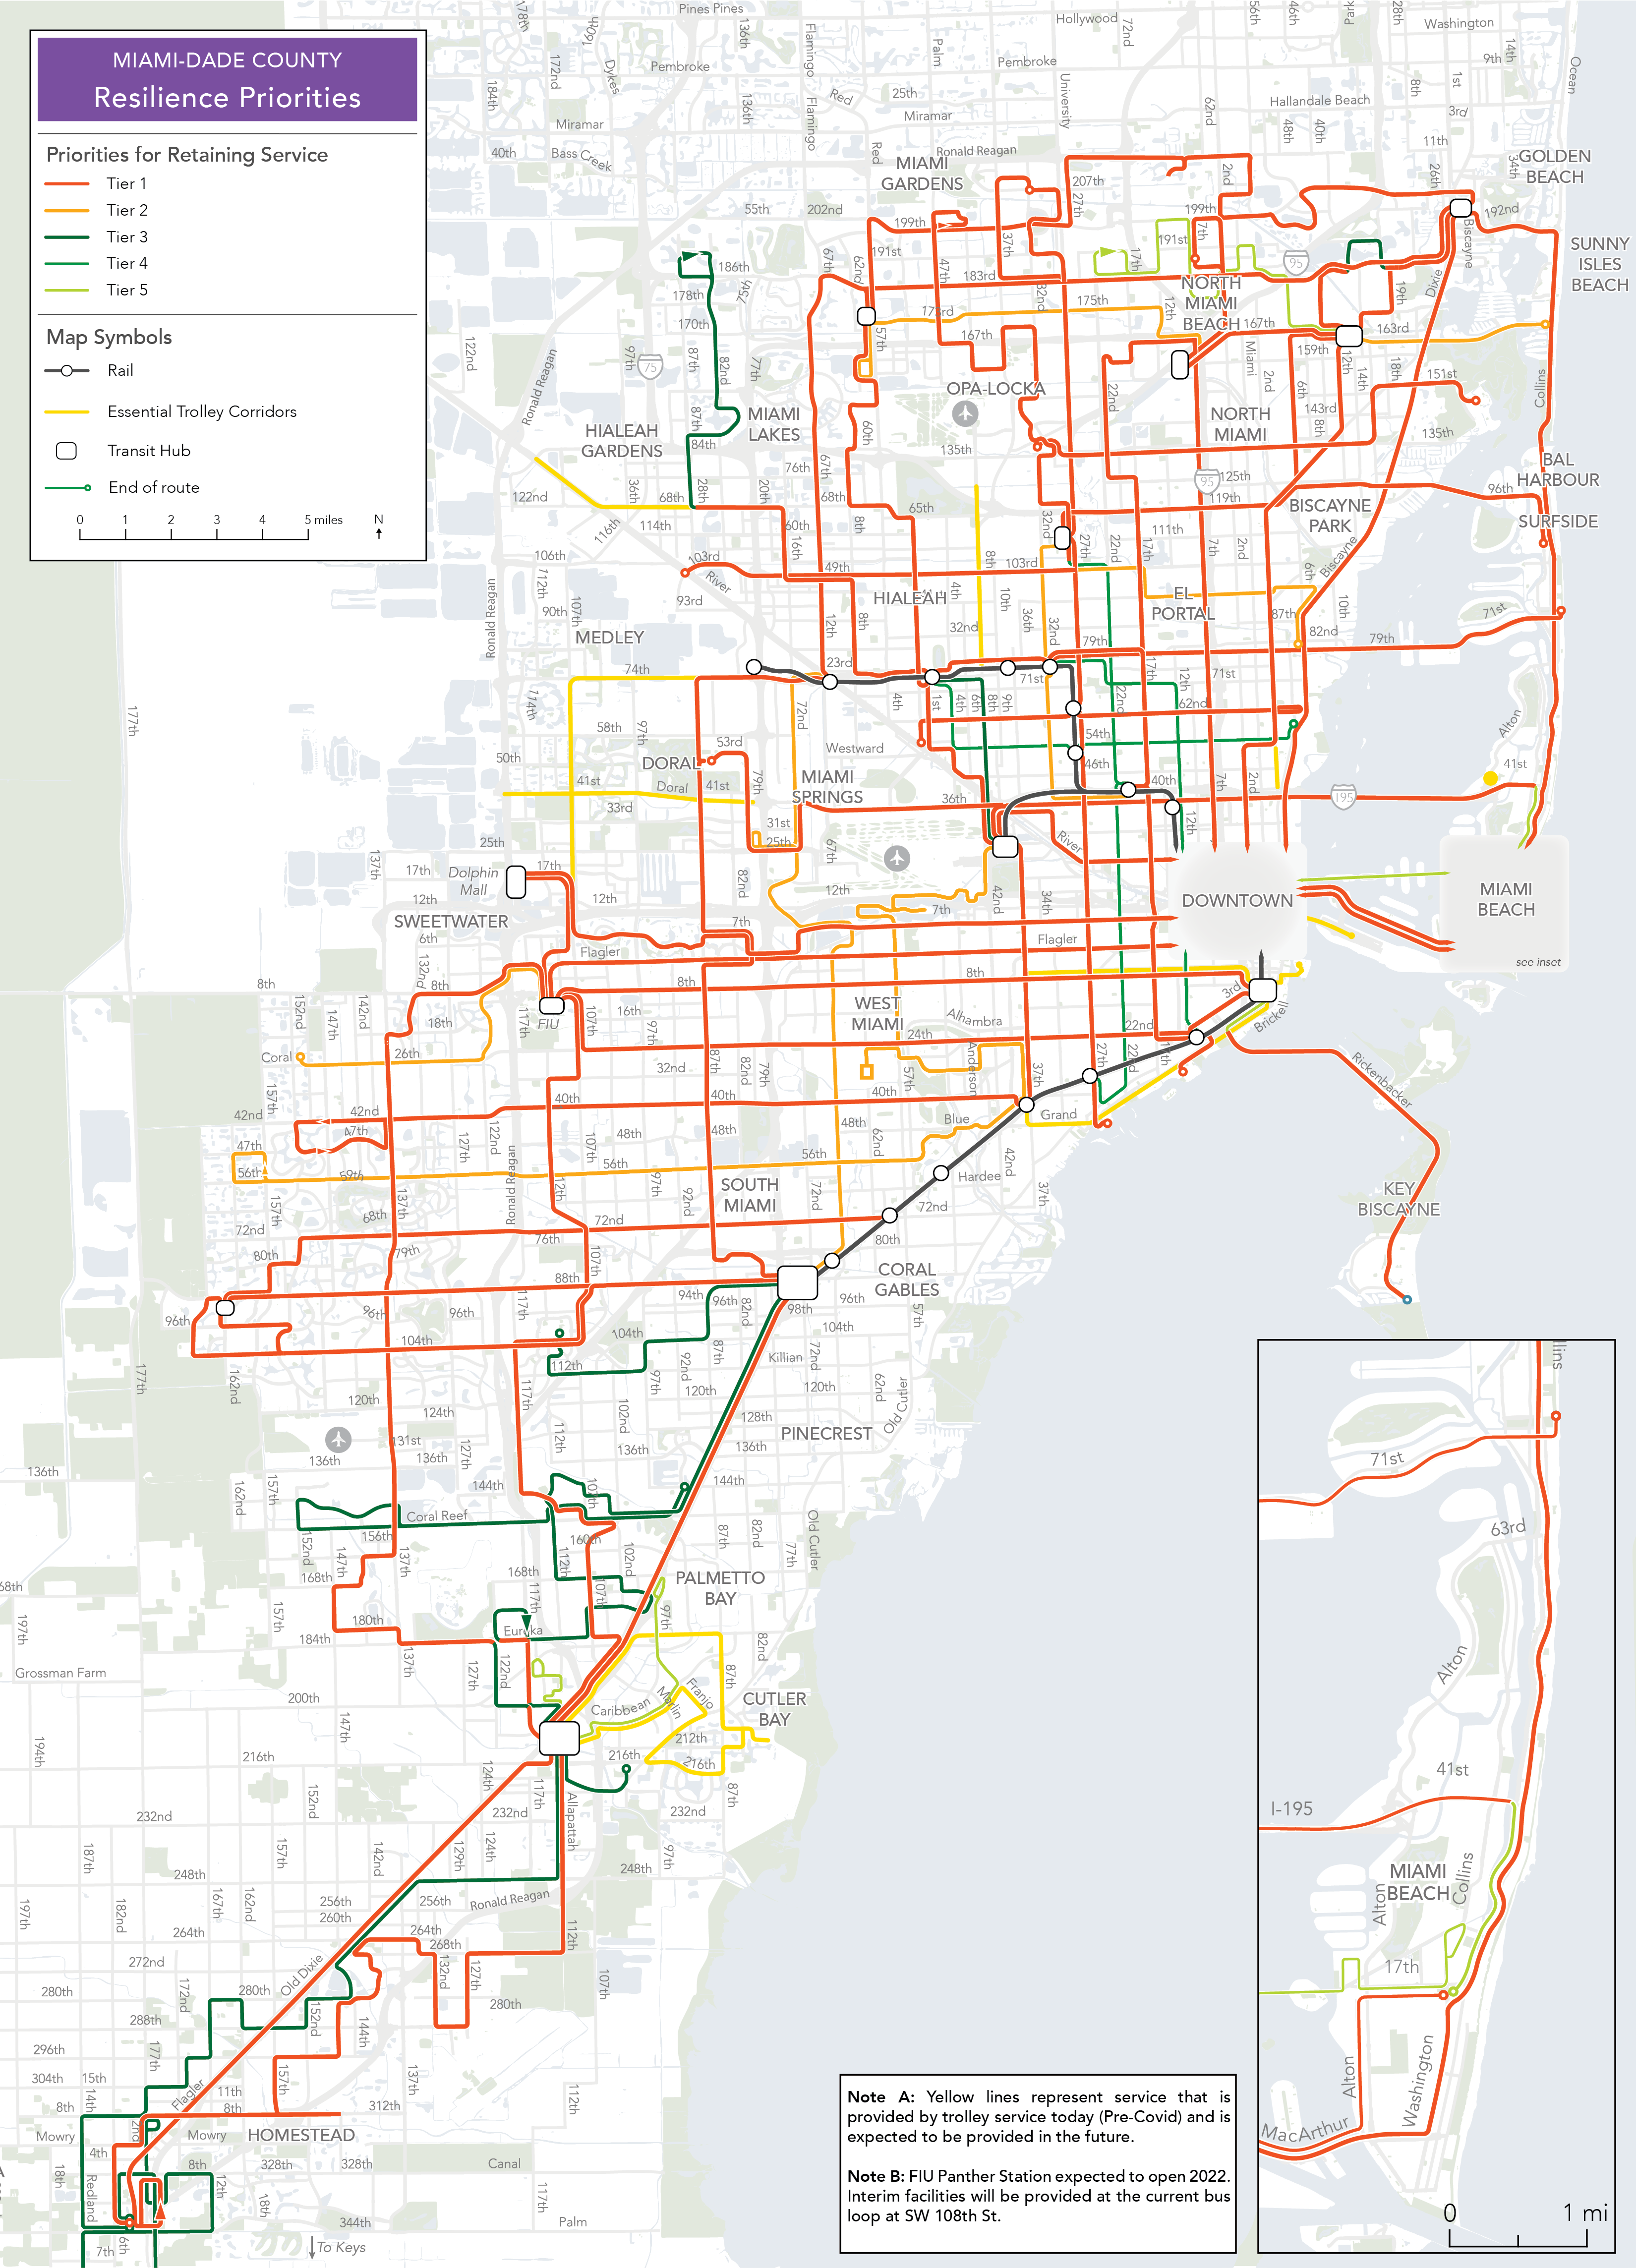
Skyscrapers_on_King_Street West End Alexandria Virginia (Photo: Ser Amantio di Nicolao via Wikimedia.org)
In that context, we’ve been working with the City, its local transit agency (DASH), and the regional transit agency (WMATA), on the Alexandria Transit Vision since 2018. The City recently released the Draft Recommended Networks that we helped design.
The networks are designed around the policy direction from the DASH Board that, by 2030, 85% of resources should go toward high ridership service. The plan includes a short-term network that could be implemented as soon as 2022, with no new service hours. It also includes an option to improve evening and weekend service in the short-term with new investment. Plus, the plan includes the ambitious Vision Network, a 2030 plan to expand the frequent network and evening and weekend service to substantially increase access across the city, seven days a week.
A major focus of the plan is building up a frequent network from what is mostly a low frequency system with lots of one-seat rides today. That means some trips that a person can make today on one bus might require two buses in the future, but the frequency of service means that total wait time is the same, or less, than today.
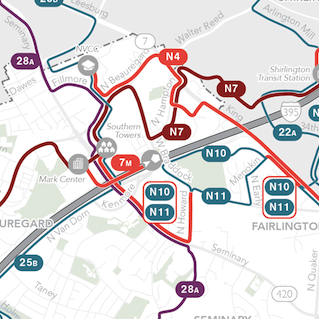
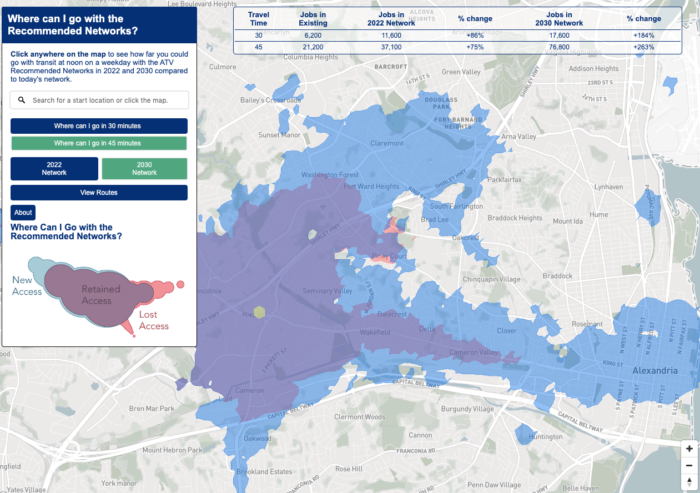
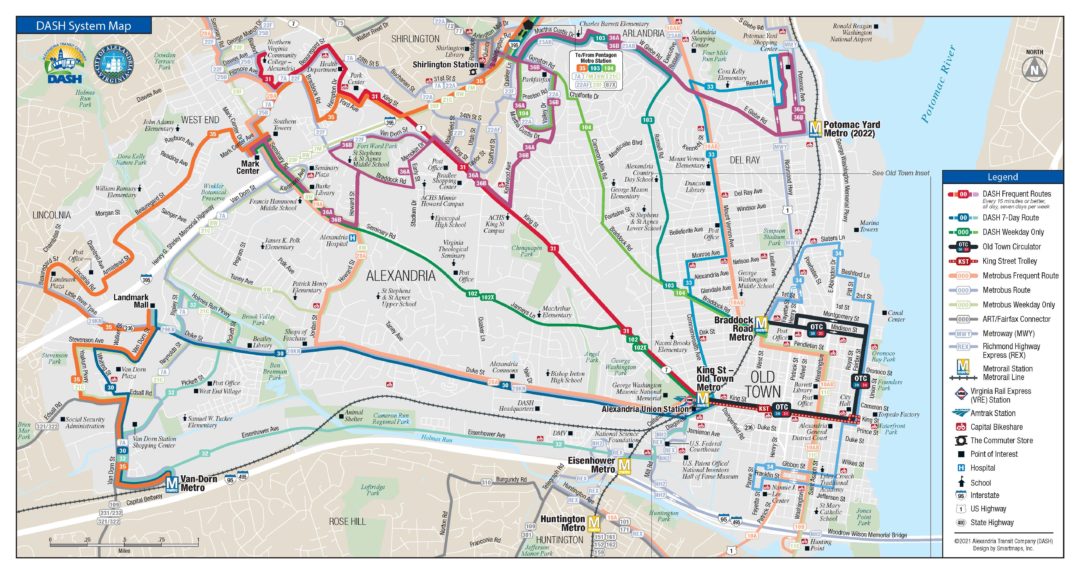
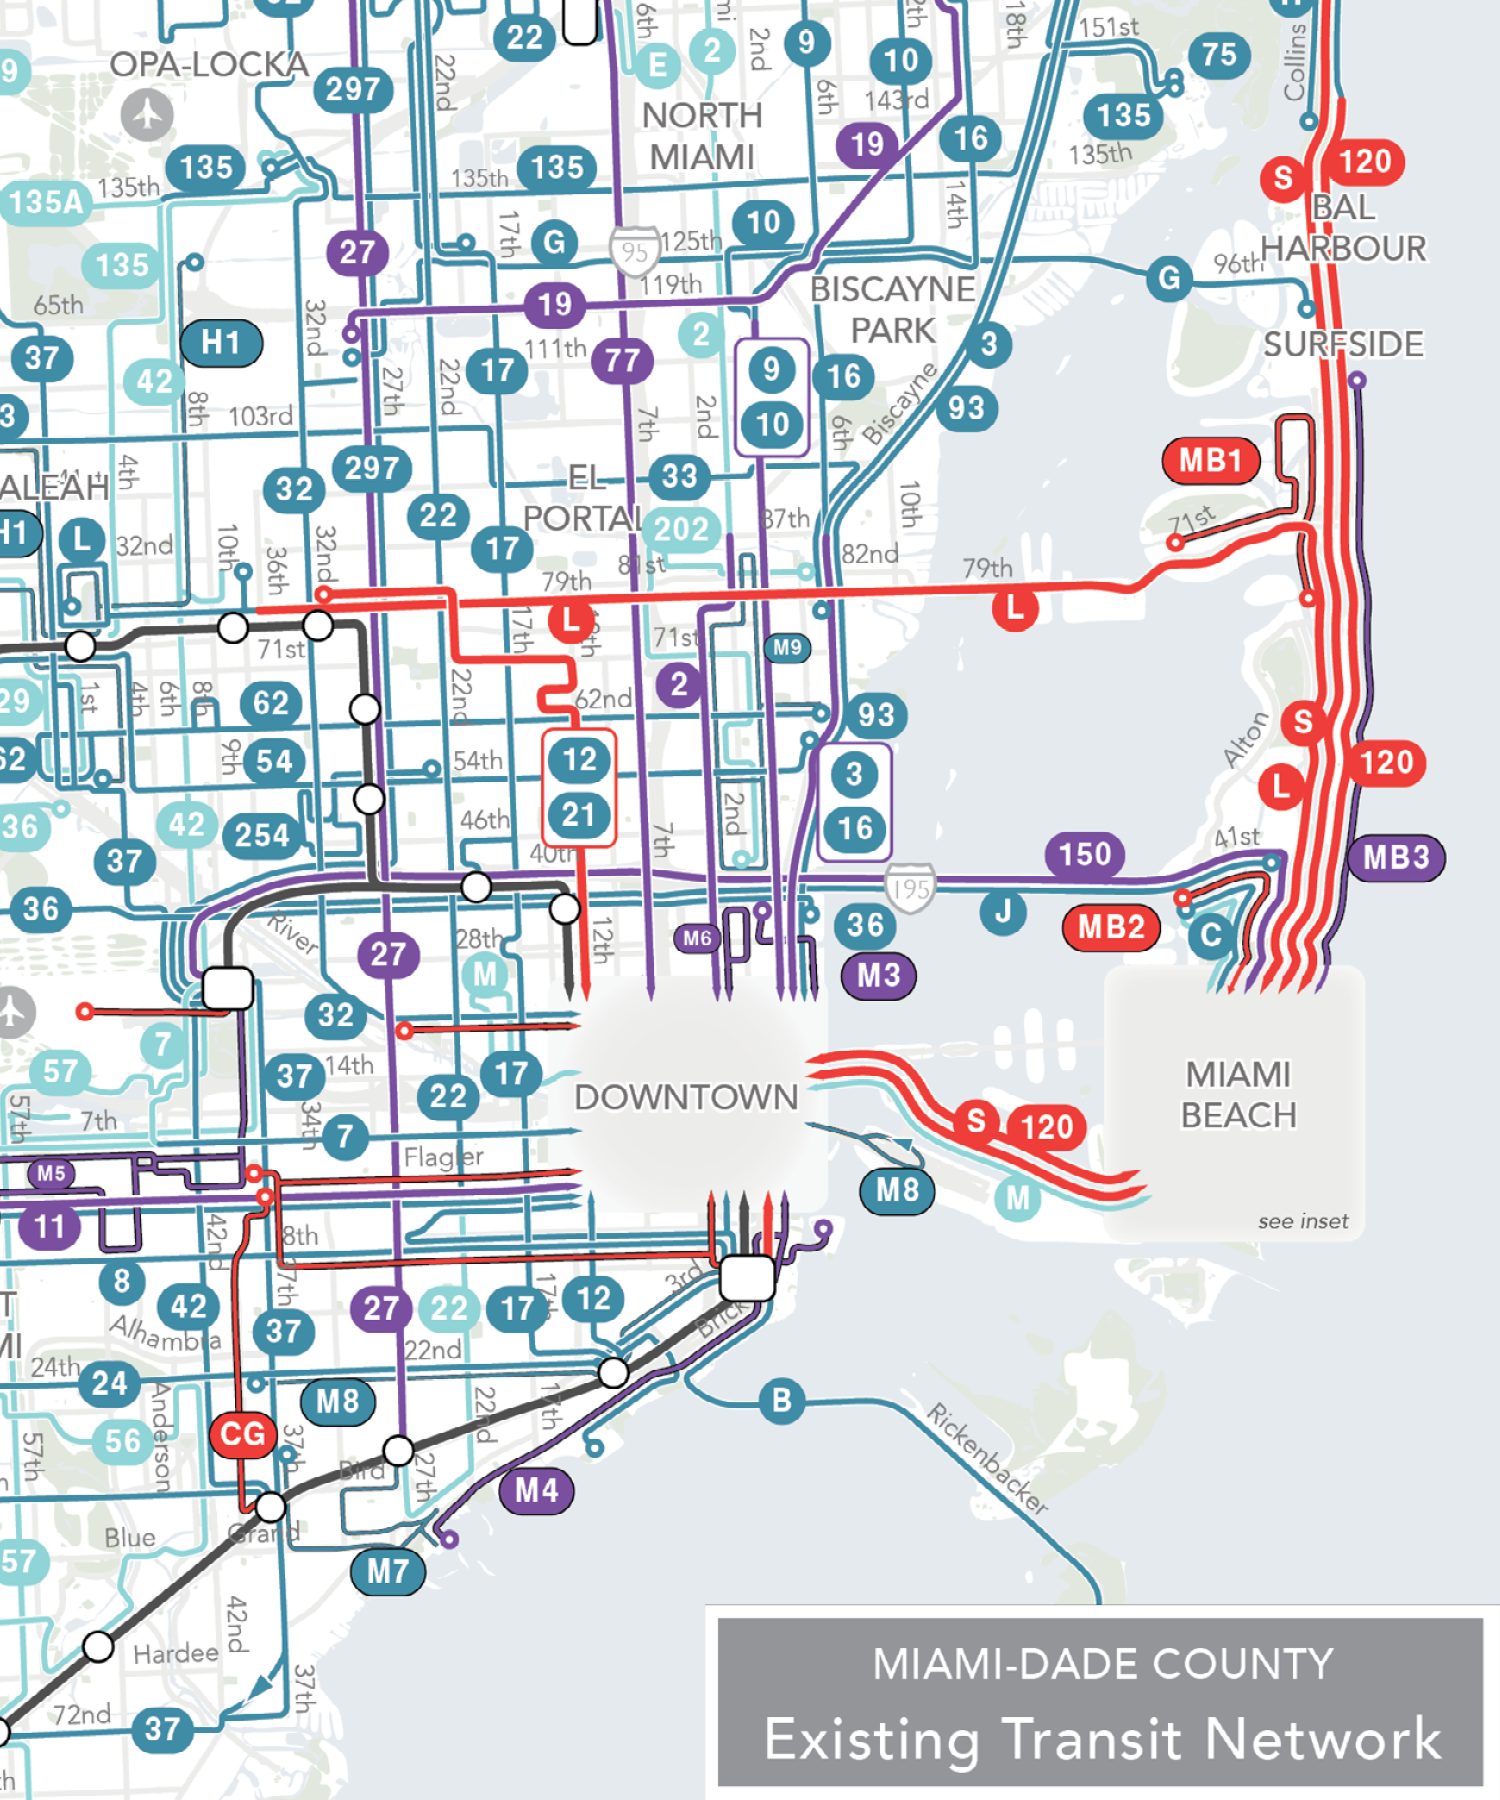
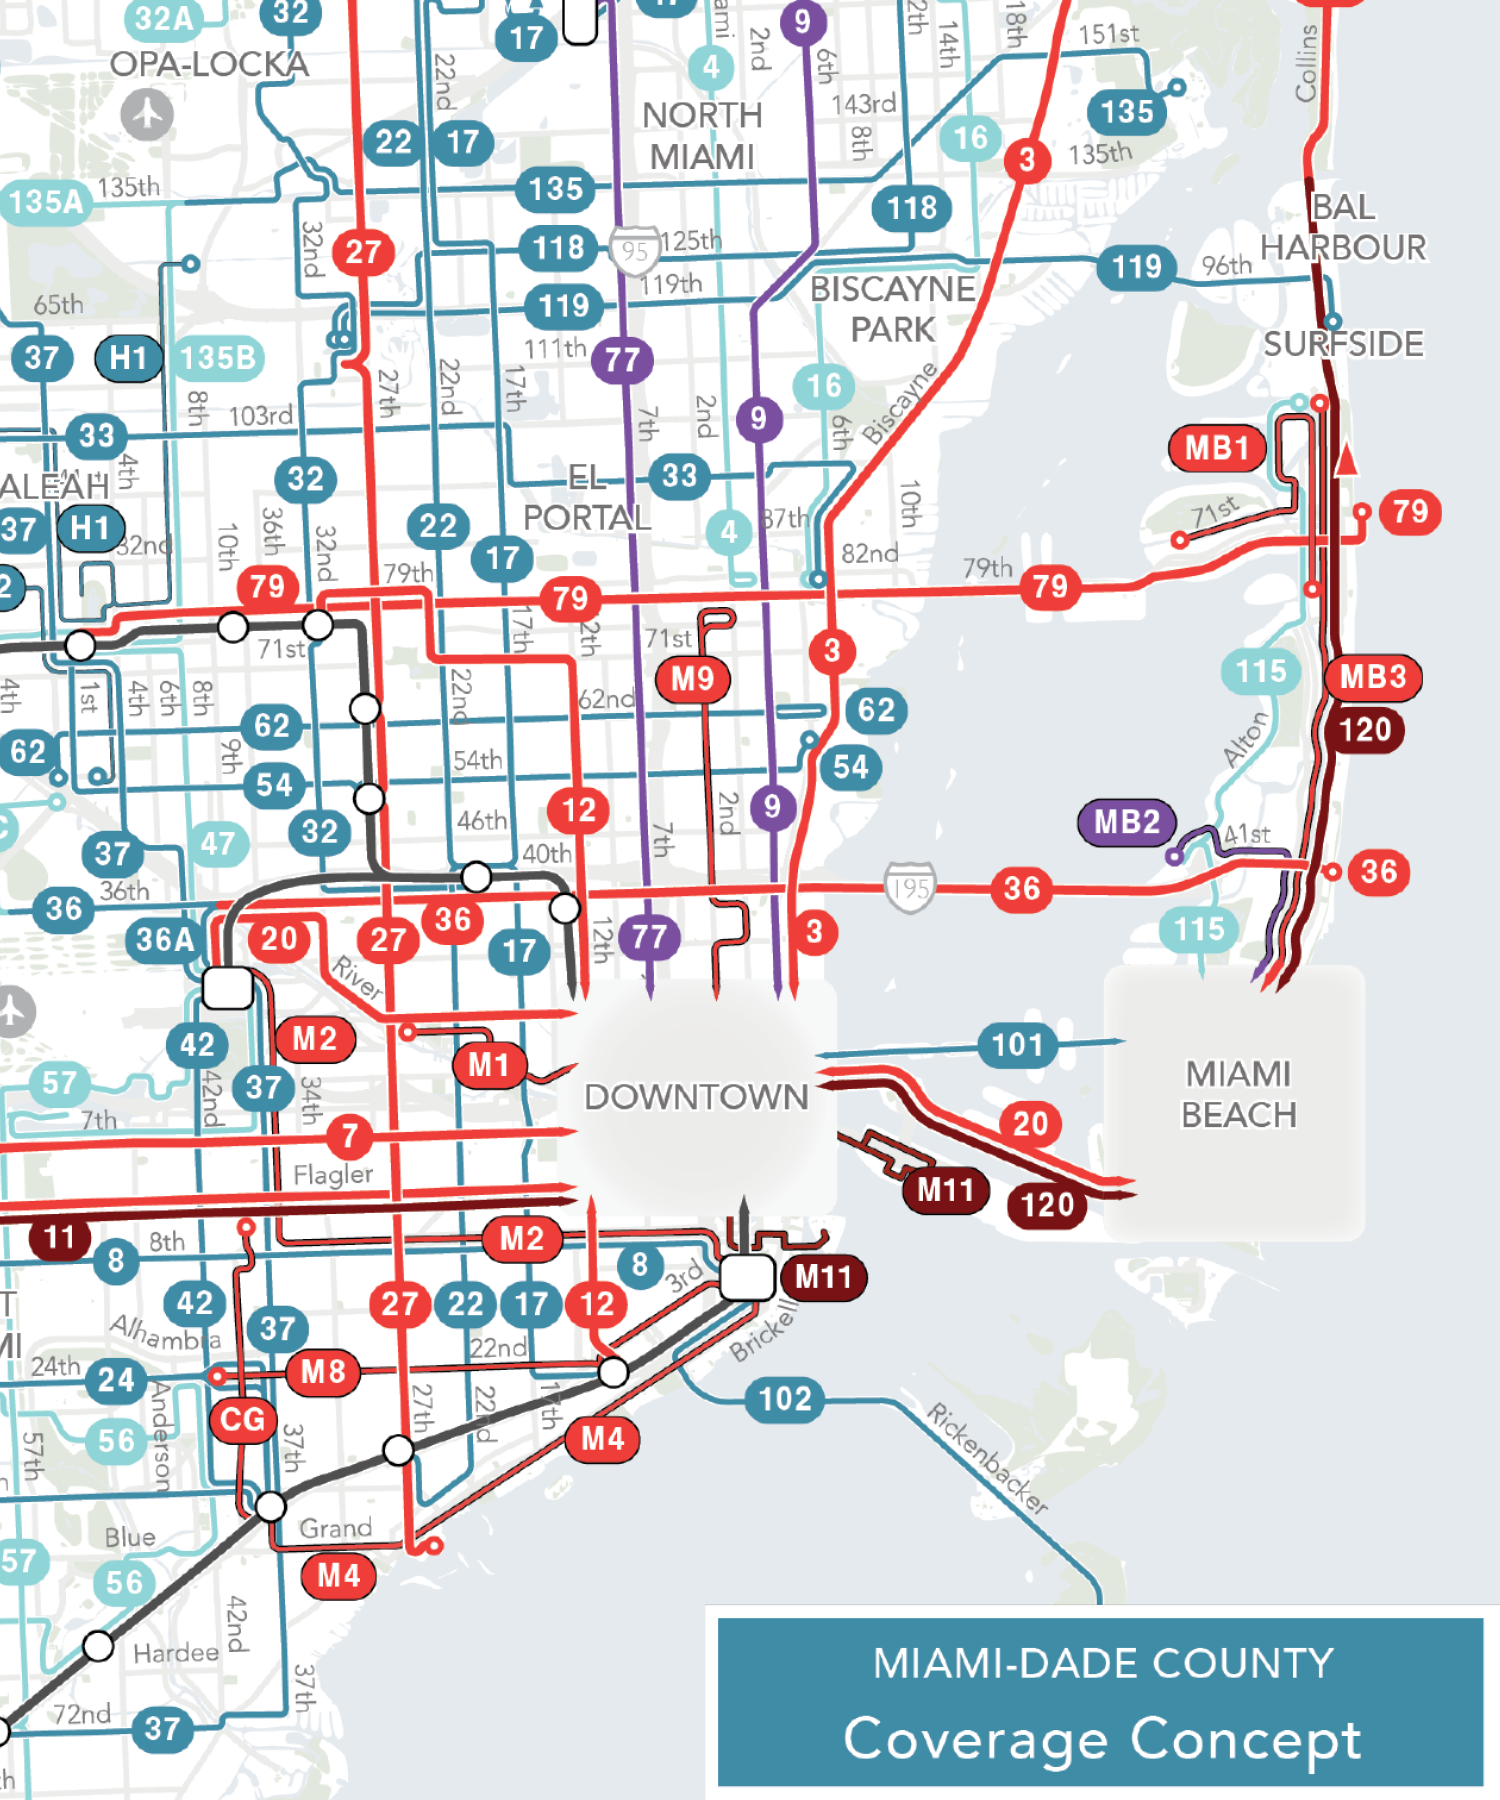
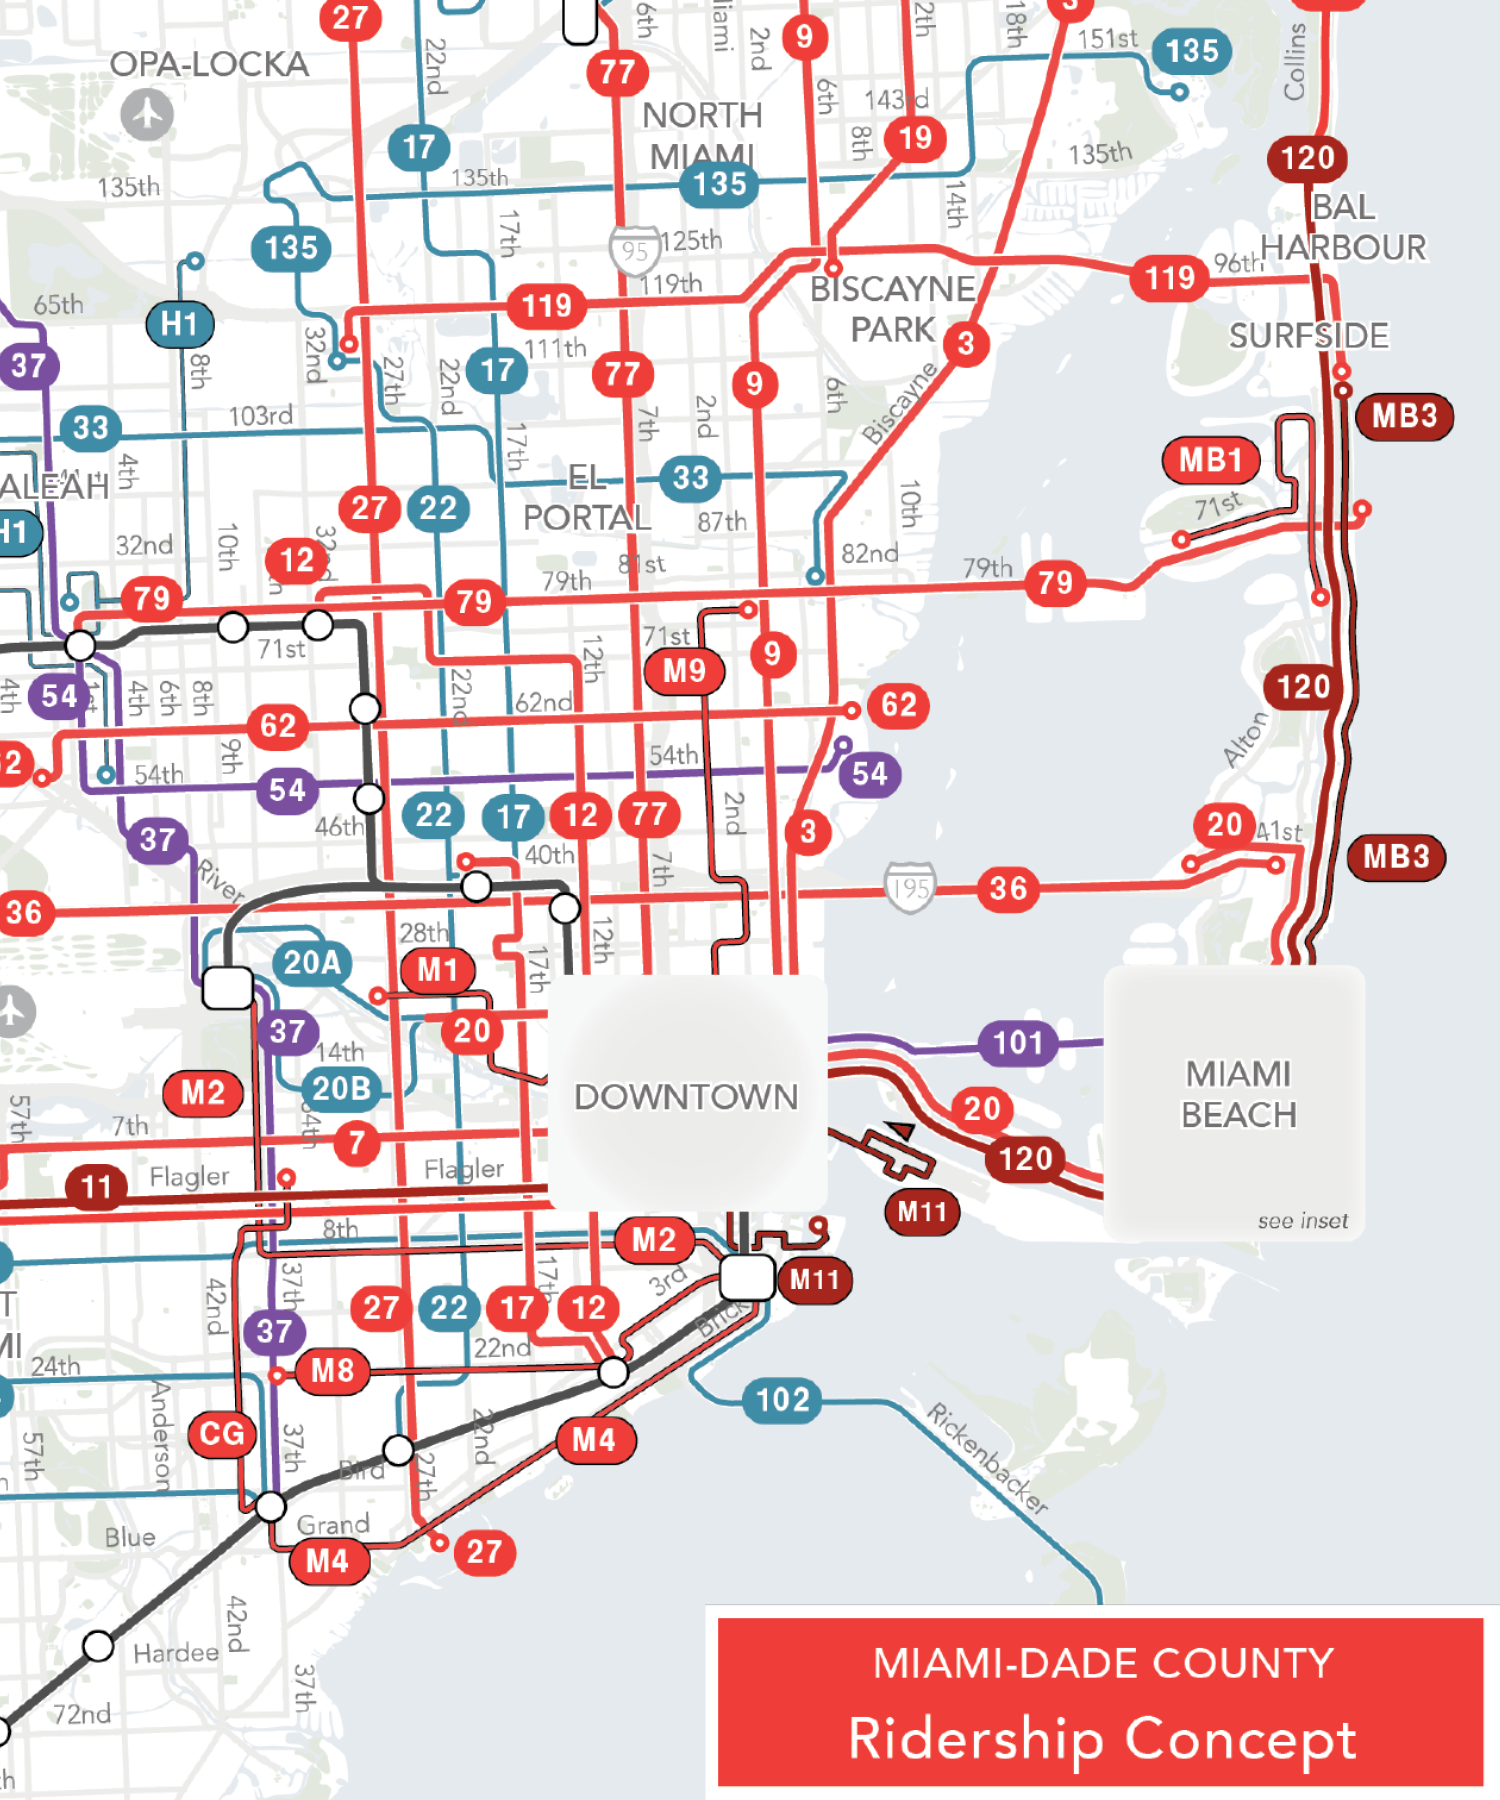
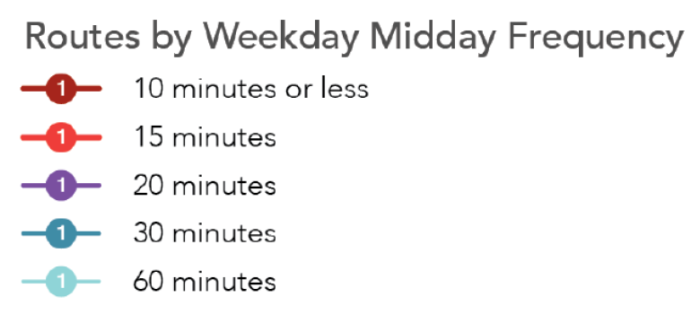
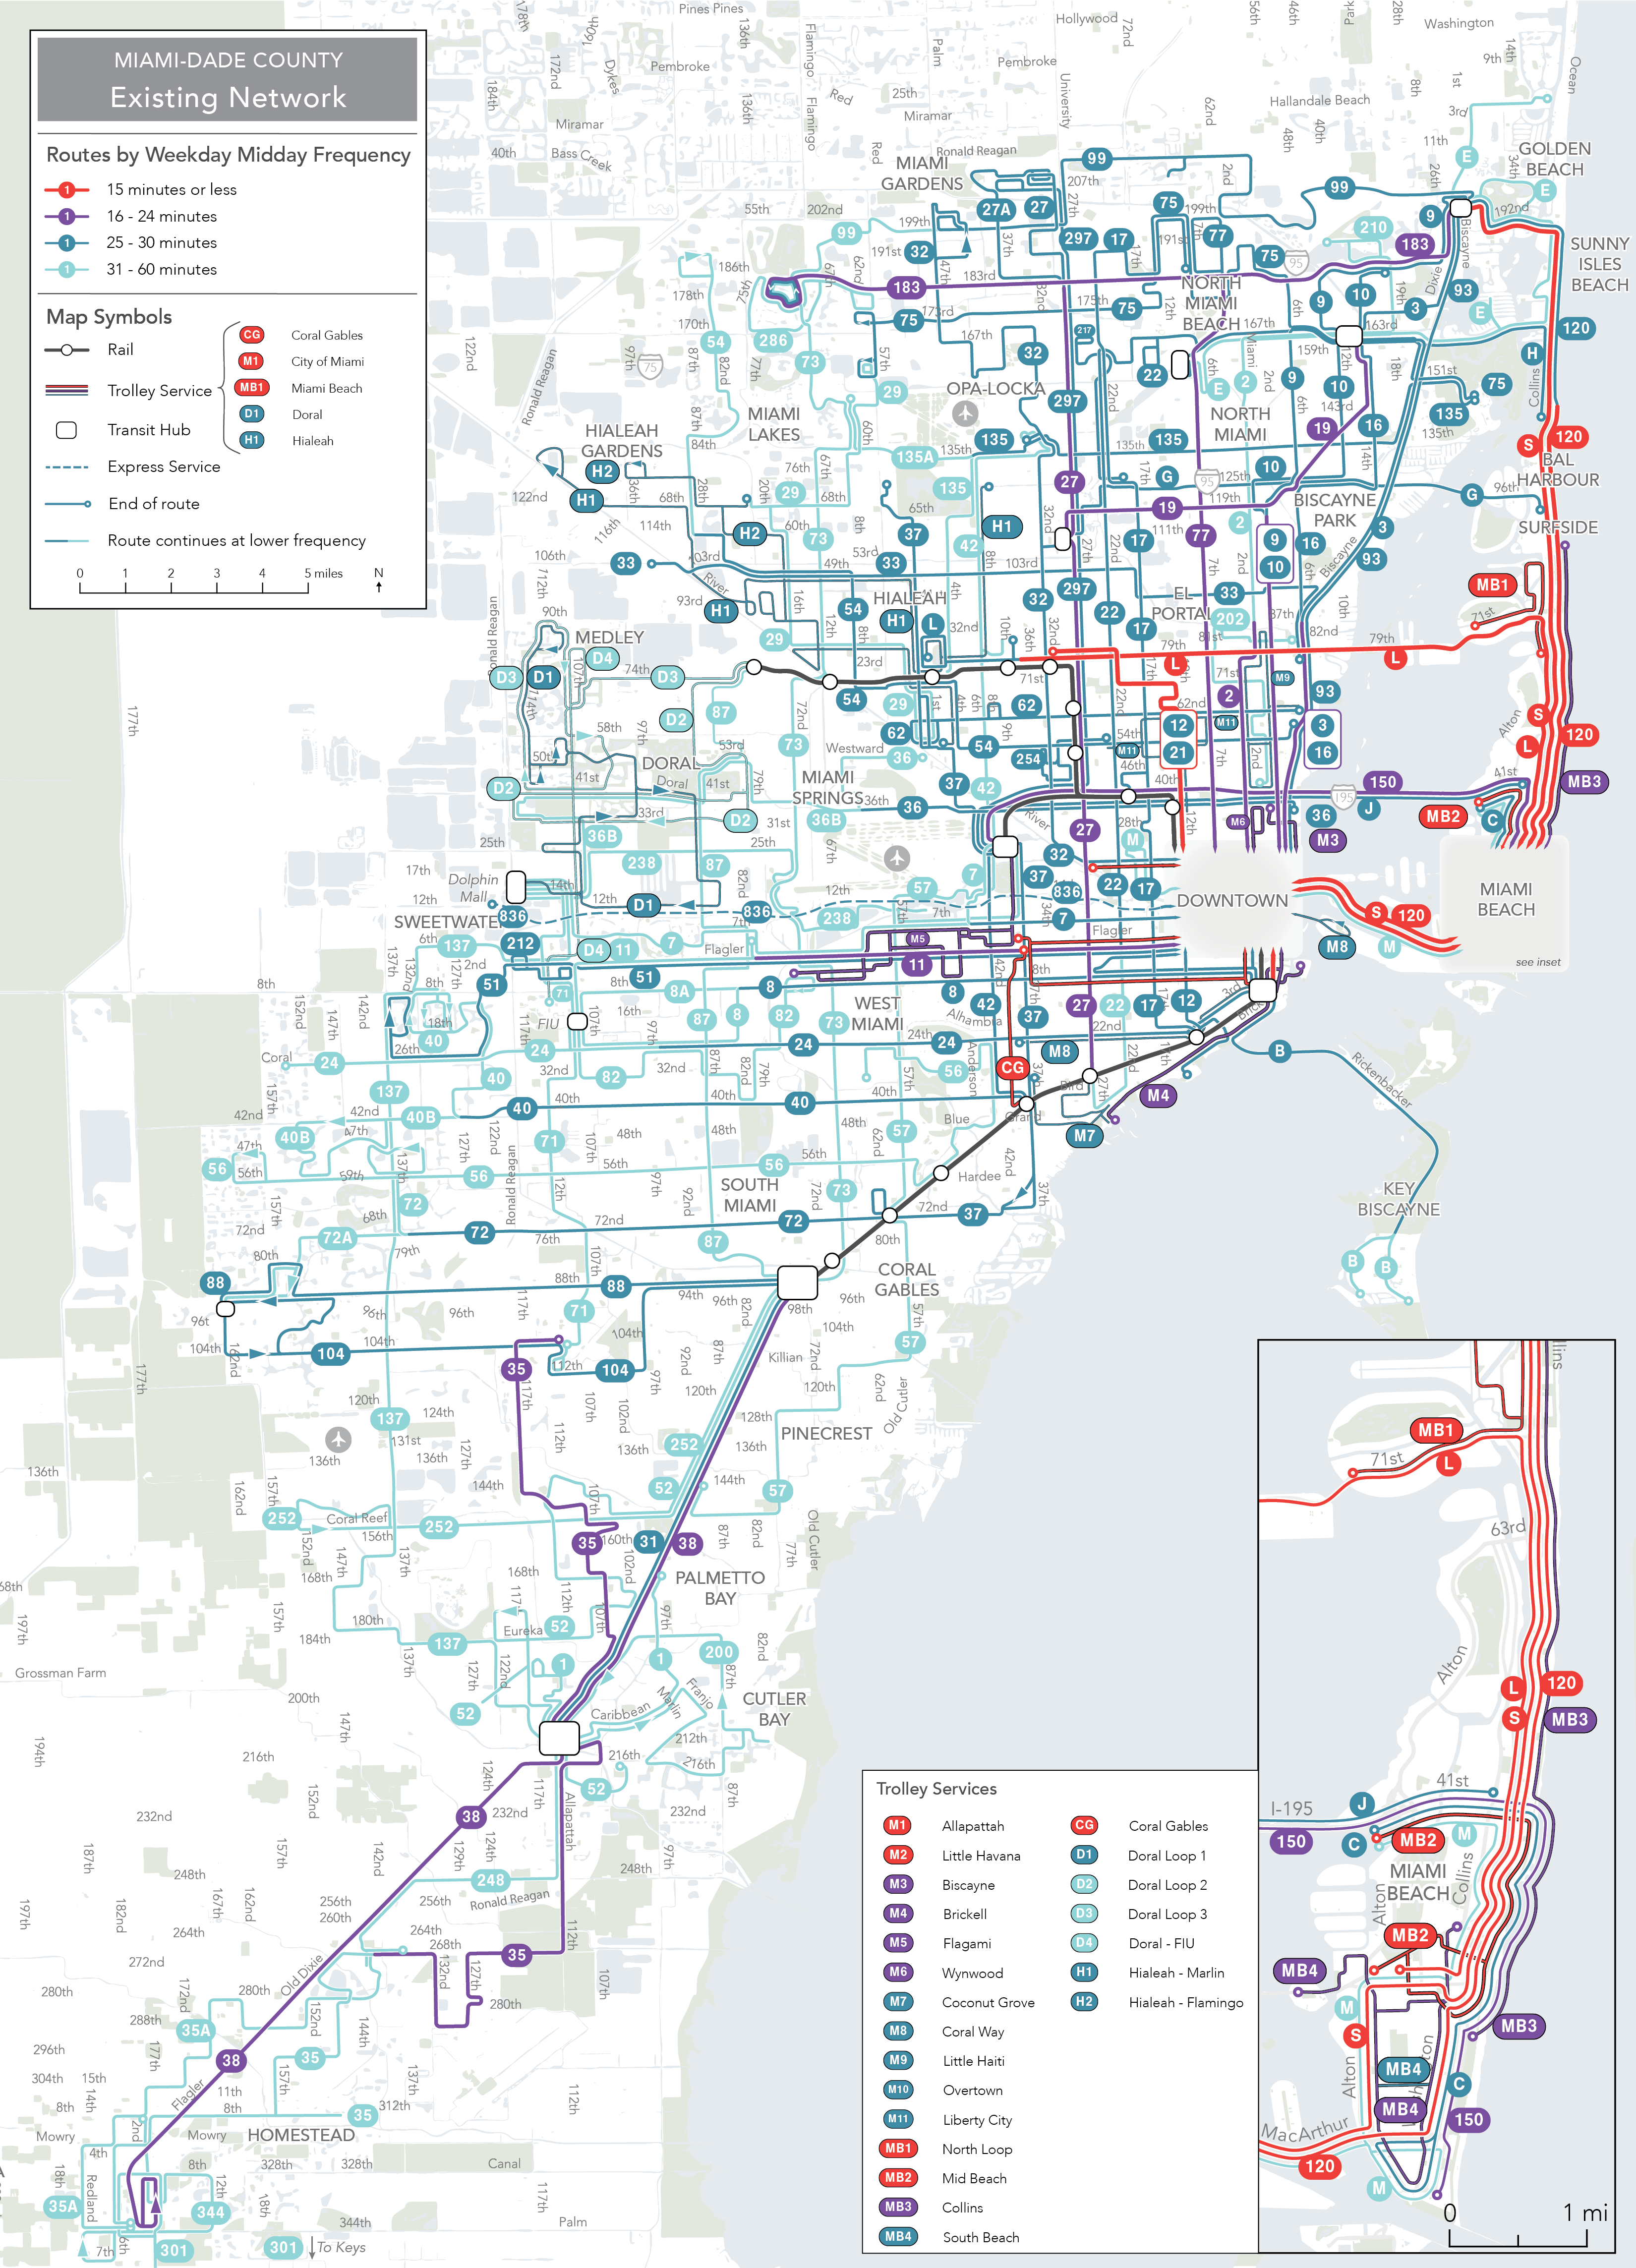
The slices of the network maps below show the western part of the city, where today many overlapping routes provide low frequency service to many destinations, but you can’t get anywhere soon with such long waits. The 2022 and 2030 networks dramatically simplify service and increase frequency to expand liberty and access through connections to other frequent routes.
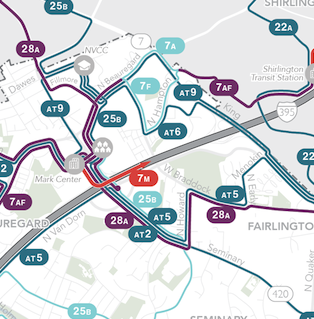
Existing Network
2022 Network
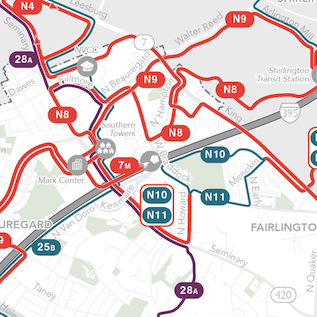
2030 Network
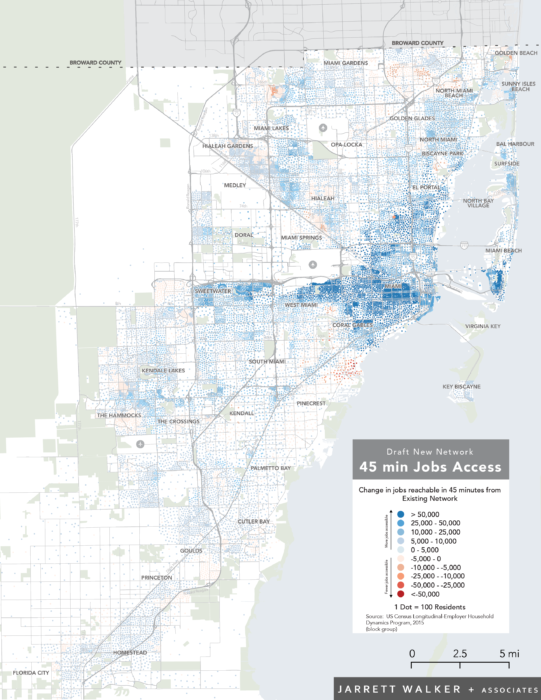
Outcomes
The 2022 Recommended Network would increase the number of jobs that the average person could reach in 45 minutes at midday on weekdays by 13%. That is with a network with zero increase in service hours, just reallocating existing DASH and WMATA services in the city.
An 8% increase in service in the short-term (2022) could improve evening and weekend service so more people could get more places all week long. Specifically, it would increase the percent of residents near frequent service on Saturdays from 36% to 65% and on Sundays from 15% to 59%.
The longer-term Vision Network for 2030 would increase job access even more, helping the average resident reach 18% more jobs in 45 minutes at noon on weekdays. Plus, it would increase evening and weekend service, brining frequent service to 79% of residents on Saturdays and 74% on Sundays.
The vast majority of people and places in Alexandria see substantial improvements in overall access and freedom via transit with these networks, but like any change there are some trade-offs. Some parts of the city, particularly in the lower density center, see a decrease in service and also a decrease in access by transit.
These trade-offs were part of the concepts phase where we helped the public, stakeholders, and city leadership think through what goals they wanted to prioritize for transit in Alexandria. The outcome of that phase was the Board policy direction telling us to put 85% of resources toward Ridership Goals and 15% toward Coverage goals.
Your Liberty
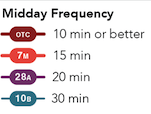
We’ve also put together an interactive webmap that you can use to explore the networks and see how they affect your liberty and access to opportunities: http://alexandriatransitvision.com/. The tool compares travel time isochrones for each concept and shows you the change in jobs reachable in 30 or 45 minutes.
In these maps, blue areas are newly reachable with the network concept, purple areas are reachable with both the existing network and the concept, and red areas are where you can travel with the existing network that is no longer reachable with the concept. You can also click the “View Routes” button to explore the network structure.
Here’s a quick comparison for the Landmark Mall vicinity showing the area that would be reachable in 45 minutes with the 2030 Recommended Network:
Screen Shot Landmark Mall Isochrone
The City is working with developers to remake this area of the City, adding new housing and commercial development. With the 2030 network, someone living here would be able to reach 76,800 more jobs than with the existing network. Of course, those jobs aren’t just places you could work, they also represent the shopping, education, recreation, and other opportunities you could reach in a reasonable amount of time.
More Information
There’s much more detail in the Draft Recommended Network Report and at the city’s website, including individual neighborhood details.
If you live, work, or visit Alexandria, you should consider these changes and take the survey about them here. At this stage there is no decision about whether to implement a plan such as this one. Any final plan will be revised based on public comment that comes in over the next couple of weeks. That means that if you like the plan, it’s important to comment to that effect, as well.


