When transit services are running every 30 minutes or worse, you can’t assume they connect with each other just because they cross on the map. Schedules need to be coordinated to make connections at low frequencies possible. The only technique that does this comprehensively is called a pulse or timed transfer.
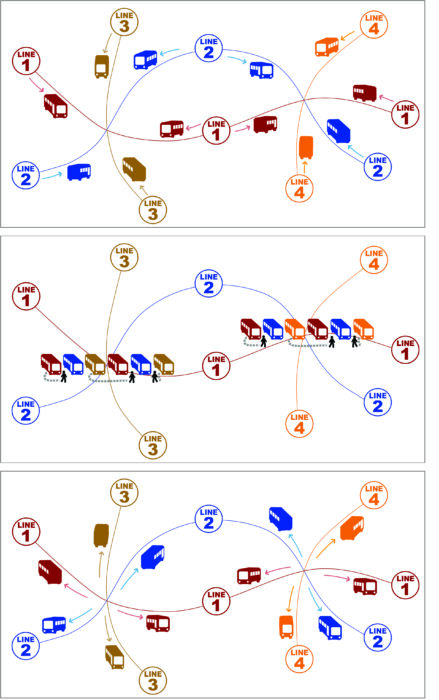
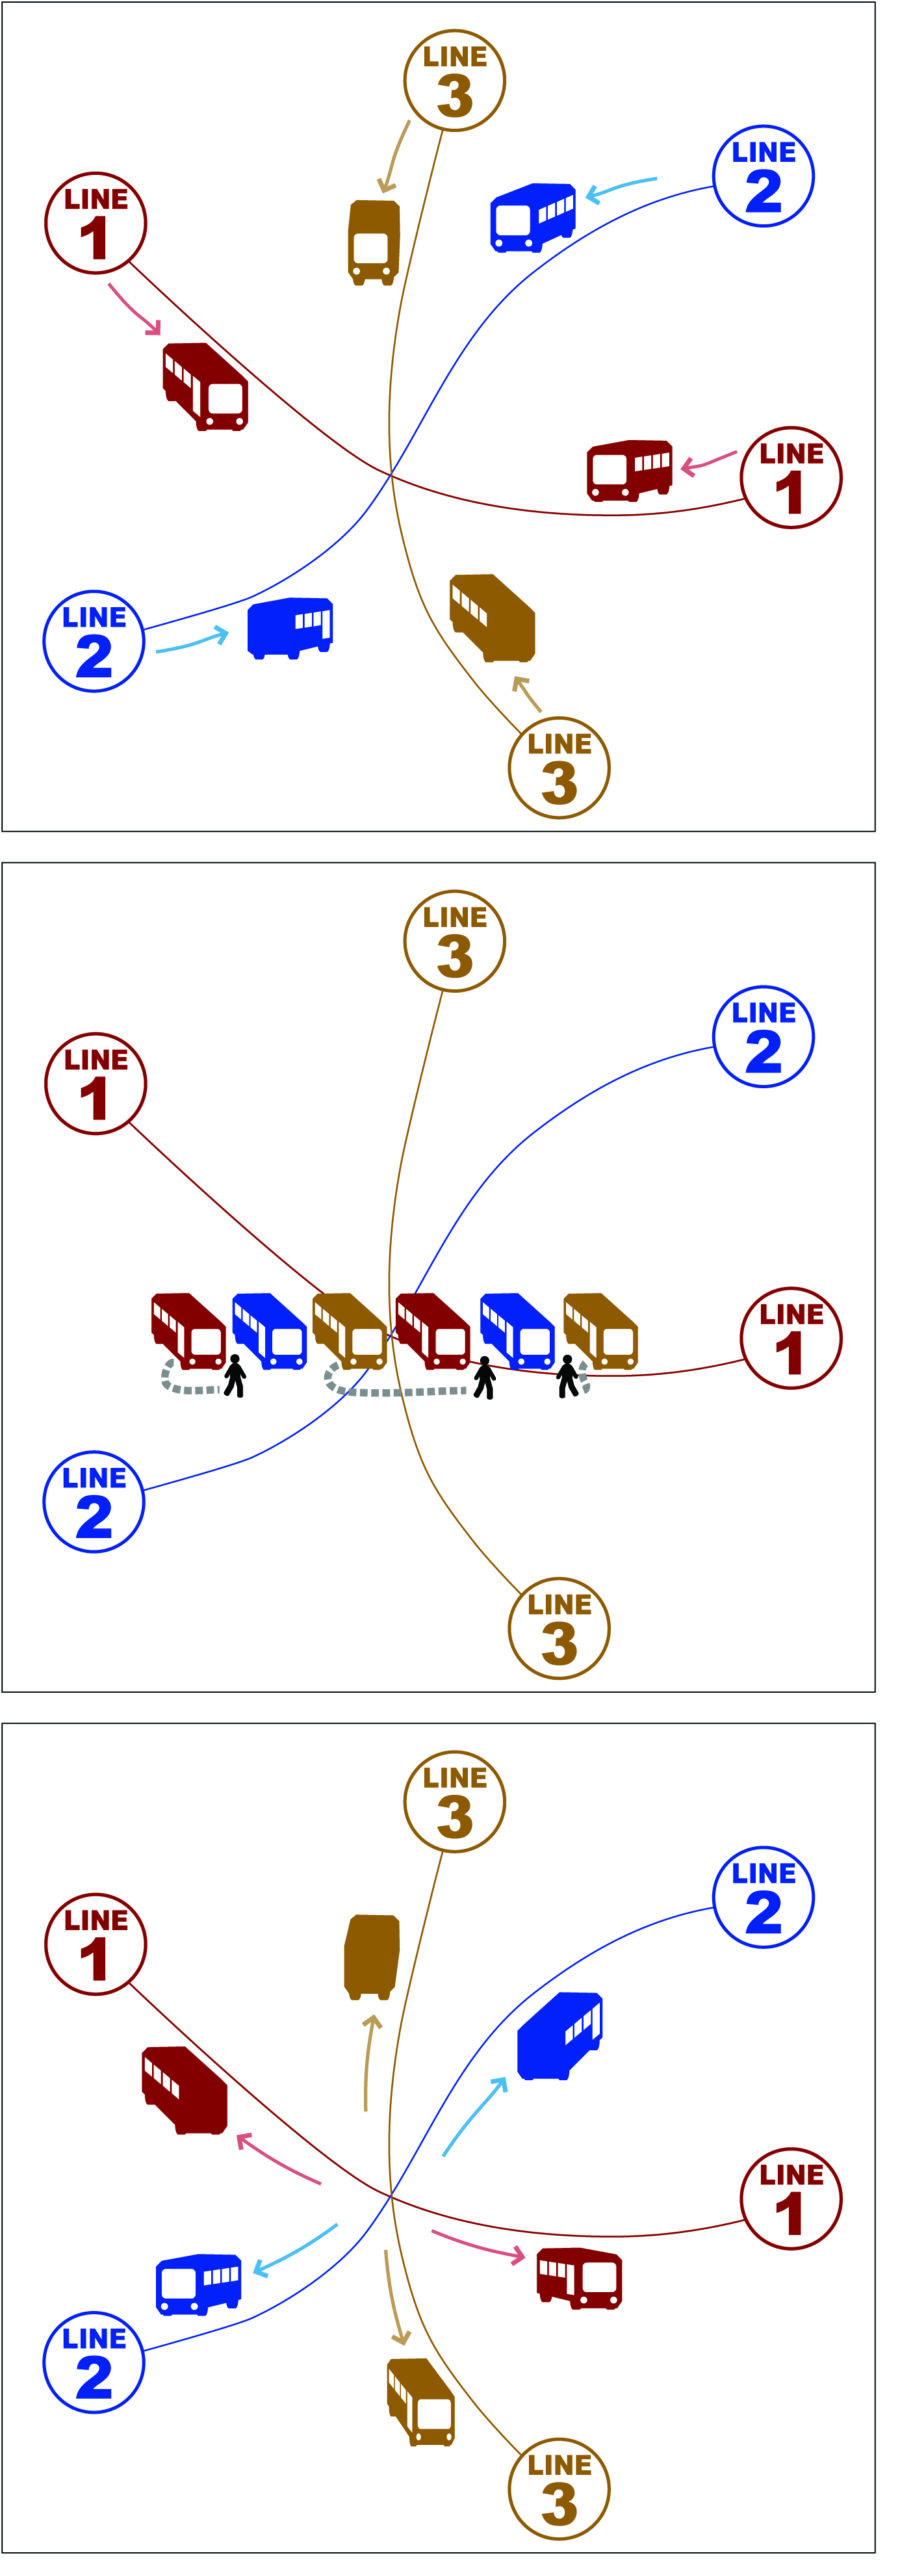
A pulse is a regularly scheduled event, usually happening at the same time each hour, in which transit vehicles from a range of routes — usually running every 30 or 60 minutes — are scheduled to all meet together. A group of hourly local routes, for example, might all come to the pulse point between :22 and :25 after the hour and leave at :30. That way, nobody has to wait more than 8 minutes for a connection even though the services in question are hourly.

Often, pulses are organized around a main transit line, such as a trunk bus or rail line that takes you to a nearby larger city. In these cases, the main line vehicle usually doesn’t dwell as the local buses do, since it’s the most crowded service and hence the most speed-sensitive. Instead, the locals arrive a few minutes before the trunk passes through, and leave a couple of minutes after.
Pulses are the only way to provide connection wait times that are much, much better than the frequency of the services involved. A pure pulse is also equally convenient for connections between any pair of lines, and thus for travel in any direction.
For this reason they are used almost universally, in North America, in small-city networks where frequencies are low and often also in suburban areas of large cities. If you’re in a North American suburb or small city and see a large number of buses hanging out together on a street corner, you’re probably watching a pulse.
I was introduced to pulse scheduling in Portland at a tender age. I was a teenage transit geek then an undergraduate working part time at TriMet, the transit agency. This happened to be the period (1979-85) when the lattice of suburban pulse networks was being constructed.
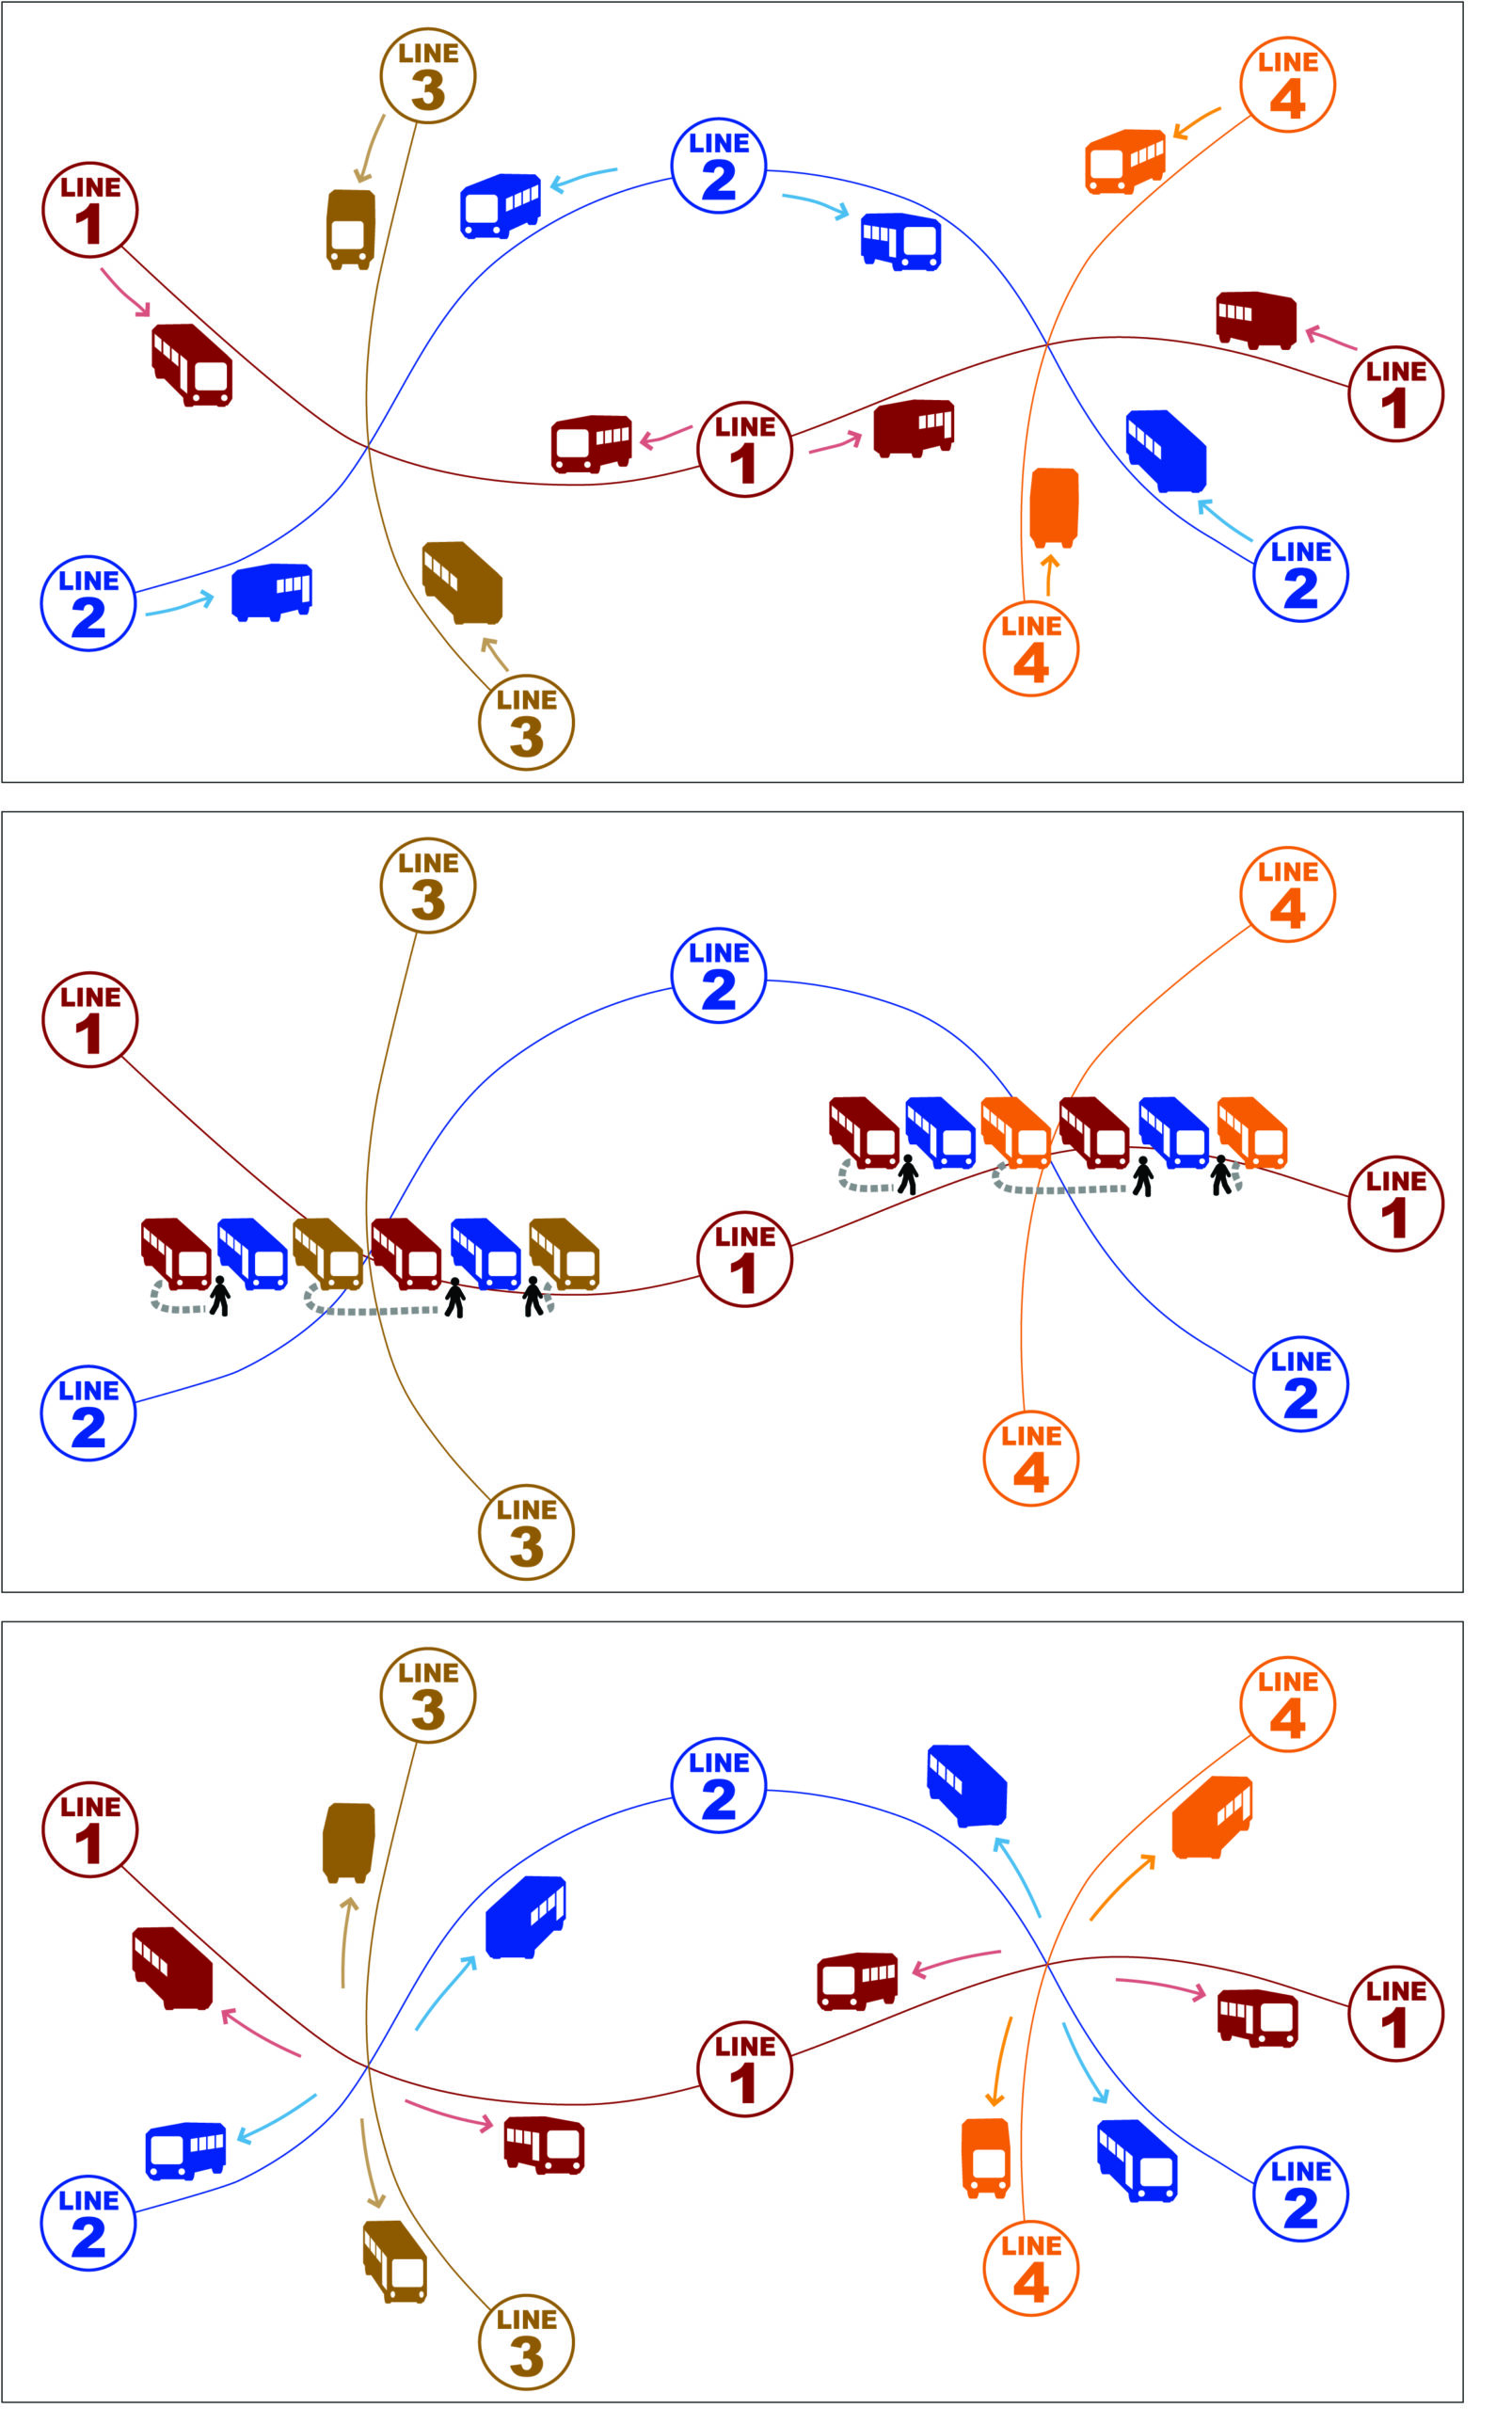
We spent a lot of time thinking about how the pulses interact with each other. For example, if you have a pulse of buses at Beaverton Transit Center at :05 and :35 past the hour, and one route goes from Beaverton to Sunset Transit Center in 12-14 minutes, how do you schedule the Sunset Transit Center pulse? Do you set it at :20 and :40, so that this connecting route can serve both pulses but with just a few minutes to spare? When this route is late, a lot of connections will be missed and a lot of people stranded. Or do we just set the Sunset pulse at :05 and :35, so that the bus linking the two transit centers has lots of spare time but now has too much time to kill and will tend to arrive inconveniently early for one pulse or the other. Or do we just accept that this line isn’t going to hit one or the other of the pulses precisely?
In lattices of multiple pulses, the travel times between the pulse points become critical. In this example, if Lines 1 and 2 have different travel times between the two pulse points, the timing may not work well for both of them. Good network design thinks about this problem as routes are being designed.
To do pulse scheduling, we have to plan the pulse schedule as we’re designing the network. In the two-pulse problem I outlined above, we will think hard about the line connecting the two pulses and ask if we can either make it a little shorter (so that it will get there more reliably in 15 minutes) or a little longer (so that it will get there in 30 minutes without so much time to spare). I have designed some large networks with multiple pulse points, all designed to work harmoniously. To do that, I’ve always designed lines between pulse points with the specific goal of making them a certain length.
Pulse scheduling requires an intimate two-way conversation between the planning and scheduling tasks, but not all public transit authorities are not set up to have this conversation. Sometimes, planning and scheduling are too far apart organizationally and become structurally incapable of noticing and exploiting pulse opportunities. In other cases, pulses may simply not be the prevailing habit; there may be nobody around who is in the position to suggest them.
The organizational challenge presented by pulsing is, to me, a positive feature of the concept. Better integration of planning, scheduling, and operations management has many benefits, and if the pulse challenge helps motivate an agency to get there, so much the better.
But pulse scheduling does have some practical limitations. In particular, it struggles in any environment where the running times are prone to vary a great deal.
Pulses are about managing a low-frequency network, so they aren’t generally needed in inner cities where frequencies are every 15 minutes or better. Pulses are almost universal in small-city design in North America, because most such cities have little traffic congestion and can therefore run a pulse reliably. The best big-city agencies also do some kind of pulse late at night, when their services are very infrequent.
But in the suburban areas of big cities, running times vary due to traffic congestion and pulse operations struggle. I suspect that the difficulty of guaranteeing pulses in these settings is the main reason that big suburban agencies are reluctant to advertise their pulsing too much. Small-city agencies, which don’t deal with such severe congestion, are more likely to emphasise that at the heart of their network, they have a pulse.
A lattice of interconnected pulse points, all beating as planned in unison or alternation in a pattern that repeats each hour, is a thing of beauty if you can visualize it, especially because if the motion of pulsing suggests the movement of blood through the heart. It’s like watching the inner life of a large multi-hearted organism. This can be a nice metaphor for other kinds of thinking about your city.
1 Ross R. Maxwell, “Converting a Large Region to a Pulsed-Hub Public Transport Network.” Transportation Research Record, paper 03-4020, p 128. Original paper here.