Brisbane

Does the History of a Technology Matter?

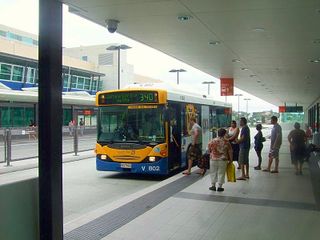
6a00d83454714d69e2012875c1a395970c-320wi

Mater Hill busway station, Brisbane

Ben Ross has a nice long read in Dissent about the history of Bus Rapid Transit, noting all the ways it’s succeeded, failed, and been co-opted by various non-transit agendas.  He’s especially interested in the way various petroleum-and-asphalt interest groups have supported BRT as an alternative to rail for reasons that probably don’t have much to do with their love of great public transit.  All this is worth reading and knowing about.

But what, exactly, should we do with this history?  Practically everything that breaks through into the public discourse has private public relations money behind it, and that money always has different goals than you and your city do.  That’s why you should always lean into the wind when reading tech media.  But just as it’s wrong to fall for everything you read in corporate press releases, it’s also wrong to reflexively fall against them.  (Cynicism, remember, is consent.)

Galileo paid the bills, in part, by helping the military aim cannonballs correctly.  Does that mean pacifists should resist his insight that Jupiter has moons?

So while I loved Ross’s tour of the history, I reject his dismissive conclusion:

Buses will always be an essential part of public transit. Upgrading them serves urbanism, the environment, and social equity. But a better bus is not a train, and bus rapid transit promoters lead astray when they pretend otherwise. At its worst, BRT can be a Trojan horse for highway building. Even at its best, it is a technocratic solution to a fundamentally political problem.

The term technocratic is really loaded here.  Given the new “revolt against experts” trend in our politics, we urgently need to recognize  hard-earned expertise and to distinguish it from elite selfishness, but technocrat is a slur designed to confuse the two.

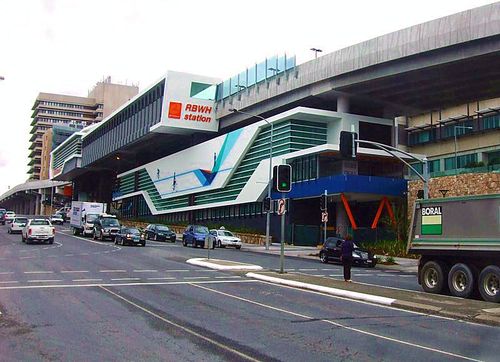
6a00d83454714d69e2012875c19fc4970c-500pi

RBWH busway station, Brisbane

There are some great bus rapid transit systems out there, and not just in the developing world.  The mixed motives that underlie BRT advocacy don’t tell us anything about where BRT makes sense, any more than the mixed motives behind rail advocacy do.

A light reading of history can help you recognize the prejudices that may lay behind advocacy on all sides.  But then you have to set that aside, and think for yourself.


brisbane: a city transformed by a bus link

Next time someone tells you that transit has to be rail in order to affect real estate demand, send them this paper [paywalled] by Elin Charles-Edwards, Martin Bell and Jonathan Corcoran –  a dramatic example of bus infrastructure profoundly transforming residential demand.

Our scene is the main campus of University of Queensland, which is located on a peninsula formed by a loop of the Brisbane River.  It's in the southwest corner of this image.  The area labeled "Brisbane" is the highrise downtown.  Most everything in between — which is mostly on the south side of the river — is dense, redevelopable inner city fabric.  

Bris cbd

If you look closely you can see a single faint bridge connecting the University across the river.  This is the Eleanor Schonell Bridge, which opened in 2006, and which is solely for pedestrians, cyclists, and buses.  No private cars.  It's one of the developed world's most effective of examples of a transit path that is vastly straighter than the motorist's options.

Prior to the opening of the bridge, University of Queensland had a problem much like that of Vancouver's University of British Columbia.  Its peninsula setting helped it feel remote and serene (the rarefied air of academe and all that) but it was also brutally hard to get to, especially from places where students and lower-paid staff could afford to live.  While there are some affordable areas west of the campus, most of the immediate campus area is far too affluent and low-density to house the university's students or the bulk of its workforce.  So commutes to the campus were long and difficult.  

Apart from the geography of income, the issue here was classic chokepoint geography, and that was the key to the transit opportunity.  Brisbane's looping river, and its extreme shortage of bridges outside of downtown, slices the city into a series of hard-to-access peninsulas.  Motorists are used to driving way out of direction to reach their destinations, and until recently, buses had to do the same thing.  The only transit that could do what cars couldn't was the river ferry system, CityCat, and while this system is immensely successful, it is still a small share of the travel market because (a) so much of the population is not on the river and (b) the river is a  circuitous travel path as well.  

Charles-Edwards et al show how the bridge created an explosive expansion of access (where can I get to, soon?) for the campus by walking, cycling, and bus service.  Walking:

Uq walkshed
 

And by bus (focus on the triangle in the centre of the image, which is the campus):

Uq busshed

It's worth noticing why this bus bridge is so effective:  It plugs right into the Brisbane Busway network, which looks like this.  ("UQ Lakes" is the campus stop.) 

121101-busway

Direct buses from campus run along most of these paths, and connect to many other frequent services covering the area south of the river, including a couple of useful frequent rail lines extending southeast from downtown.   This is the biggest and highest-quality busway system in the developed world, in terms of the degree of protection from private car traffic along complete travel paths, including a tunnel under downtown.  So the access opened up by this bridge was extraordinary.  The busway is so fast and reliable that even commutes from northern Brisbane — on the same side of the river as the campus — were speeded up by the new bridge because they could remain in busway for the entire journey.

The effect on the location of students and staff, from 2003 until 2012 (six years after the bridge opened) looks like this.

Uq relocations

The colour choices are unfortunate, so pay attention to the legend and focus on "St Lucia" (the campus) and the inner city areas just across the river from it. Remember, too, that this is a map of percentage change, so don't be distracted by big colors far away from the action, which represent noise (percentage changes on a tiny base). You can see that students and staff have shifted in big numbers to the inner city across the river from the campus, but also to southern and eastern suburbs each of the river, which are more affordable and still easily reached by buses from the campus.  In the author's careful words, the bridge caused "a significant redistribution of staff and students across the metropolitan area."  It also had the likely effect of reducing overall commute times by enabling people to live much closer to the campus, though the authors don't mention that.  

Because the project gave buses so much of an advantage in accessing the campus, the mode share shifted dramatically, enabling the campus itself to grow without choking on cars:

 Between 2002 and 2011, the population accessing the campus increased by 23 per cent, … all of which were absorbed by [non-car modes on] the bridge. There was an accompanying shift in the modal mix of trips away from cars to public transport. This was most marked among students, for whom less than one-quarter of trips were by car in 2011, down from two-fifths in 2002. Bus patronage increased among students from around a quarter of trips to more than half. Staff car usage declined from 70 per cent in 2002 to just over half in 2011, with buses, cycling and walking all increasing in popularity.

Eleanor Schonell Bridge is a powerful example of infrastructure that transforms a city's living patterns by transforming the isochrones of access.  We can all think of trains and ferries that do this, but it's rare that buses are allowed to succeed in the same way.   Once again, Brisbane has shown that it's not the transit technology that matters to people's location choices.  It's where you can get to easily.

how do you compare to your peers? should you care?

Admit it:  You've always cared, at least in secret, about how you compare to your peers: your friends, your fellow students, your graduating class, your co-workers, your generation.  Well, deep down, transit authorities and city governments care too, which is why comparing a city to other similar cities always gets attention.

Sometimes peer comparisons cause complacency, especially if you choose the wrong peers.  Wellington has the highest transit mode share in New Zealand, but in a country with only one other big, dense city, that obviously shouldn't imply that it's reached nirvana.  Working in greater Vancouver I always have to emphasize that they are doing so well by North American standards that they have to start comparing themselves to European port cities in their size class (Glasgow, Edinburgh, Copenhagen, Helsinki, Marseilles).  My general advice: If your peer comparison says you're wonderful, throw a party and revel in this for 48 hours, then look for a more motivating group of peers. 

At the other extreme, nothing is more motivating than being told that you're dead last among your peers.  Earlier this year I worked (through my Australian employer MRCagney under the leadership of Ian Wallis Associates) on a peer comparison study for Auckland, New Zealand, which compared Auckland's transit performance with all the five biggest Australian cities plus a selection of North American ones.  Download the full report here.  Remember, if you're in any of the peer cities that it uses (Wellington, Brisbane, Perth, Adelaide, Sydney, Melbourne, Edmonton, Ottawa, Calgary, Vancouver, Honolulu, Portland, Seattle) this is your peer study too!  Just keep the tables and refocus the text (citing the source of course!).

More generally, the report is a good illustration of how peer comparison can work at its best, and also of the cautions that must be shouted from the sidelines once the conclusions take fire in the media, as they certainly have in Auckland.  From yesterday's New Zealand Herald:

Consultants have ranked Auckland last out of 14 cities – in New Zealand, Australia, Canada and the United States – included in a benchmark study for the average number of public transport trips taken annually by its residents.

Aucklanders also pay the highest fares of any of the cities, amounting to 24c for every kilometre travelled on the average 44 public transport trips they take each year, compared with 17c in Wellington.

The rest of the article is further grim statistics, plus quotations from political leaders demanding that something be done. 

I'm  sympathetic to Auckland Transport in this case.  Remember, a city's transit performance is mostly about the physical layout of the city and the constraints on other modes; the quality of the transit system by itself can't overcome problems in those areas.  The nature of the economy also matters.  Wellington is much smaller but it has much more severe chokepoints in its urban structure.  In fact, all travel between the northern and southern parts of the city must go through a single chokepoint less than 1 km wide, which is also the (very dense) downtown.  Wellington's economy is dominated by government, which is generally a sector disposed to use transit heavily. All of these features are hugely important in driving Wellington's mode share above Auckland's, and yet they don't include anything about the respective quality of the transit systems. 

Peer comparisons also carry the false assumption that everyone wants to be the same kind of city, and is therefore working to the same kind of goals.  (This attitude, taken to extreme, produces the absurdity of top ten "best cities for transit" lists.)  Low mode share for transit may mean your transit system is failing, but it may mean that it's not trying for mode share, or at least that it has other objectives or constraints that prevent it from focusing on that goal.  It may just mean that your city has different values.  It may mean the city stikes a different balance between cycling, transit, and walking based on its own geography.

Still, service quality matters, and there's a lot that Auckland can do.  I hope the city's opinion leaders are listening to Auckland Transport as well as berating it, so that they understand the real choices that must be made to move Auckland forward.  If there's a real conversation, great things can be accomplished. 

bus rapid transit: two kinds of flexibility


On yesterday's post on the watering-down of Bus Rapid Transit proposals in Bristol, UK, a number of comments seem a little vague about how buses are more "flexible" than rail.  For example, Carl writes:

The two primary justifications for BRT [are]:

1. Like rail but cheaper. …
2. More flexible. More flexible means it doesn't need exclusive right of way everywhere (usually the chokepoints), that other traffic can use the lanes, etc.

This a very common way of framing the question, and a very misleading one.

First of all, the notion of "flexibility" used in #2 has nothing to do with the bus/rail distinction, at least if we're talking about surface light rail or streetcars.  You can put streetcars or light rail in mixed traffic and get all the same speed and reliability problems that a bus would deliver in the same situation.  So again, in urban transit:  Speed and reliability are not about vehicle technology; they are about what can get in your way.

But Bus Rapid Transit offers a very different flexibility that in certain situations out-competes rail.  A busway can be designed so that buses from many surface lines can flow into it.  This potentially spreads the usefulness of the busway over a large area without requiring an additional trunk-to-feeder connection.  Connections are unavoidable in good networks, but if there are easy opportunities to eliminate one, it's still worth going for.

This ability to flow through to local lines yields what we call an open busway.  North American open busways include the Ottawa busway network, the Pittsburgh busway, and the Los Angeles El Monte Transitway, but they are much more common overseas, including the developed world's most extensive example in Brisbane, Australia.  This kind of flexibility is impossible to do with rail.

Closed busways, which has none of these benefits but can have more "specailized" vehicles, include the Los Angeles Orange Line.

The flexibility of open busways makes sense only where it matches the pattern of the market. Brisbane is a highly radial city, with a single downtown and densities dropping away as you move away from it.  Outlying nodes of high activity, which could be a strong endpoint for a closed busway or rail line, are scarce.  So the open busway makes perfect sense.  It allows busway service to spread out over a larger area, yielding high frequencies on the inner busway where the demand is higher, and correspondingly lower frequency further out.  It's the kind of flexibility that fits the city.

basics: dead running

P1010471 The British/Australian term “dead running” means “running out of service, unavailable for passengers.”  I like the term because it could be the title of a zombie movie.  I look forward to seeing if it attracts hits. Continue Reading →

brisbane: the last on the flood

Yes, it appears that many of Brisbane's ferry terminals are gone …

420newfarm-420x0

… but the boats themselves were saved.  Buses are replacing ferries, we're told, though buses can't do much without bridges.

Floods this major don't often happen in developed-world cities.  If you're interested in the recriminations phase, Kerwin Datu has a good overview in the Global Urbanist.

Photo: Robert Shakespeare, Brisbane Times


brisbane: remarkable aerial photos of flood

Nearmap.com has posted a complete layer of aerial images of Brisbane, take on the 13th when the flood was near its peak.  Here's Milton, featuring the flooded Suncorp Stadium near the top of the image. 

Milton flood nearmap

Panning just to the southeast, here's a bit of South Brisbane. 

West end flood nearmap

There's quite a bit of transit news in this image.  The bridge in the upper right is the Victoria Bridge, which normally carries buses in exclusive lanes between the CBD (off to the upper right) and the entrance to the South East Busway, which is just west of the railroad tracks.  Just at the west end of the bridge you can make out a pair of of platforms, which are Cultural Centre station.  The street is flooded just west of that station, so it's clear that at the height of the flood the bridge, the station, and this part of the busway were all out of service. 

The building immedately north of the bridge is the Queensland Art Gallery, the main art museum, which fortunately had time to move its collection to upper floors.  South of the bridge you can see the floodwaters invading the Southbank entertainment precinct. 

This next image is further east.  It has the CBD on the west edge, then Kangaroo Point with the Story Bridge, then New Farm in the image's eastern half:

 new farm flood

Near the center of the image you can see what looks like a piece of white string in the water, just off the northern shore.  That's the remains of the Riverwalk's floating segment.  Pieces north and south are now missing. 

Nearmap.com's excellent images can be explored just as you'd explore Google Maps, and their images of Australia are consistently sharper than Google's.  If you're in Brisbane, and don't want to be reviled as a "rubbernecker" visiting the flooded areas and getting in the way, explore the flood on Nearmap instead.  If you're not in Brisbane, well, be glad of the fact.

redundancy in transit networks: a good thing?

Transit planning consultant Bob Bourne is thinking about the Brisbane flood's impact, and wondering whether building more redundancy into transit networks is a good idea:

My heart goes out to everyone affected by the floods.  It can be devastating on so many levels, individual lives lost; extensive property damage to individual residences, and infrastructure damage.  I managed the system in Ames, IA during our floods in 1990, 1993, 1998, and 2005 and I have been assisting the Cedar Rapids, IA transit system in recovering from their 2008 floods.  I worked in Chicago during the blizzard winters of 1977-78 and 1978-79 where the city and suburbs experienced several weeks of paralysis due to the continuous heavy snows as well as way too many blizzards in Iowa over the years.
 
In the U.S. buses typically operate without a lot of redunancy in the route network.  Your commentary on numbering overlapping bus routes and make them understandable to the riding public is interesting and implies that there are lots of routes serving several corridors.  In the U.S. that may be true, but usually the headways are pretty well trimmed to provide the absolute minimal level of service.  When you add demand due to adjacent services becoming inoperative, the existing routes are overwhelmed.  Overloading causes extended travel times and buses cannot make their normal cycle times which exacerbates the problem.  Throw in a street network in chaos and the bus system will be criticized as not meeting the needs of the citizens in the time of crisis.  No easy way to explain the problem.
 
The other problem that we had in Ames, Chicago, and Cedar Rapids was that some of the drivers lived in areas that were flooded or had immediate family in those areas.  They needed to tend to their family/housing priorities and this decreased the number of people available when the workload  of more passengers and longer travel times increases.
 
At some time in the future, after everything settles, perhaps you could solicit comments on building redundancy into your transit system.  Sometimes, it is good to have lightly used routes that can be cancelled in a crisis allowing redeployment of drivers and vehicles.  Sometimes it is good to have headways with a loading standard of less than 125% of seats at the peak point on the route instead of cramming buses with 150% or 175% of seated load.   Your 10 or 12 minute frequent headway concept can provide additional resources if you need to cut it back to 15 to 20 minutes during a crisis.
 
After the September 11, 2001 disaster in New York, the subway system was able to recover quickly because the lower end of Manhattan was one of the few places in the subway system where there was some redundancy.   Multiple routes close to each other and at the end of some routes made it easy for commuters to resume their normal lives long before the reconstruction of the subway damage.
 
Redundancy is not favored by policy makers and can add to costs.  However, a system with excess capacity will perform well in times of crisis and will provide addtional service during normal times.
 
Our prayers are with everyone who is suffering through this disaster and we hope that good luck will shine on Australia again.

The kind of redundancy that Bob praises is something transit planners spend much of their time trying to get rid of, because on typical days when we don't need it as redundancy, we call it duplication and waste.

Transit agencies work on such tight budgets that it doesn't make sense to run, say, a bus line next to a rail line, doing the same thing, just for the redundancy.  If the rail line is serving the market, the bus should be off somewhere else, providing unique mobility rather than duplicating the rail.

This is especially true in small cities like Bob's hometown of Ames, Iowa, or Great Falls, Montana.  These networks' resources are stretched tightly to create the maximum amount of mobility for the budget.

Having said that, there are a few situations where an efficient network is also a redundant one.

Classic high-frequency grids provide redundancy for transit in the same way they do for cars.  If one segment in a grid goes down, there's a parallel line 800m away that you can walk to in a pinch.  It will probably allow you to complete the same L-shaped trip that you intended to make on the disabled line.  

Grid with trip

Ferries are more complicated.  The long cross-city run of the CityCats mostly connects stations that are also connected by bus.  The bus trip generally runs a shorter distance at a higher frequency, though it may require a connection.  So there's no question that the intrinisic attraction of the ferry is part of what keeps it busy.  There may also be secondary issues, like the legibility problems of much of the bus system in downtown Brisbane, where most connections occur.  But there are also situations where CityCat and the smaller CityFerry does a link that's simply impossible by road, or much, much longer, and in these cases the ferry wins on pure mobility grounds. 

Of course, bus operators generally have backup fleets in case they need to suddenly replace a non-redundant train or ferry line that goes down.  In Australia, there are often standing agreements between government and private operators to shift buses into this role, and given a day's warning — which Brisbane had — it's not hard to replace a failed network segment with buses even while running the rest of the bus network.

So is redundacy a good thing in disasters?  Of course it is.  Is it a reason to design networks that are redundant all the time, at the expense of more mobility that could be provided at the same cost?  No, probably not, because you're weighing a rare disaster against daily inefficiency.  Are there styles of network design that are both efficient and redundant?  Yes, the high-frequency grid comes to mind. 

In really big and dense cities, you can also get both redundancy and efficiency, because there will tend to be overlaps of service just to provide capacity into dense centers like Lower Manhattan, and in these cases, as Bob notes, redundancy is often possible.  The key there, however, is that the duplication of services isn't justified by the need for redundancy, but rather for the sheer capacity need, and providing necessary capacity, of course, is part of efficiency.
 

brisbane: free fares for a week, ferries out of action

As Brisbane's great flood of 2011 recedes, the Brisbane Times has this roundup of the flood's impact on public transit:

Premier Anna Bligh said travel on buses and trains would remain free for seven days, starting today.

CityCat and CityFerry services are out of action after the surging Brisbane River inflicted major damage to pontoons and terminals, but authorities have been trying to continue rail and bus services wherever possible.

If the river ferries are out for a while, it will be interesting to see how well buses take over their functions.  As you can see on the ferry map below, or on Google Maps, Brisbane is defined by a squiggly river with a spectacular shortage of bridges.  There are many bridges around the CBD but only three other bridges in the west and one in the east.  The big CityCat ferries that ran the length of the river mostly served markets also served by buses running along the shore, but the smaller cross-river ferries made some connections that will be vastly longer by road (Bulimba to Teneriffe, for example, in the city's east). 

100104_ferry-network

Perhaps this will give some impetus to the idea of "green bridges" — bridges across the river exclusively for transit, bikes,  pedestrians, and emergency vehicles.  Brisbane already has one, in addition to two bike-ped bridges.  Portland, a city much like Brisbane in many ways, is building it first.

From far-away Vancouver, Gordon Price shares his photos of some of what's been lost. 

brisbane: the flood at its peak

439222-citycat-terminal The great flood of 2011 has damaged many of Brisbane's riverside neighborhoods and destroyed the wharves of the CityCat river-ferry system.  You can find plenty of images of the damage on the the websites of the Brisbane Times (Fairfax Media) and the Australian (Murdoch). 

Here is footage (starting at 0:20) of the destruction of the floating section of the Riverwalk, which connected downtown to the dense New Farm district and carried thousands of pedestrians and cyclists per day.  The huge piece of bridge was later intercepted by a heroic tugboat driver, who prevented it from crashing into the pylons of the Gateway Bridge.  Many also have images of the Drift Cafe, a floating restaurant just a few meters from our office, breaking away and crashing into a bridge.  And this jumped out from the Australian's coverage:

All buses to the city centre were cut off, trains continued to run but only sporadically, …  Military demolition experts were dispatched to the Moggill ferry – still hanging on by one of the two ropes it uses to help ferry vehicles across the river – to determine whether the safest option was simply to sink it.

Commenter InBrisbane writes:

Yes, thanks everyone all over the world for their support.

Our beautiful CityCat [river ferry] network is ruined. It will have to be rebuilt. Some of the city's favourite places like South Bank are covered with water, and you need a boat to go down Coronation Drive.

The transit authorities have done a stellar job moving trains out of the yard and parking them nose-to-tail in giant "snakes" to get them out of … stabling which could be flooded. Skeleton bus and trains running. …

the river was full of logs, pontoons and luxury boats hurtling down like missiles. Not sure where any of the citycats are.

My understanding was that the CityCat ferries are safe, but that most of their wharves have been destroyed.  UPDATE: Commenter Daryl Rosin advises that the ferries were moved out onto Moreton Bay, and berthed at Manly, where the river flooding won't affect them. 

Image of Gardens Point CityCat wharf, Peter Wallis, Brisbane Courier-Mail.