San Francisco

Santa Cruz County: A Growing Transit Agency in a Beautiful Place

While you’ve heard plenty about big US agencies facing a “fiscal cliff,” some agencies are doing well and expanding their offerings as their staffing permits.  That includes Portland and Dallas, where we’ve been working, but here’s a similar story from a smaller agency in an outrageously beautiful place.

Santa Cruz County, just south of the San Francisco Bay Area, is known for its beautiful beaches, towering redwoods, college-town ambience, and expensive housing, but the county also contains Watsonville, on the edge of the agricultural Salinas Valley, which has cheaper housing and is over 80% Hispanic or Latino/a.  The University of California at Santa Cruz (UCSC) generates huge demand to its hilltop campus at the west end of the region, but Watsonville generates strong demand for travel both locally and to jobs in Santa Cruz.  Meanwhile, the City of Santa Cruz is trying to encourage denser housing along frequent transit corridors in order to address their problems of housing affordability.

Like many US agencies, Santa Cruz Metro had to make cuts during the pandemic to match the service to their shortage of bus drivers.  In the last year, though, the pace of hiring has picked up, and the agency can do its first substantial expansion.  They asked us to analyze the network and develop some concepts for improvement.  We drafted a couple of alternatives, and had a public conversation about them.  Finally, last Friday, the agency’s Board adopted a Phase 1 restructuring plan. By then, it turned out, hiring had gone even better than expected and some hard choices that we had feared would have to be made turned out not to be necessary.

Phase 1, now scheduled for implementation this December, will change the network completely.  It currently looks like this.  (As always, click maps to enlarge and sharpen.)

Starting in December it will look like this.

Look at the legend! As always, colors on these maps represent frequency, and that’s fundamental to understanding how this network is better than the old one.

The existing system has no service running better than every 30 minutes, but it also has no timed connections, so waits are long, not just for your initial bus but also for the bus you may be connecting to.  The redesign increases frequencies, improves the timing of connections, and streamlines and simplifies the network.

It’s an especially big change in Watsonville, whose confusing tangle of overlapping hourly routes was especially useless for most trips.  There, service is restructured to put a majority of the population and jobs near half-hourly service, mostly on lines that run through to the other cities to the west.

In Santa Cruz, the big change is the restoration of 15-minute frequency on the main lines that connect the University of California (“UC Santa Cruz” on the map) with the westside and downtown.  This is important not just for the university, but also to support the City’s goals for denser residential developments in the existing neighborhoods south of the campus.

The spine of the network linking Watsonville and Santa Cruz is a braid of four hourly routes currently called 69A, 69W, and 71.  In the new network the same resources go into simpler routes 1 and 2, and they’re more precisely scheduled to provide a 15-minute frequency on their westernmost segment where they run together.  Halfway between Santa Cruz and Watsonville, these two routes combine again to serve Cabrillo College, the only community college in the county.  We have shown the frequency there as every 20 rather than every 15 because if Routes 1 and 2 leave downtown Santa Cruz spaced evening every 15 minutes, they won’t be as evenly spaced at Cabrillo College, since Route 2 will have taken a longer path.  Still, this is a significant frequency improvement for the county’s biggest transit destination outside the University.

Santa Cruz Metro is rolling out this change very fast, aiming to have the new service on the street in December.  Meanwhile, this is just the first phase of a more ambitious expansion that will be discussed with the public soon in hopes of further frequency expansions in 2024.  That next phase would extend high-frequency local-stop service to Watsonville, while also adding an all-day Santa Cruz-Watsonville Express.  It will also look at new continuous service from the University to the east side of Santa Cruz.  We look forward to a robust public discussion of that next phase.

At our firm, we are ready to help any transit agency work with its financial situation, whatever it is.  But it’s especially exciting to see a transit agency that’s able to grow its services to match the values and ambitions of the communities it serves.

San Francisco: A Forbidden Fantasy Comes True

Around 1989, when I lived in San Francisco, I spent too much time in little rooms with transit advocates (and some transit professionals who could not be named) complaining about Muni Metro, the combined surface-subway light rail system.  It looked like this and still does, except that the T line was added more recently.  Note the r0ute letter names in the lower left.

The segment with 3-5 lines on it, from Embarcadero to West Portal, is the underground segment, which carries the heaviest loads through the densest part of the city.

It had always been wildly unreliable.  The five lines that ran through it (J, K, L, M, and N) always came in sequences of pure arithmetic randomness: N, J, M, K, J, N, N, K, K, M, N, J, L.  (Finally, my “L”!  But of course, after such a long gap, it’s crush-loaded and I can’t get on.)

Four decades after the subway opened, lots of things have been fixed: longer and better trains, better signaling, an extension downtown that helped trains turn back more efficiently.  But none of this touched the true problem:  The core Metro subway carries five lines, all of which deserve to be very frequent.  But they can’t all be frequent enough because they all have to squeeze into one two-track subway.  The other part of the problem is that they all have surface segments at the outer end, where they encounter more sources of delay, causing them to enter the subway at unpredictable times, and in an unpredictable order.

In those small rooms in the 1980s, we all knew that there was only one mathematically coherent solution.  Some us drew the map of this solution on napkins, but we really didn’t need to.  The map was burned into our minds from our relentless, powerless mental fondling of it.  Of course it was politically impossible, so impossible that if you valued your career you would wad up that napkin at once, burn it probably, and certainly not mention it outside your most trusted circle.

At most you might let out the pressure as a joke: “You know, we *could* turn the J, K, and L into feeders, and just run the M and N downtown. And then we’d have room for a line that just stayed in the subway, so it was never affected by surface delays.”  Everyone would titter at hearing this actually said, as though in some alternate universe such a change could be possible.

Now, the impossible is happening.  Without fear or shame, I can finally share the content of that forbidden napkin, because it looks like San Francisco is actually going to do it.


The two busiest western lines (M, N) will still go downtown, the others (J, K, L) will terminate when they reach a station but you have to transfer to continue downtown.  M trains will flow through as T.  Finally, a shuttle (S) will provide additional frequency in the subway, immune to surface delays.  As always, asking people to transfer makes possible a simpler, more frequent, and more reliable system.

You may detect, at San Francisco’s tiny scale, a case of the universal “edge vs core” problem.  Like many, many US rail transit systems, Muni Metro had been designed to take care of the edge, people who lived on one of the branch lines, rather than the core, people traveling along the subway in the dense inner city.  The new system finally fixes the core. But the edge folks benefit from a reliable subway too.  What’s more, in the future it may be possible to run the surface segments of J, K, and L more frequently, because their capacity will no longer be capped by the need to fit down the subway with four other lines.

All that in return for having to transfer to go downtown if you’re on the J, K, or L.

Let me not make this sound easy.  These transfer points, West Portal and Duboce Portal, are a little awkward, because they were never designed for this purpose.  You have to walk from one platform to another, crossing at least one street.  There are valid concerns from people with mobility limitations, which will have to be addressed with better street and intersection design.  Plenty of people won’t like it.

But the transit backbone of a major city will finally function.  And for those of us who’ve known San Francisco for decades, that’s a forbidden fantasy come true.


Fare Policy vs Ticketing Technology: San Francisco Edition

Many, many times, I’ve asked a transit agency’s leaders about their fare policy, and been told instead about their ticketing technology.  “Are you thinking about fare structure?” I ask.   “Yes, we’re on it!”  they say. “We’re working on this fabulous smartcard!”  Don’t trust a fare expert who can’t distinguish the policy decisions that set fares and the technologies that implement them.

Arielle Fleisher of SPUR has a good piece on fare policy in the Bay Area, which will be useful to anyone in multi-agency regions in North America.[1] Describing Clipper, the smartcard shared by almost all of the region’s 27 transit agencies, Fleisher writes:

There is no denying that the Clipper card is a magical piece of plastic. Since its debut in 2010, Clipper has made it much easier for people to switch between different transit systems and travel throughout the region. But if you look under Clipper’s hood, it quickly becomes apparent that the card’s magic masks a complex web of transit farclipperLogoLarge.pnges, passes and policies that ultimately limit its effectiveness. Put simply, a close look reveals that the Bay Area has a fare policy problem.

Back in the 80s and 90s, when I worked in the Bay Area, there was no “hood” to look under or “mask” to hide behind.  The mess was in everyone’s faces.  The many transit agencies required their own paper tickets or passes, and your only hope of moving freely across agency boundaries was to carry numerous rolls of quarters.

As the Bay Area considers the next generation of Clipper, Fleisher rightly warns of the risk that the region’s leaders will focus on making the technology cool rather than making the fares logical.  She enumerates five problems a multi-agency fare policy should solve:

  1. Disparate fares make using transit confusing.
  2. Separate fares for different agencies are a problem when one agency substitutes its service for another’s, as happens during disruptions.
  3. There isn’t a single pass that employers can purchase for their staffs.
  4. The system penalizes trips that happen to require multiple operating agencies.  (And note that some agencies still charge for connecting between services of the same agency!)
  5. The system makes it hard to do coherent discounting for low-income persons.

To which I can only say, yes!  And yes, we were yelling about all this 30 years ago.  The smartcard “solved” this problem only for relatively fortunate people.  If you don’t have to think about what you’re spending, you can just buy a Clipper card and wave it everywhere.  So there’s a risk of elite projection, in that many decision makers, who tend to have above average incomes, no longer experience the problem in their daily lives, the way everyone did back in the pre-Clipper days.

Still, the fare problem in a multi-agency region is genuinely hard.  If it weren’t, we’d have solved it long ago, because technology was never the real barrier.   Consolidating all the agencies into one isn’t the answer.  The point is to have clear boundaries and clear relationships across those boundaries.   But as long as there are multiple agencies, each agency has its own budget to balance.  Introducing new inter-agency fares costs money for each agency, as more fares have to be shared with other agencies that were part of each person’s trip.  Unless there is some new funding, the money has to come from raising the base fare, which is one of the most unpopular things a transit agency can do.  Integrated fares, when they happen, will be a cost item. They always are.

And as I can’t emphasize too strongly, every time you tell a transit agency to use its limited funds to do something other than run service, you’re telling them to cut service.

Even if you don’t live in the Bay Area, Fleisher’s article is a good read.  Chapter 11 of my book Human Transit also explores fare issues.  And if you’re interested in the dynamics of how a big North American metro deals with having 27 transit agencies, and why that might not be a bad thing, there’s my article on seamlessness, itself a response to an excellent SPUR paper on the subject.  (And again: if you want to see how influential, respected, and popular a local policy institute can be, you should learn about SPUR!)


[1]  The transit agency structure that I describe here is mostly a North American concept.  Elsewhere, the problems described here arise between operating companies (publicly or privately owned) that have the right to set fares and keep fare revenue while also getting subsidy from a government transport authority — a so-called “net cost” contract.”  The new best practice is “gross cost” contracts, where the government keeps the fare revenue.  This lets the government authority control the fare policy decision, because only its own revenue is at stake.  (It also lets the government design a coherent network.)

Basics: Public Transit “Integration” or “Seamlessness”

When you hear the word integration or seamlessness in conversations about transit, it usually means making it easy to make trips that involve multiple public transit agencies or operating companies.  (In the US we are generally talking about entangled government agencies, but in countries where private operators control patches of the network, the issue is the same.)

The San Francisco Bay Area has long been one of North America’s most difficult integration challenges, so it’s a good laboratory for exploring the issue.  If you can get transit integration right in the Bay Area, you can probably do it anywhere.  The Bay Area’s particular challenge is that it has no recognized central city.  Instead, it’s named after an obstacle, the Bay, and its geography of bays and hills provides natural psychological divides.  Wherever you live in the Bay Area, most of the Bay Area is “across the water” or “over the hills” from you, and this matters enormously to how people perceive issues as local or regional.  (Los Angeles, mostly a city of vast continuous basins, could not be more opposite.)

Screen Shot 2015-08-03 at 11.31.30 AM

The San Francisco Bay Area, with county lines


Fig1-WholeBayArea BS2_REV3_040915

Map of Bay Area transit agencies (SPUR, “Seamless Transit” 2015)

The key types of seam are:

  1. Fare barriers, where a trip involving two agencies requires paying both agencies’ fares, and sometimes also keeping track of two kinds of ticket or pass.
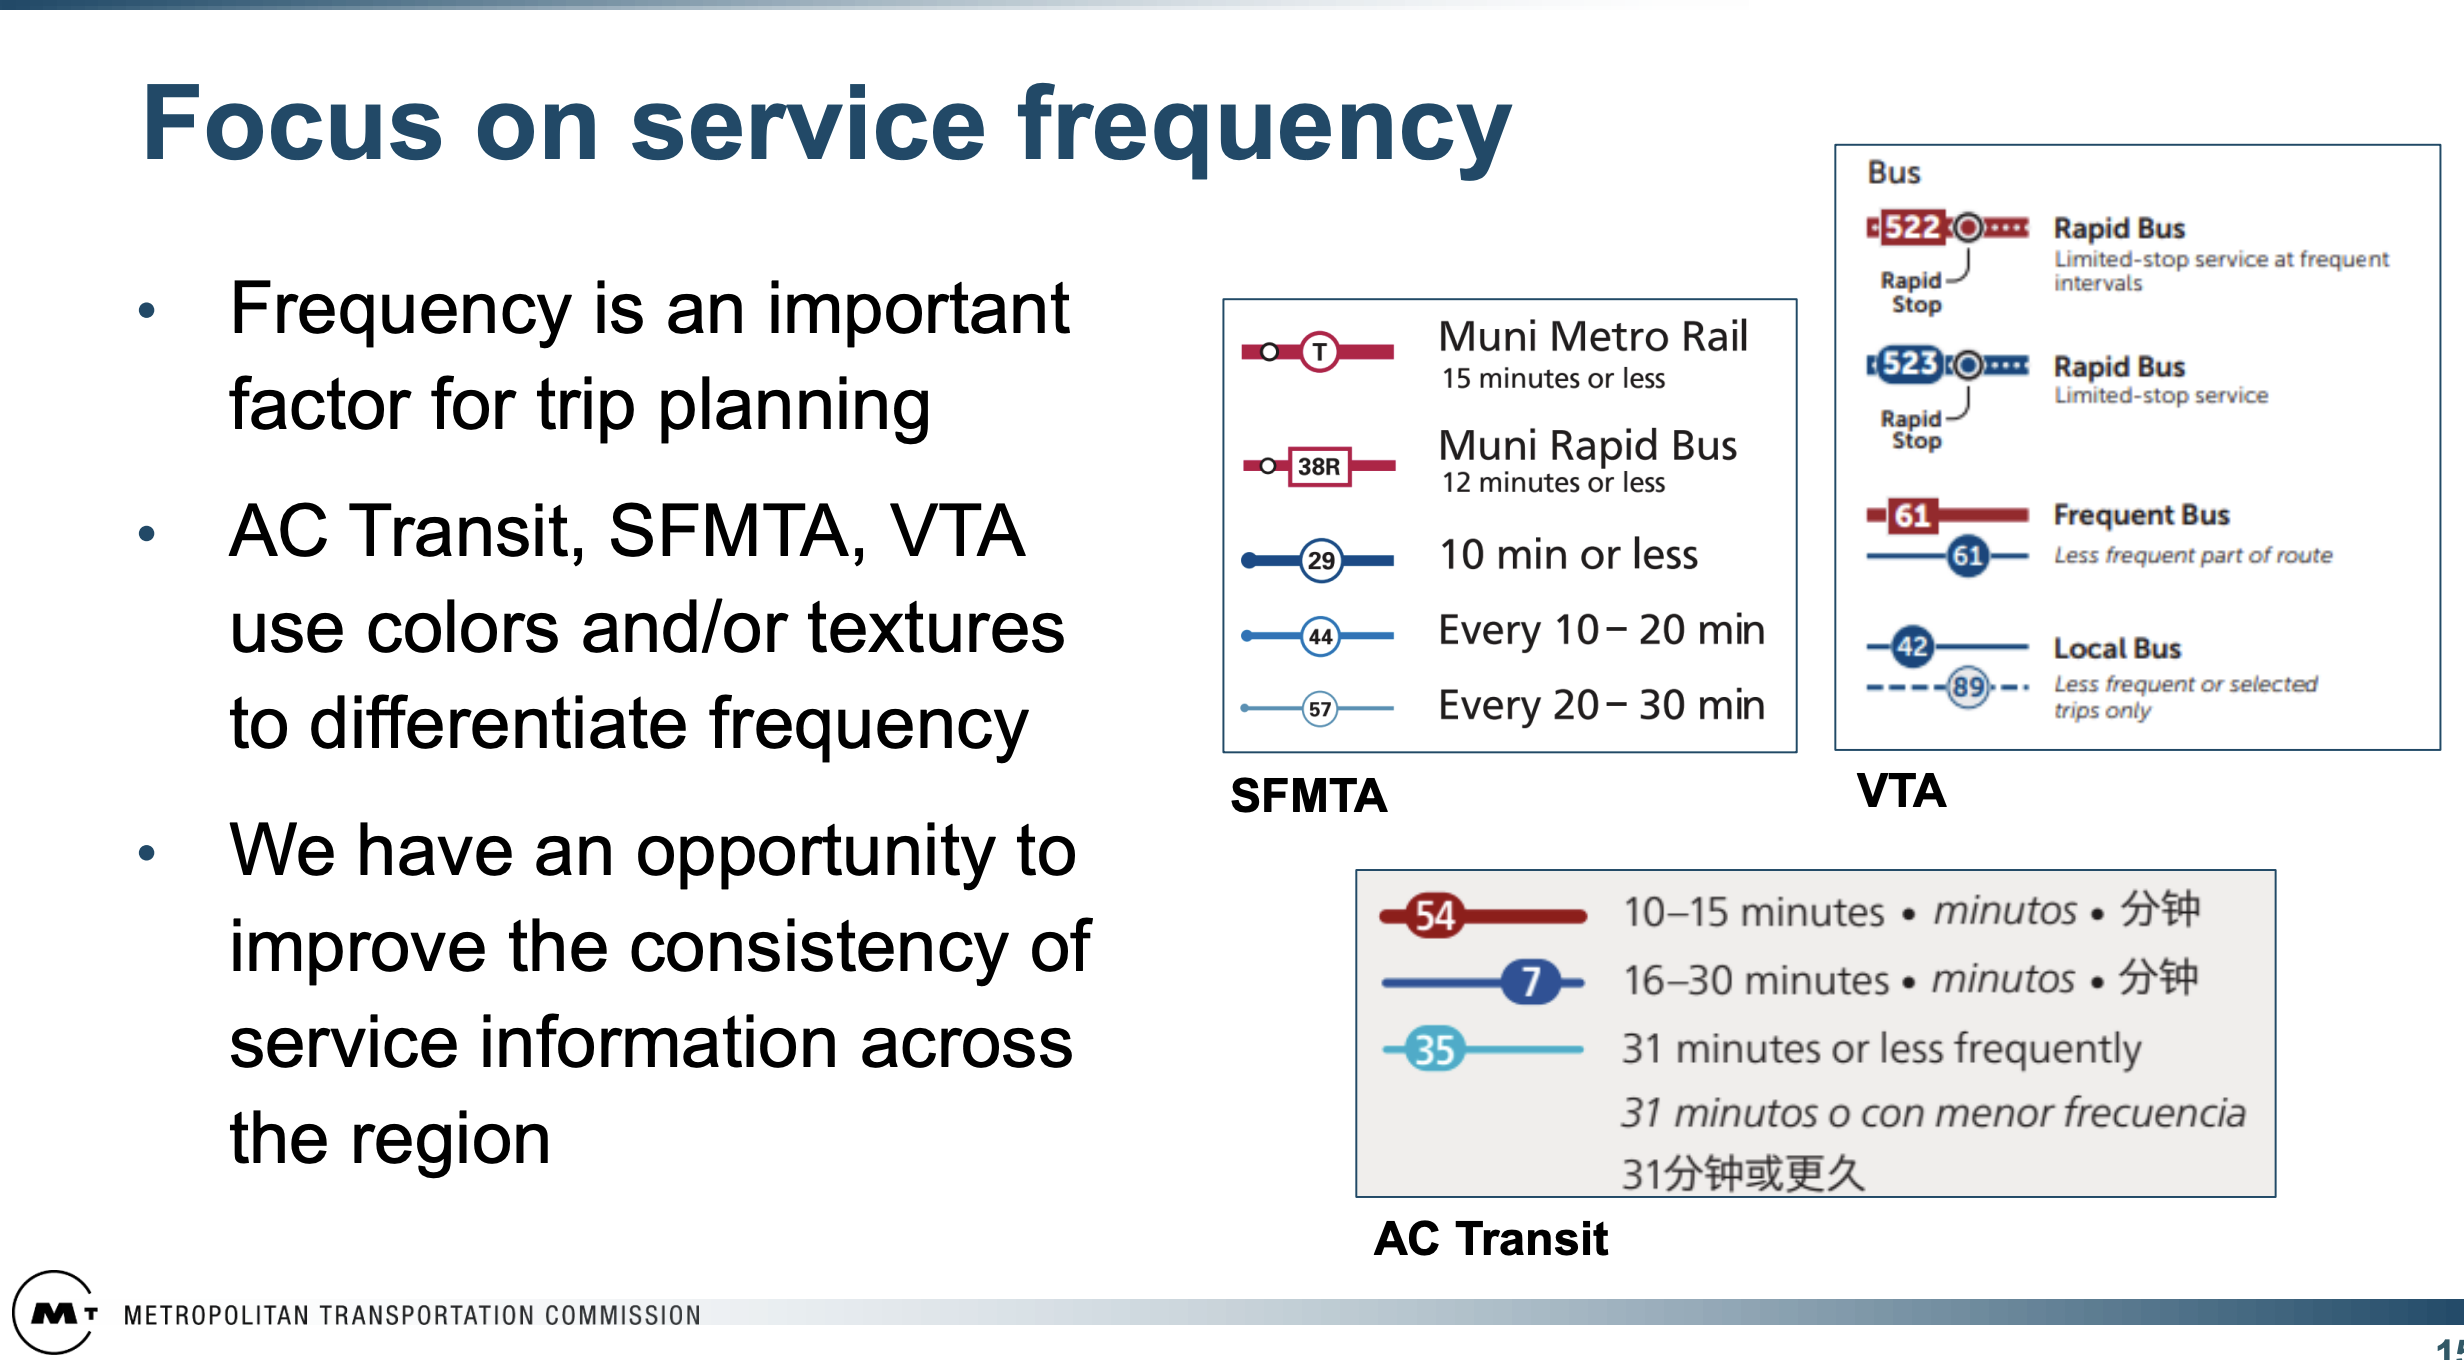
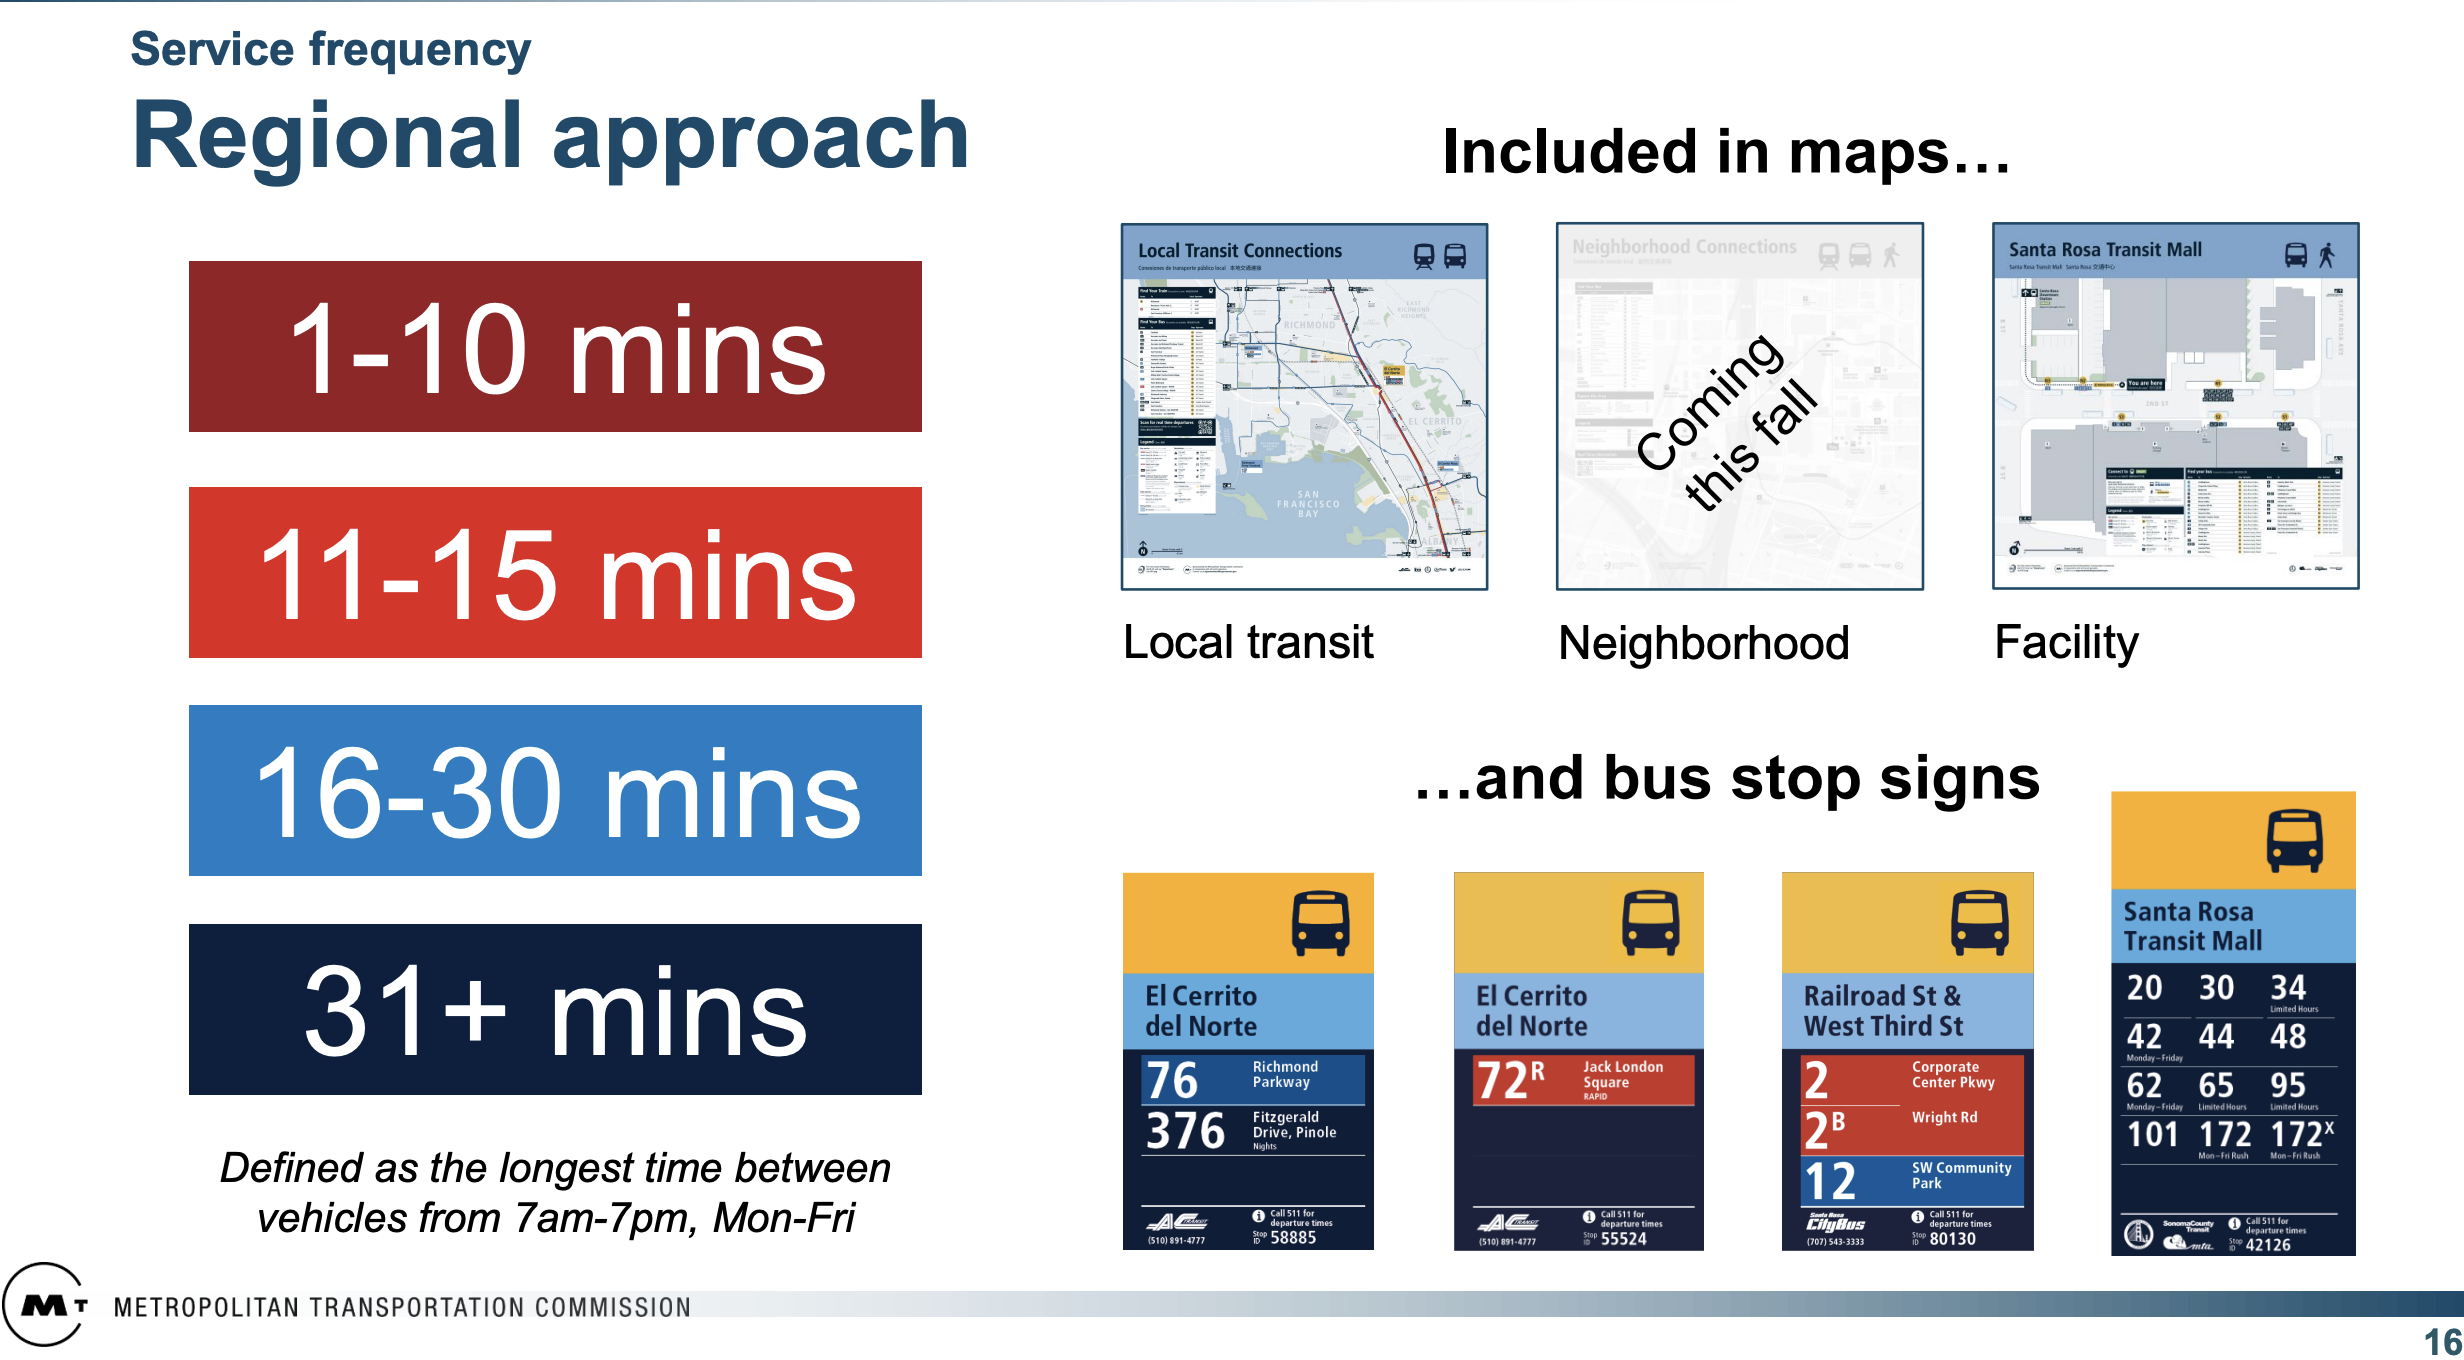
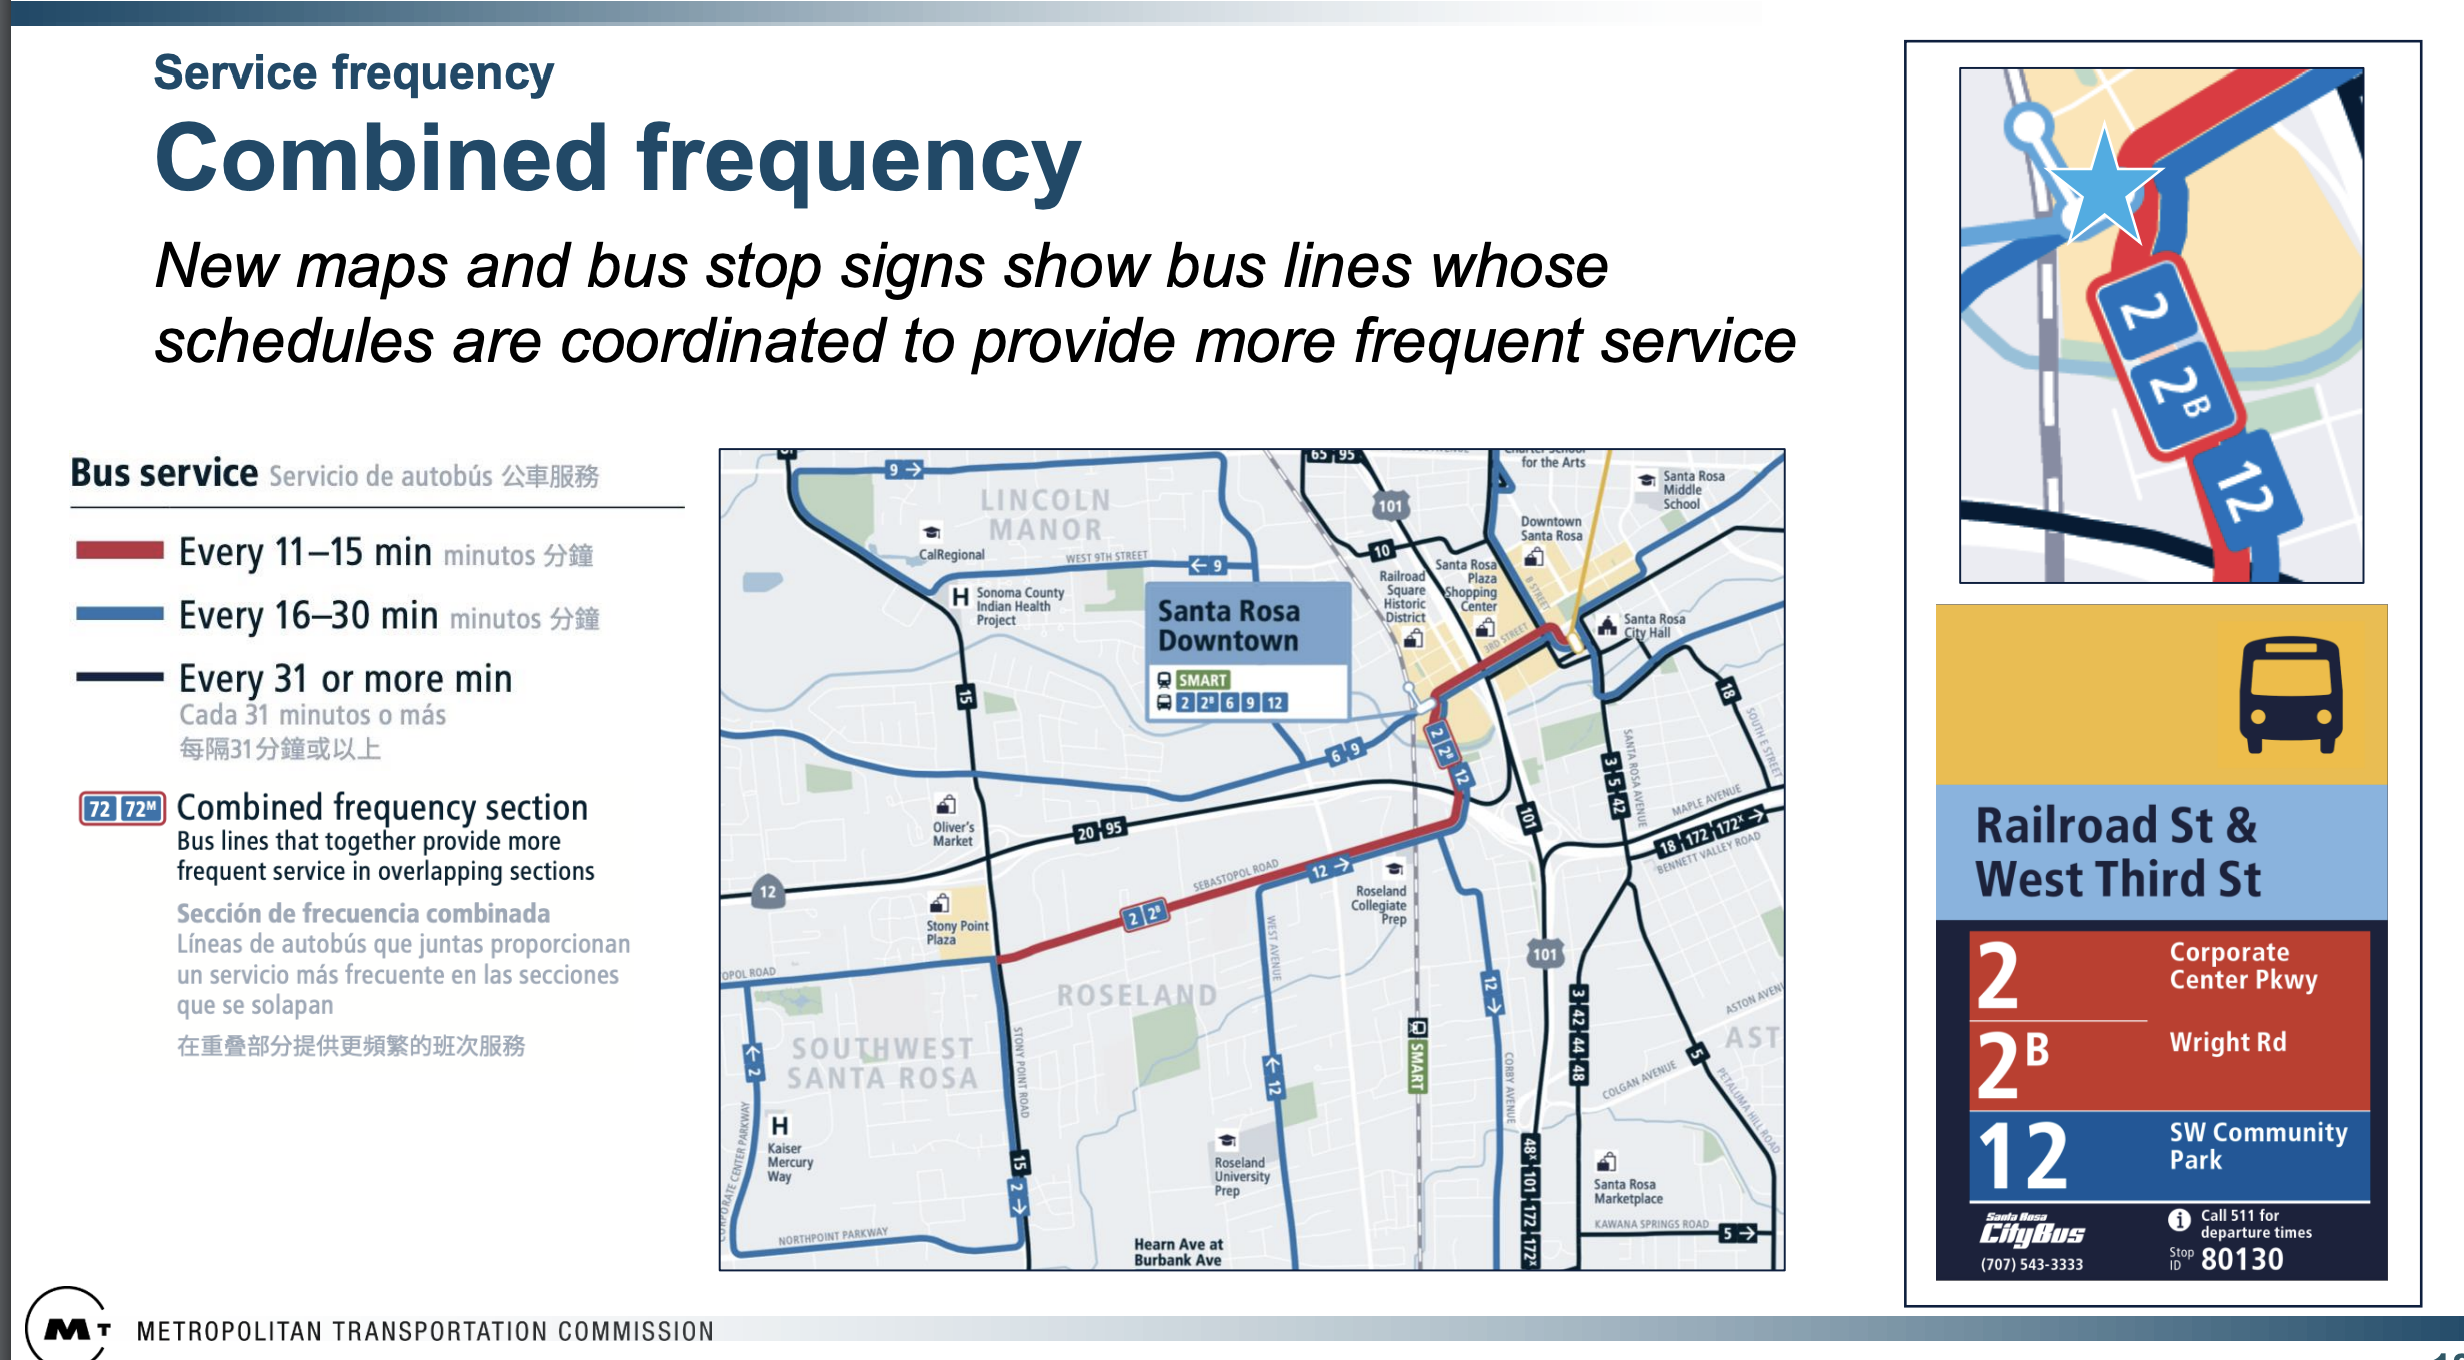
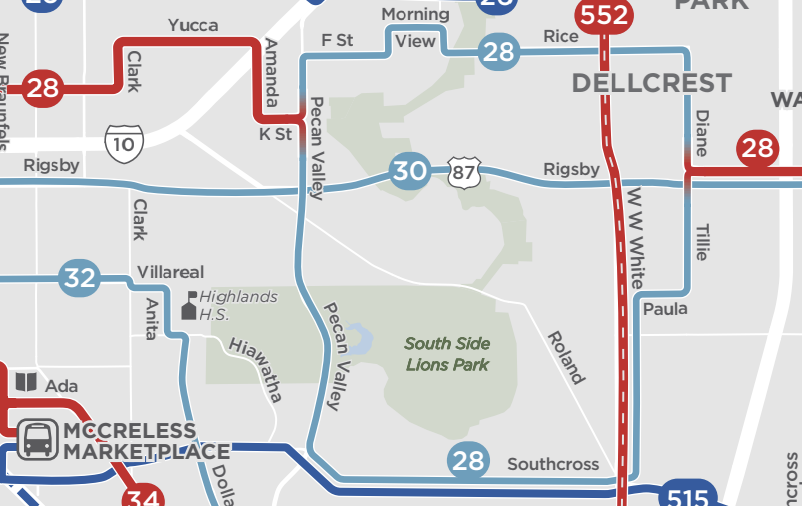
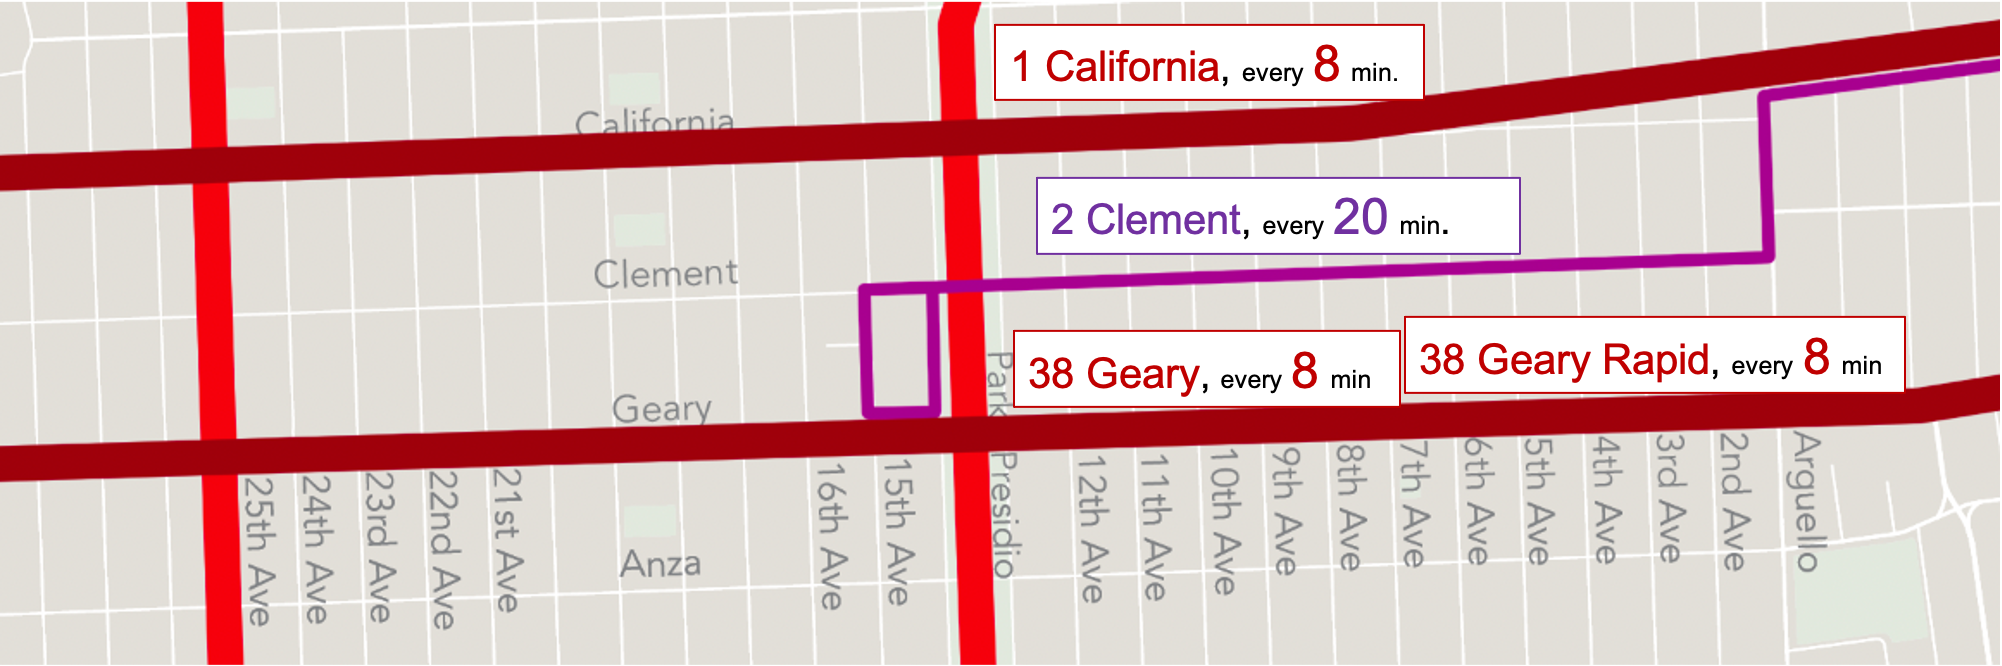
  2. Information barriers, such as the lack of a clear map.  (In many regions, the only regionwide map, if it exists, is more like a diagram of turf.  It’s designed to clarify what agency controls what rather than help people understand their travel options.)  Other information barriers include information systems that don’t describe how to use other agencies’ networks to complete common trips.
  3. Service Design Barriers, where a route ends at an agency boundary even though almost everyone on the bus is trying to go further.
Regional-Transit-Diagram

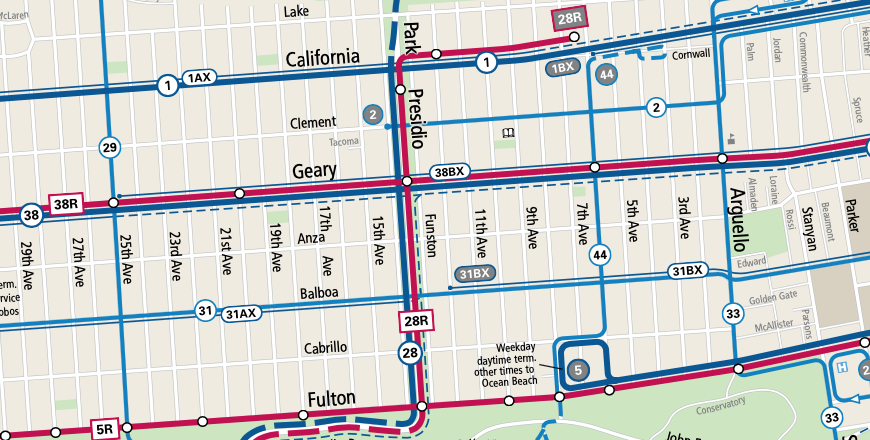
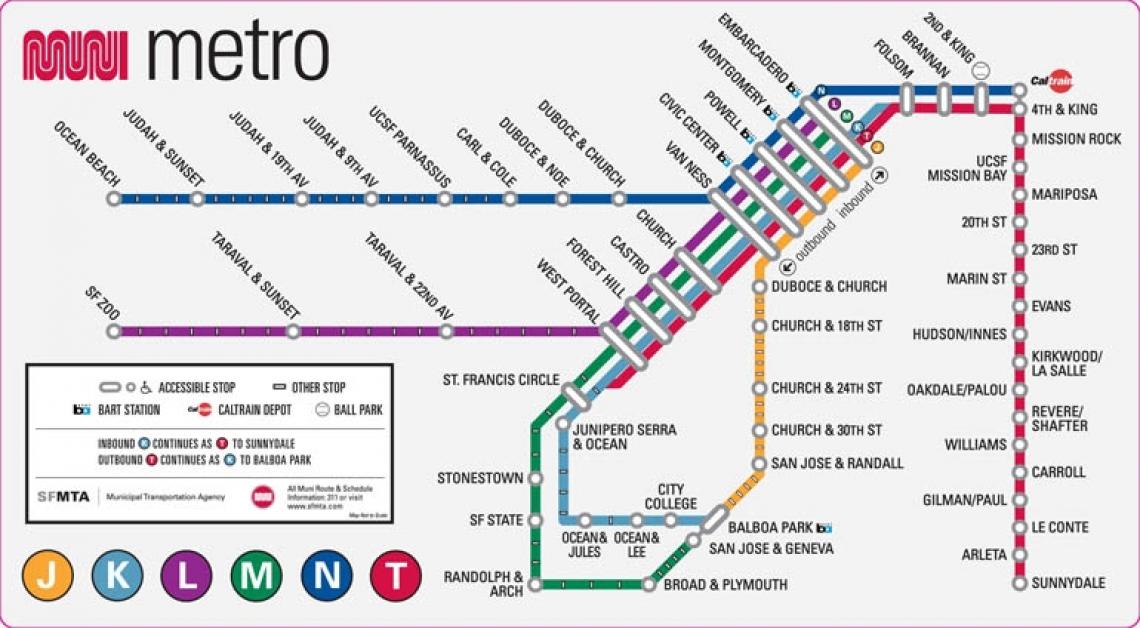
A typical old regional transit diagram, showing areas of turf but no sense of what service might be useful (no indication of frequency, for example).  (MTC)

For decades, it’s been easy to propose that some grand merger of agencies would solve problems of integration, but the obvious problem was you would have to merge the whole Bay Area into one transit authority serving almost 8 million people, in a region around 100 miles long.  That population would mean little citizen access to the leadership, while the huge area would mean that people planning your bus routes may be working in an office 50 miles away.  It just doesn’t work when the sense of  citizenship is as understandably decentralized as it is in the Bay Area.

What’s more, if you value transit-intensive core cities, places like San Francisco and Oakland, or if you want your city to be more like those places, you have an especially strong reason to want local control.  These places need more transit than the whole region wants on average, so they will struggle to get adequate service from a regional transit agency, whose decisions will tend to converge on the average regional opinion.

Many North American regions are seeing conflict around this issue, and are evolving a fascinating range of solutions.  Many of these solutions involve additional funding from the cities that want more transit than the regional average.

Some core cities are proud to have their own city-controlled transit systems separate from what regional agencies do (San Francisco, Toronto, Chicago).  Some pay their regional transit agency for a higher level of service in the core city (Seattle, Salt Lake City).  Some run their own transit systems overlaid, often messily and confusingly, on the regional one (Washington DC).   Many more core cities are going to face this issue soon, especially if regional politics continue to polarize on urban-exurban lines.

Apart from the issue of urban-exurban differences in the need for transit, there are also real challenges when a single transit agency becomes enormous, especially if it provides local service over a vast geographic area.  Los Angeles is a great example.   As an undergraduate in the 1980s, living in the region, I marveled at what I assumed to be the stupid chaos of provincialism.  The region had a big transit agency, which has evolved into what we now call LA Metro, but many cities within the region ran their own transit systems, which were tangled up in each other, and with the regional agency, in complex ways.  As an undergraduate, I assumed that progress would mean merging all this into one giant agency that could provide the same product everywhere.

And yet: in those days, everyone hated the regional agency, but loved their city ones.  And there were good reasons for that that weren’t anyone’s fault, and still aren’t today.  You could get your city’s transit manager on the phone, but not the regional one.  Small city governments can fix a bus route and put up a new bus shelter in the time it would take the regional agency to organize the right series of meetings.  Again, nobody’s at fault there; these are natural consequences of smallness and bigness — in corporations as well as in governments.

Which is why, even in Los Angeles, the trend is not toward mergers.  Today, many city systems in the county are doing excellent work at their local scale.  LA Metro has improved massively as well, of course, but its costs are still high; more important, it’s still very big and therefore inevitably feels distant to many people — again, not the fault of the folks working there.

Meanwhile, a clearer negotiated boundary between regional and city functions is slowly starting to emerge.  One idea, for example, is that a key role of city systems is to run services that don’t meet regional standards for ridership, but that the locals feel to be important.  The division of labor among agencies is not what anyone would design from scratch.  But great work has been done over the years to build clearer relationships, or what I will call, later in this post, “good fences.”

City-operated transit is growing more popular in North American for another excellent reason:  Most of transit’s ability to succeed is already controlled by city government: specifically the functions of land use planning and street design.  If a city government feels in control of its transit, it is more likely to exercise those other functions in ways that support transit rather than undermine it.  San Francisco’s recent decision to combine traffic and parking functions with transit under one city agency shows a new way of thinking about the need to get this right, but it would be impossible if San Francisco relied on a big regional agency for its transit service.  Whenever someone proposes to turn a city transit system over to a consolidated regional agency, I have to point out that integrating in one dimension (between geographically adjacent services) means disintegrating in another (between key functions of city government.)

So there’s no simple answer.  City control creates a nasty patchwork of geographic integration problems across adjacent cities in a region.  The big regional agency has a different integration problem, which is with the land use and street design functions of municipal governments that don’t control their transit and therefore have trouble caring about it.  Whichever thing you integrate, you’re disintegrating the other.

What’s the answer?  It’s for each region to feel its way through the inevitable tensions to its own solution.  But I’d propose we start old fashioned idea made famous by a Robert Frost poem:

Good fences make good neighbors.

Neighbors have an easier time being friendly if they have a very clear agreement about where their boundary is.  Collaborating with your neighbor to mark the boundary, and fence it if need be, is a peacemaking gesture.  This is as true of neighboring landowners as it is of nations.  And it’s certainly true of transit agencies.

What does it mean to have a clear sense of boundary?

It’s not just that both sides agree where the boundary is.  It’s also that it’s easy for both sides to live with the boundary, and work across it as need be.  For nations, it’s much easier to manage a boundary that runs across a natural barrier, so that the natural boundary reinforces the agreed boundary — the Rio Grande River between the US and Mexico, say, or the Great Lakes along the US-Canada border.  The worst possible national boundary is something like the 49th parallel, the US-Canada border in western North America, an arbitrary line that runs perpendicular to most mountains and valleys.  Only the extreme friendship and cultural affinity between the two countries makes this boundary workable.

All that is true of transit agencies as well.  Let’s talk first about local networks, and then, separately, about the relationship between networks of different scales.

Boundaries between Adjacent Local Transit Agencies

A bank of hills or a water body means that there are limited points of access across the boundary, called chokepoints, and this in turn means people are used to going out of their way to cross that point.  That means, in turn, that a well-placed transit connection point adjacent to the bridge or pass is an easy place for transit agencies on the two sides to converge.

On the other hand, a boundary that runs across a flat expanse of urban area, so that many people are literally across the street from the other side, is a problematic transit boundary.  In this case there is decentralized demand in all directions crossing the boundary at many points.  This makes it harder to bring both agencies to a shared focal point for connections between the agencies.  It also means there are lots of relatively short trips flowing over the border, and these benefit from a continuous network of service rather than an interrupted one.  As in many US states, California transit agency boundaries tend to default to county lines, and where these create that problem, it’s a mess for transit.

Some of this wisdom is already encoded in the boundaries of the East Bay agency AC Transit.  Near the Bay, the border between Alameda and Contra Costa counties cuts across dense urban fabric, so it would be an awful place for a transit network to end from the point of view of either side.


Fig1-WholeBayArea BS2_REV3_040915_0

Regional transit map, with boundary between Alameda and Contra Costa Counties highlighted red. Note that AC Transit extends across boundary next to the bay (SPUR report)

Recognizing this, AC Transit was constructed to unite the two sides of the county line where the urban fabric was continuous, while dividing from other agencies along natural hill and water boundaries, even where the latter are not county lines.  This is an important example for many US regions where counties are the default planning units, and arbitrary boundaries drawn in the 19th century (or before) risk turning into walls that sever transit access.

For AC Transit, the “good fences” solution was to put the border in a place that worked well for both sides — worked well for transit customers, that is, not for anyone’s desire for turf or empire.  That tends to mean looking for the natural chokepoint and putting the boundary there.

This observation also helps to clarify the city transit option.  Even in big urban areas, some cities have a geography that makes it easy for much of the transit to be city-controlled, typically because of natural chokepoints along the edges that help isolate the city-scale network from the regional one.  On the other hand, if the city boundary is logically pierced by long, straight local transit corridors that logically function both within the city and beyond it, a municipal network is less viable.

Screen Shot 2015-08-03 at 12.59.36 PMBurbank, California is a good example of a city where most main streets are parts of much longer logical lines running deep into adjacent cities, so its city limits would make especially poor transit boundaries.  Burbank therefore profits from its reliance on LA Metro, which runs long, continuous lines across city boundaries many of them converging on Burbank’s downtown.  The regional network is also, logically, the local one.

Screen Shot 2015-08-03 at 1.00.05 PMNearby Pasadena (considered together with Altadena) has good geography for a larger city role.  It has hill barriers on three sides — only the east edge is really continuous with other dense urban fabric — so fewer of its internal corridors necessarily flow into other cities.  (Areas whose density is so low that they might as well be wilderness as far as transit is concerned — San Marino in this case — count as natural barriers to some degree.)  Another important feature is that Pasadena has a frequent regional rapid transit line running through, so its local lines don’t need to extend far out of the city to make regional connections.

So Pasadena could run most of its local transit system if it wanted to, because a logical network would consist mostly of internal routes.  Burbank could not, because most of its local service is logically provided by routes that continue beyond the city limits.

Do not quote me saying that Pasadena’s transit should be more local.  I am not saying anything about what the regional-local balance should be in these cases, but merely observing how the geography makes the opportunities larger or smaller.  One value of Pasadena being served by the regional agency, for example, is that it can eventually be part of a larger high-frequency grid, with all the liberty that brings.

Local – Regional Transit Boundaries

All that is about what happens between local networks.  But another “good fence” can be a clear division of labor between local and regional services.   Regional services that are designed as rapid transit (widely spaced stations for fast operation between them, relying on local transit connections to get closer to most destinations) do not need to be the same agency as the local service meeting them; in fact, this can be a very clean “fence.”  Obviously you have to work on the specific problems of integration: information, fares, etc., just as adjacent local agencies do.  But there’s little need to merge or change boundaries in these situations.

There will always be seams in a transit journey, just as there will always be the need to make connections.  The conversation should not be about how to get rid of seams but how to put them in the right places, so that they work for both sides, and how to manage them so that travelers can flow through them easily.

Another way of thinking about the geographic issues I’ve been laying out here is that if you require a connection to continue your trip, there should be a rich payoff in terms of destinations you can reach.  The same is true for any hassles created by seams.  It’s like planes: it’s a drag to change planes, and especially to change between airlines, but it’s kind of cool, while you are changing planes, to look at the departure board and think about all the other places you could also get to via this connection.  What’s more, all those connections are crucial to making your flights viable for the airline, even if you don’t use them.

The logic of connections is the logic of good seams in general.  They happen in places where it already makes sense for transit services to be discontinuous — either because of a natural boundary or because of a clear division of labor between regional and local service.  Those “good fences”, once found, can make for happy neighboring transit authorities, which will find it easy to work together for the sake of the customer’s liberty.

Sure, let’s regionalize the right things: fare media, information systems.  (An often-neglected one is service change dates, so that timed connections between agencies don’t get broken because the agencies change their schedules at different times.)  Some mergers may make sense, such as between BART and Caltrain to create a regional rapid transit agency.

Big transit agencies and little ones are both excellent things.  The trick is to get the fence right.


UPDATE: For a book-length academic analysis reaching a similar view, see Donald Chisholm: Coordination without Hierarchy.  1992, UC Press.  H/t David King.
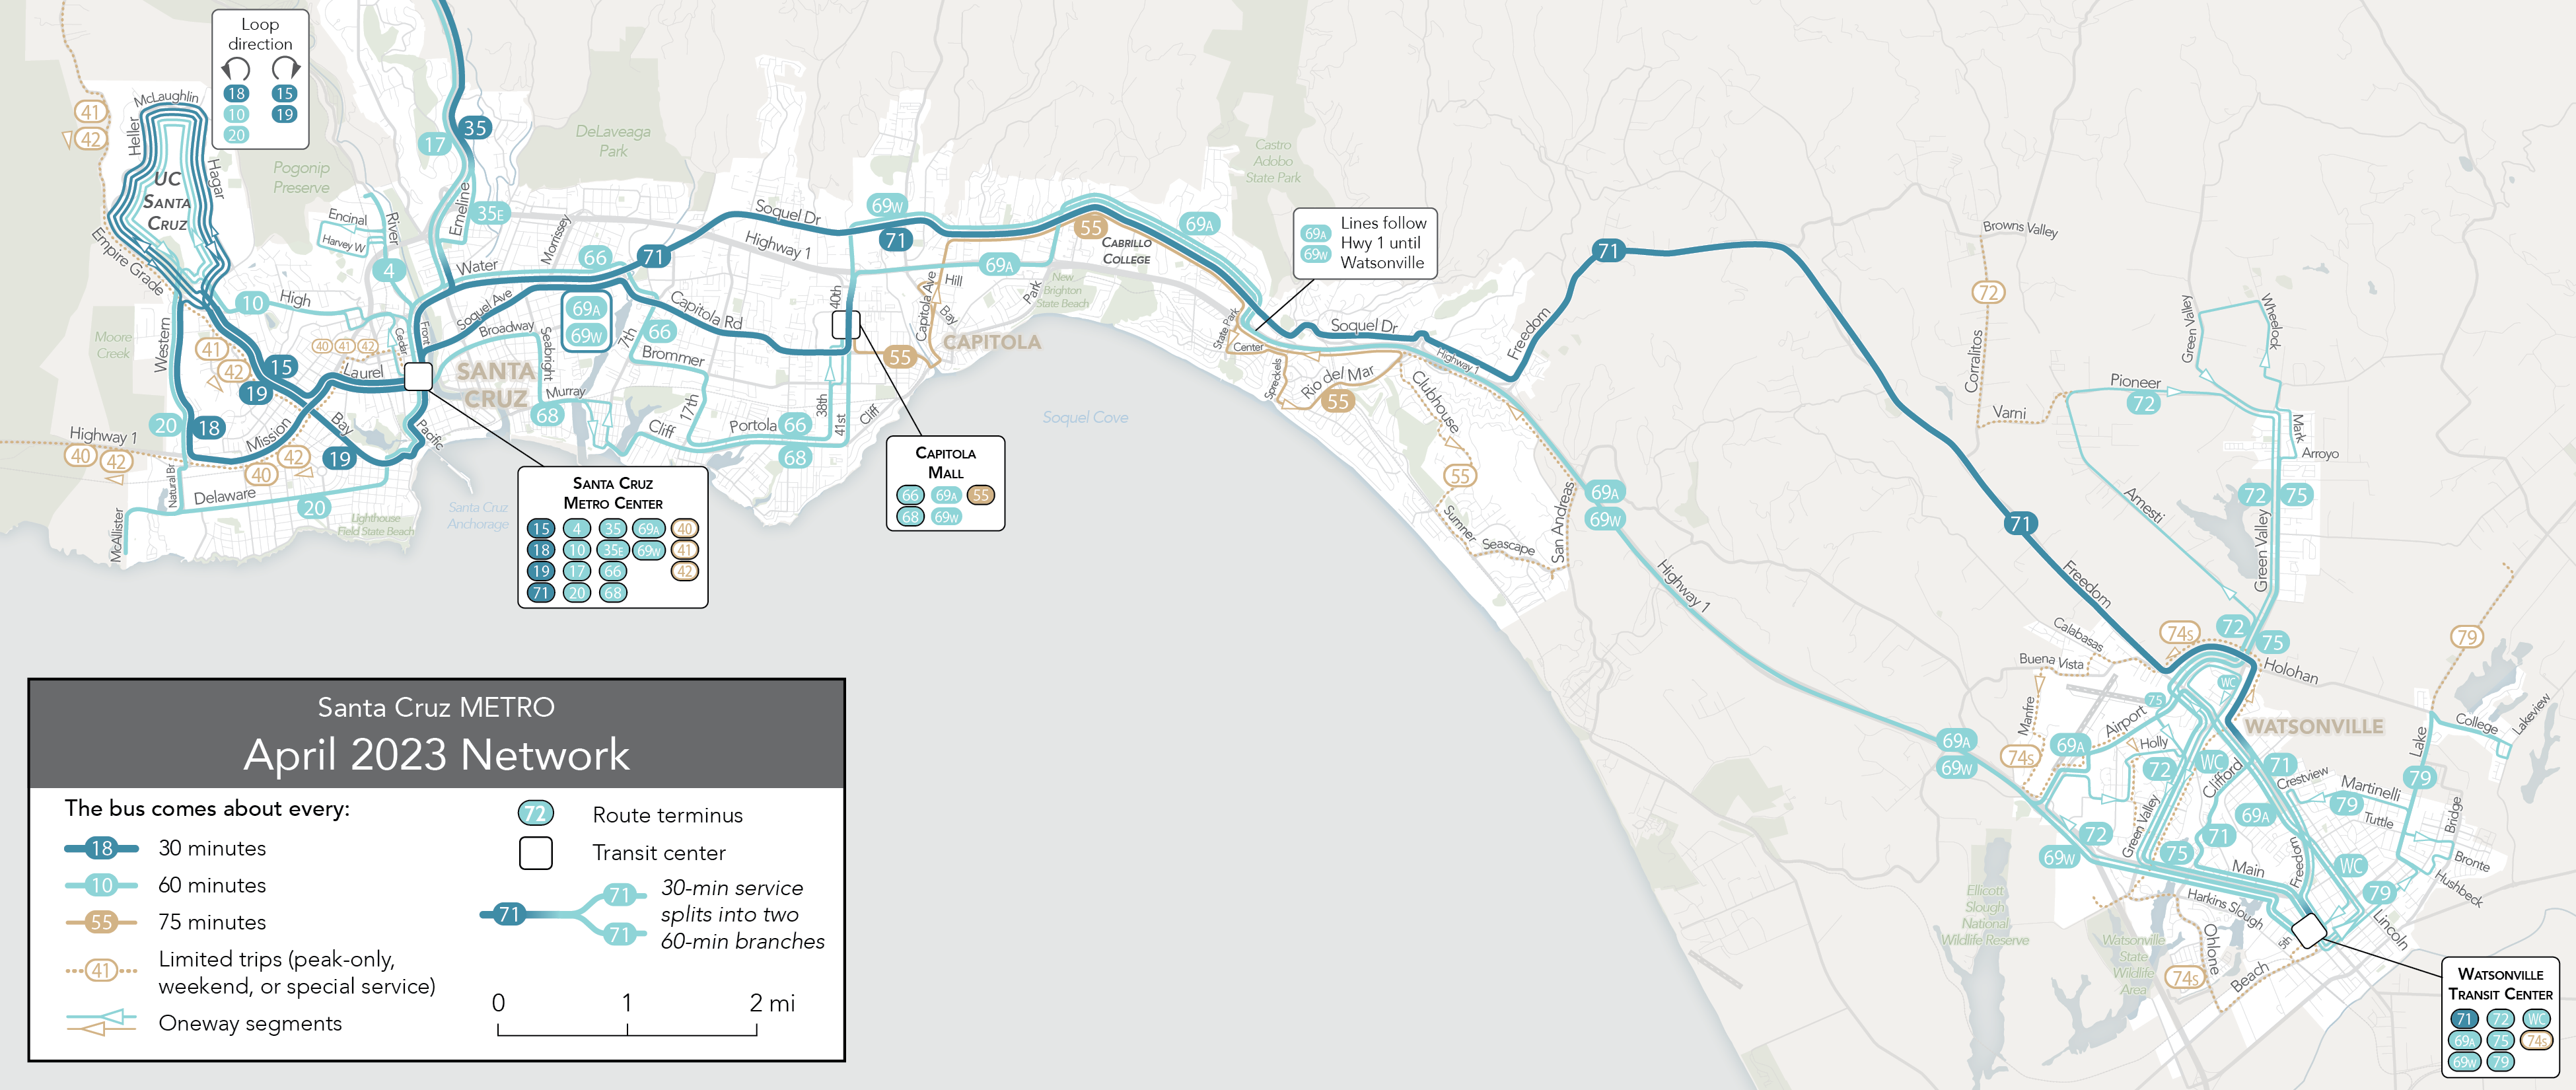
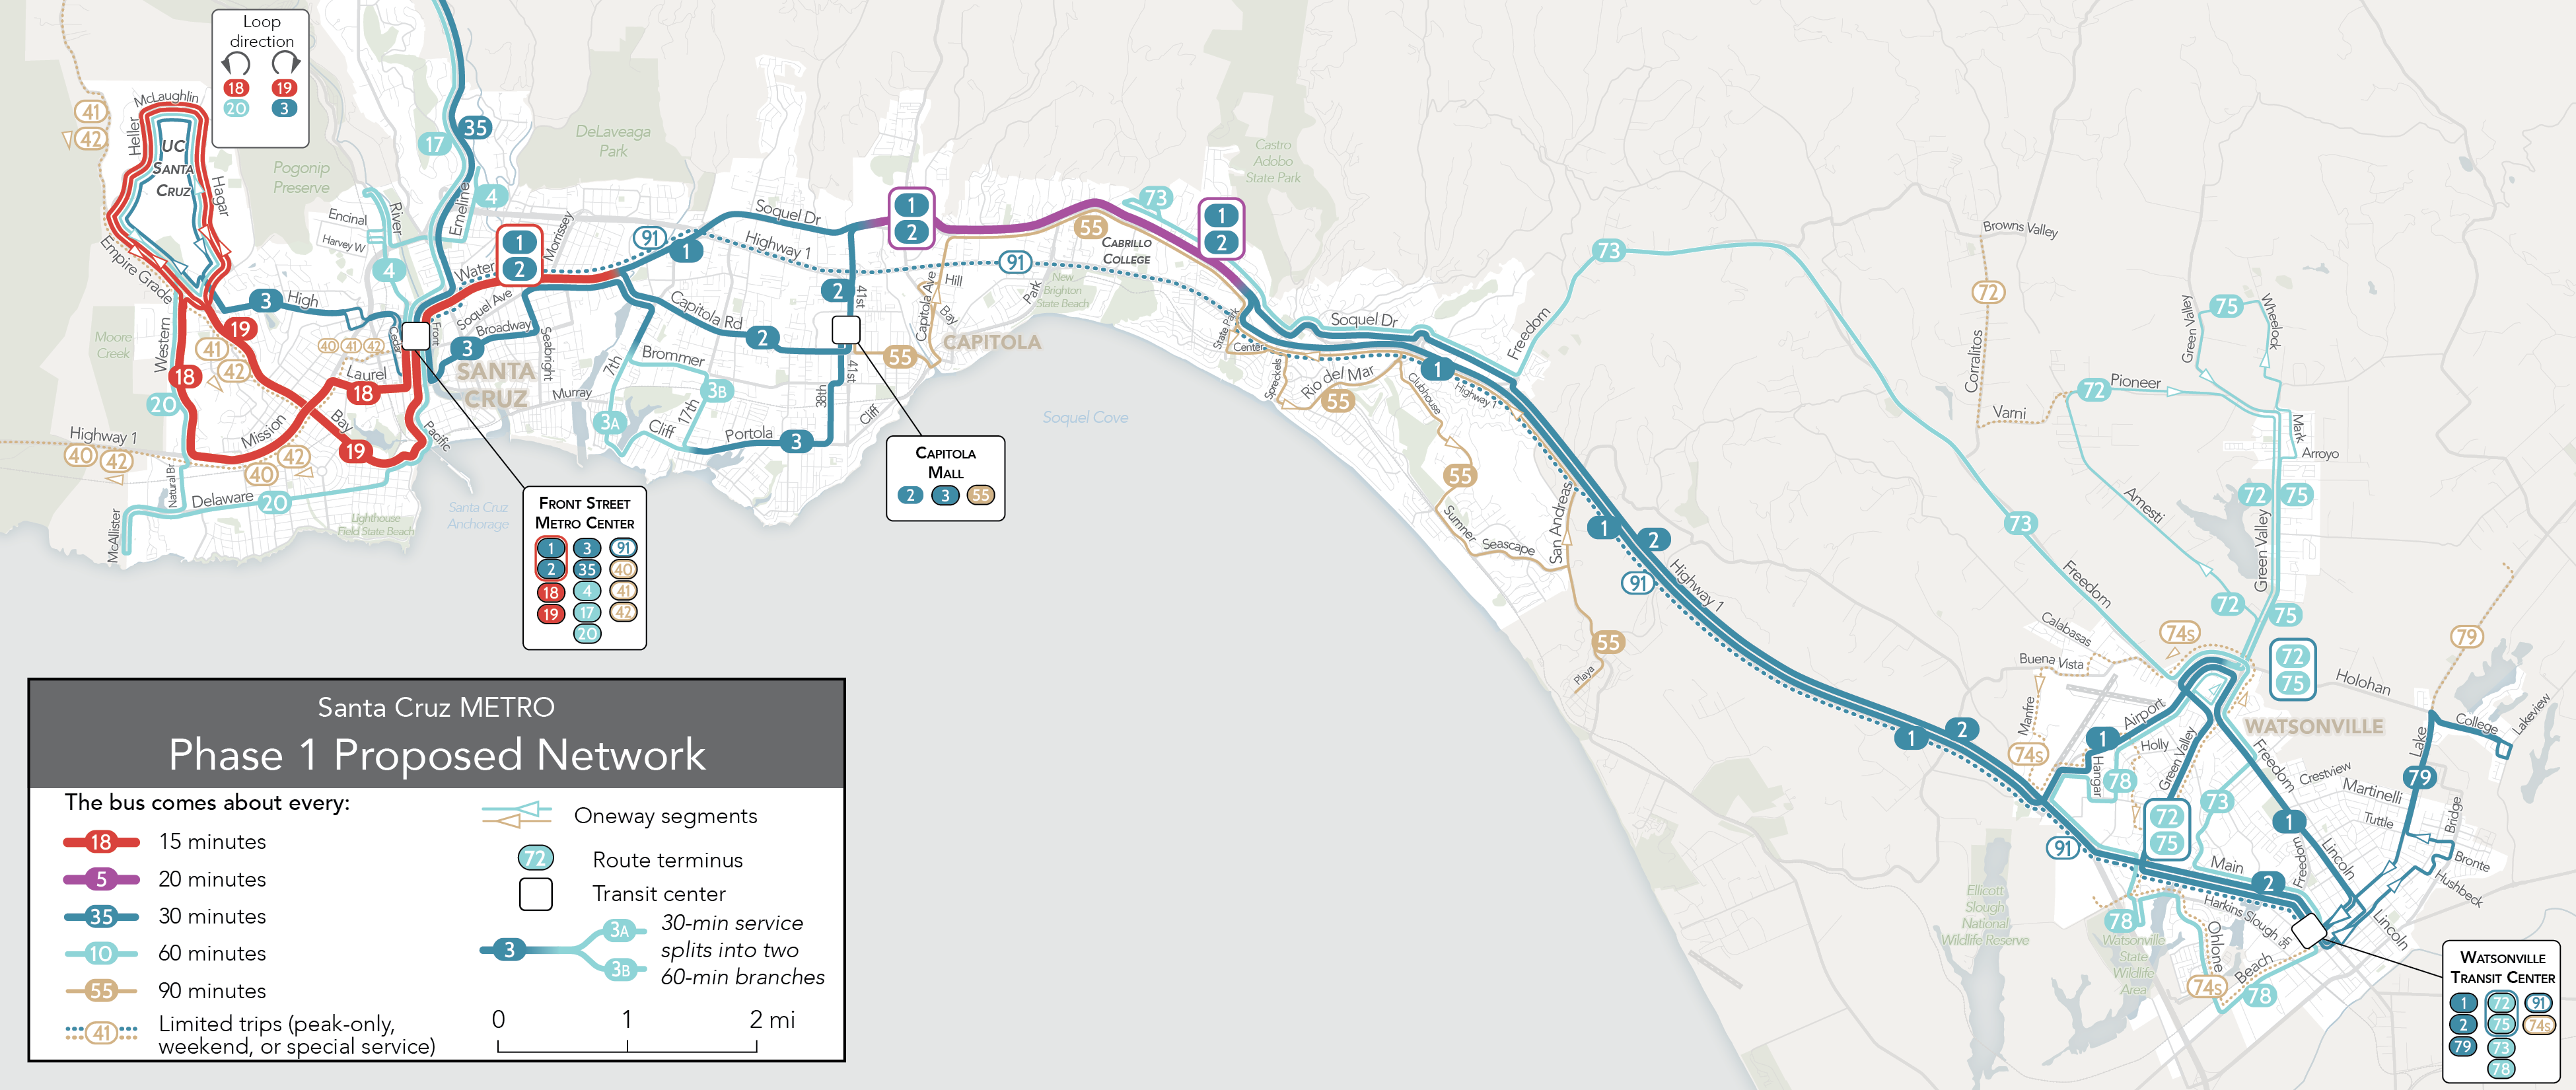
San Francisco: A world-class transit map unveiled

A few years ago we assisted San Francisco Municipal Transportation Agency in rethinking how they talk about the various services they operate.  Our key idea was to classify services by tiers of frequency, while also distinguishing, at the highest frequency only, between faster and slower services.  In extensive workshops with staff, we helped the agency think through these categories and the names to be used for them.

It's great to see the result coming out on the street.  The old-fashioned term "limited," for example, been replaced by "Rapid," a new brand that emphasizes speed and reliability improvements as well as frequency and widely spaced stops.  

But the biggest news is that a new network map, by Jay Primus and David Wiggins, is about to debut.   Don't open it yet!!  Before you do, look at it in a fuzzy small image:

Muni_map_2015

Notice how much information you can get just from this fuzzy picture.  Most transit maps are total nonsense at this resolution, but in this one, even though you can't even see the legend, you can see the structure.  All you need to know is that bigger, brigher lines are more useful lines, because they tend to be faster or more frequent.  In other words, this works just like any coherent street or map (paper or online) in which the faster roads are more visually prominent.  Any good map is legible at multiple levels of attention, including very zoomed out like this, and in loving detail of every right and left, which you'll also admire if you zoom into the massive PDF.

Why has it taken so long for transit maps to get this clear?  Well, first of all, you have to figure out that frequency, not speed, is the primary equivalent of speed in a highway map.  Highways and streets can all be ranked by their design speed, but in transit, frequency trumps speed in determining most kinds of utility, and speed distinctions matter most where frequency is already high.

(The exception, high speed but low frequency service, tends to be commuter rail and commuter express bus service.  That service is so intrinsically specialized and complex that it makes a complete mess if you put it on the map with the all-day frequent routes.  These ephemeral routes must be faded out; on this new map they are the weakest lines of all.  The previous map was chaotic precisely because it used the strongest color — red — for these most specialized and ephemeral services, concealing the structure of interdependent service that is running all the time and that vastly more people will use.)

What are the other barriers to maps of this clarity?  Well, you have to decide whether your goal is information (helping people understand their options) or marketing (which at its worst means deliberately confusing people so that they do you want them to do).   I have always argued that in transit, clear and beautiful information is the best marketing, but many professional marketers disagree.  

This map is glorious because it's 100% information.  Services aren't highlighted because someone thinks that they serve "target markets" or "more important demographics", for example.  Everything is mapped, and named, according to its potential usefulness to anyone.  The more diverse the range of people who'll find a service useful, the brighter the line is.

Of course, it doesn't show everything, but that's also why it's clear.  I'm sure I will be bombarded with comments pointing out that they don't show how San Francisco's network connects to the wider region's, and that they don't show how transit integrates with cycling, walking, private transit, Segways, and whatever else.  Including too much non-transit information is also a great way to make transit maps confusing.  This map is just what it is, a map of San Francisco's fixed route transit network.  It's also, in my experience, one of the best in the world, something even the world's best transit systems could learn from.  

silicon valley: bus rapid transit that’s faster than driving?

Screen Shot 2014-11-13 at 10.50.18 AM

El Camino Real BRT Alignment


Silicon Valley is easily viewed as a  car-oriented place, where tech giants rule from business parks that are so transit-unfriendly that they have had to run their own bus systems to bring employees from afar.  But one interesting transit project is moving forward: the El Camino BRT, a proposed  rapid transit line connecting Palo Alto and central San Jose. 

El Camino Real ("the Royal Road") is a path defined by Spanish missionaries as they spread north through California. It lies close to the old railroad line now used by Caltrain, and the two facilities combined  determined the locations of the pre-war transit-oriented downtowns that still form the most walkable nodes in the area.  

Today El Camino is the spinal arterial of the San Francisco peninsula, passing through or near most of the downtowns.   This spine continues across Silicon Valley, through Palo Alto, Mountain View, Sunnyvale, Santa Clara and finally downtown San Jose.   (The BRT will not extend the full length of the peninsula, because it is a Santa Clara County project and the county ends at Palo Alto.  However, successful projects do get extended sometimes.)   In Silicon Valley, too, the corridor is far enough from Caltrain that they are not competing.  Caltrain will always be faster but probably less frequent than the BRT, optimized as it is for much longer trips including to San Francisco.

In land use terms, the project corridor is ideal territory for transit – lots of employment and commercial destinations, with strong anchoring institutions at each end.   But while the path is historic, the modern street was designed with a singular focus on auto travel time, as a six-lane divided boulevard. Auto and transit travel times continue to increase substantially as more people come to live and work in the corridor, and even more population and employment growth is forecast for the coming decades.  

Santa Clara VTA and the FTA released the Draft Environmental Impact Report for this project last week, detailing multiple alternatives relating to the extent of dedicated lanes and street configurations. The purpose and need statement tidily summarizes the rationale for this investment:

El Camino Real is an important arterial in Santa Clara County and on the San Francisco Peninsula. However, El Camino Real is predominantly auto-oriented, and streetscape amenities are limited. There are widespread concerns regarding congestion, appearance, and safety, and a general public perception exists that the corridor is not well planned. Exacerbating current conditions, Santa Clara County is expected to experience substantial growth in the next 30 years from 2010 to 2040. If no improvements are implemented, heavy demand will potentially be placed on the existing transportation infrastructure, which is planned to increase by only 5 to 6 percent. 

Screen Shot 2014-11-13 at 11.40.10 AM

This striking graph (which I couldn't locate in the report itself, but which is reproduced over at the TransForum blog), compares transit travel time among the four alternatives:

In the A4c alternative (the alternative with the greatest extent of exclusive lanes), a trip during the peak through the corridor would actually be faster on transit than driving, and dramatically faster than the same trip today.

The various alternatives' alignments are compared below:

Screen Shot 2014-11-13 at 11.35.00 AM


As usual with arterial BRT in the US, there will be some mixed-traffic segments, and the line will only be as realiable as its least reliable point.  Note that the alternatives seem to envision different responses to city limits, as though anticipating that as you get further west (which means wealthier, but also closer to big destinations like Palo Alto and Stanford University), support for exclusive lanes will decline.  It will be interesting to see if this is true, in a very educated polity, when the benefits are understood.  

replace stop signs with signals on major transit lines?

From Streetsblog's Aaron Blalick in San Francisco:

The latest of [San Francisco Municipal Transporation Authority]'’s efforts to speed up [major bus] lines to run into some neighborhood opposition involves its proposed replacement of stop signs with transit-priority traffic signals. Some Western Addition neighbors have protested a proposal to signalize five intersections on McAllister Street to speed up the 5-Fulton, one of the designated “Rapid” routes receiving upgrades under the Muni Forward program (also known as the Transit Effectiveness Project).

Initially, the complaints were driven by fears that signals would bring dangerous speeding to McAllister. Muni planners responded by holding more outreach meetings, and presented data showing that pedestrian injuries declined on similar streets after signals were added. They also say speeds won’t go up significantly, since signals will be synchronized for speeds below 20 mph.  [emphasis added]

Aaron emailed to ask my opinion, which is emphatically:  "Who could oppose something that's good for both pedestrian safety and transit speeds?"

Apparently, the remaining opposition is based on "feel":

Sean Kennedy, the SFMTA’s Muni Forward program manager, said the data seems to quelled some neighbors’ fears, but that the complaints have shifted. “What we hear is that there’s a lot of concern over the neighborhood feel,” he said. “And that’s something we can’t really dispute with facts. It’s an individual preference if people do or don’t like signals.”

So how much should we worsen transit, and maintain higher levels of pedestrian injury, for the sake of "feel"?

And how exactly does a signal change feel?  We're talking about small streets here, mostly striped with a single wide travel lane each way.  Will a signal make the street feel wider?  Are people associating signals with more traffic and just assuming signals will have that outcome?  Not if they're timed for transit rather than cars.  Well-timed signalization can be very effective at discouraging car traffic on transit-intensive streets, when that's the objective.

I spent a decade of my life as a San Francisco pedestrian, in dark ages when pedestrian safetly mattered a lot less than it does now.  Sure, it was nice to encounter a 4-way stop where stepping into the intersection was enough to stop traffic.  

But among global pedestrians like me, San Francisco is famous for very fast signal cycles, and it's not a place where you'll be ticketed for crossing on red if there's obviously nothing coming.  As a pedestrian, I find a few seconds of delay a small price to pay for a transit system that's actually respectful of its customers' valuable time, not to mention the high cost to the public of its drivers' time.  

Remember: If you want frequency, you want less delay, because that makes frequency cheaper!

quote of the week: the neglected american bus

In the six cases examined, we conducted off the record interviews with public officials, general managers, and thought leaders in each region. One of the consistent themes that emerged was that the bus systems and bus passengers were an afterthought. In every region – Chicago, New York, Boston, Minneapolis/St. Paul, Dallas/Ft. Worth, and the Bay Area – rail was the primary focus of virtually everyone we interviewed. We also found that maps of the regional transit networks tellingly either included a jumbled mess of bus routes behind a clean rail network, or ignored bus altogether.

It is likely this bias toward rail has very little to do with governance. But it does have a negative impact on transit delivery, particularly from a customer point of view. The vast majority of transit riders in the United States are on buses, so it would make sense to devote more resources and attention to them compared to rail riders, rather than less. Also, improvements to the bus network are likely to be less expensive than new rail expansions, and would be likely to yield substantially more net benefit per dollar. Yet while every region we visited had a new rail expansion either in planning or under construction, outside of New York none of the regions had any plans for regional bus networks, reorganization of existing bus systems, or major expansions of bus rapid transit (BRT).

Joshua Schank, President CEO,
Eno Center for Transportation
"The Case of the Neglected Bus"

I've certainly noticed, in my own work, that the aggressive, agency-wide commitment to building a complete access-maximizing transit system is stronger in cities that don't have much rail, or where rail is in early stages of development, as in Houston.  Key tools for total network legibility, such as Frequent Network branding, also seem to be spreading much more effectively in the midsized transit authorities than in the gigantic ones.

A while back I had a brief chat with a major airline CEO at an event.  He asked me: "So what's the future of transit.  It's rail, isn't it?"  I wanted to say: "So what's the future of aviation?  It's all intercontinental jumbo jets, isn't it?  

Or is it about people feeling free to go places?  In that case, the future of aviation is a network, where many types of vehicle have an essential role.  

should transit maps be geographical or abstract?

In some agencies, it goes without saying that transit maps should be geographically accurate.  Many agencies follow San Francisco Muni in superimposing transit lines on a detailed map of the city:

Sf frag

But research out of MIT suggests that we really need to see network structure, and that requires a degree of abstraction:

By putting alternate versions of the New York and Boston subway maps through the computer model, the researchers showed that abstract versions of the maps (as opposed to geographically accurate versions) were more likely to be easily understood in a single, passing glance. 

Here's their example:
Dish_subwaymaps

Geographical accuracy obscures network structure.  Purely geographic maps show where service is but not how it works.  

This is why a number of best practice agencies publish both kinds of maps, sometimes even presenting them side by side.  The geographic map helps you locate yourself and points of interest in the city, but you need the structure map to understand how the system works.

All this is even more urgently true for bus network maps, where complexity can be crushing to the user.  When we streamline maps to highlight key distinctions of usefulness such as frequency, we often have to compromise on geographic detail.  Obviously the best maps fuse elements of the two, but you can always find the tradeoff in action.  The new Washington DC transit maps, for example, highlight frequency (and show all operators' services together) but there's a limit to the number of points of interst you can highlight when keeping the structure clear:  

Dc slice


Roy Nakadegawa, 1923-2013

Roy NakadegawaRoy Nakadegawa, a longtime San Francisco Bay Area transit advocate and board member for both AC Transit and BART, has passed away.  I remember him a soft-spoken but effective advocate who was able, as a professional engineer, to dig into details when they mattered.  

I also remember him as someone who really understood transit networks, and considered them more important than transit technologies.  You can get a taste of that from this 2008 kerfuffle (concerning a debate that I am agnostic on, personally).

From the joint AC Transit / BART press release:

Former AC Transit and BART director Roy Nakadegawa passed
away last Friday morning, August 23, 2013, at his home in Berkeley. 
Mr. Nakadegawa had been suffering from congestive heart failure for some time.

Mr. Nakadegawa served on the AC Transit Board for 20 years,
from 1972 to 1992.  He then served on the BART Board for 12 years from
1992 to 2004.  After he left the BART Board, he joined the Board of TRANSDEF
(Transportation Solutions Defense and Education Fund), a non-profit
environmental organization created by transit activists to advocate for better
solutions to transportation, land use and air quality problems in the San
Francisco Bay Area.  In all those positions he argued for cost-effective,
mobility improving transit.

Mr. Nakadegawa was an active attendee and participant in TRB
(Transportation Research Board) meetings and was well known and respected
around the world for his depth of knowledge about transit and its relation to
land use.  He was written up in the local press for the frugality of his
travel arrangements.  When Mr. Nakadegawa served on the AC Transit Board
of Directors, its members got an annuity when they left the Board.  For
many years, Mr. Nakadegawa generously donated his annuity payments to buy
prizes for AC Transit's local bus rodeo winners.

As a BART Director he consistently advocated for cost
effective transit administration, which spilled over into his own
campaigns.  In his re-election materials
for BART Director he was proud to point out that in November 2000, he garnered
the highest vote (over 91,000 voters) of five previous BART races and spent
less than a penny per vote.  Mr.
Nakadegawa tirelessly urged his fellow board members to consider innovative
uses of BART facilities as a non-traditional source of
revenue and improved customer access, resulting in the adoption of both
permanent and experimental parking program initiatives.

 He will also be
remembered for his role in advocating BART’s Earthquake Safety Program.  He helped to raise public awareness of this
critical program, resulting in the successful 2004 passage of a bond measure to
fund it.

Professionally, Mr. Nakadegawa had been a transportation
engineer for the City of Richmond and for many years served on the Board that
administers the civil engineering exam in California.  His career as a public sector engineer
reached a pinnacle in 1989 when he was elected National President of the Institute
for Transportation of American Public Works Association and later served as its
liaison to the American Public Transportation Association (APTA), the national
transportation advocacy group.  While
with BART Mr. Nakadegawa became an active member of APTA, serving on several
committees including its Policy and Planning; Advanced Technology, Governing
Board; and Transit Management and Performance committees.

Mr. Nakadegawa and his wife Judy were the quintessential
Berkeley couple, dedicated to peace, family, public service and folk dancing.

Cards and letters should be sent to:  Judy Nakadegawa
and family, 751 The Alameda, Berkeley, California  94707-1930.